Att J - Power Calculations
Appendix J Power Calculations 20121101.doc
Registration of Individuals Displaced by Hurricanes Katrina and Rita (Pilot Project)
Att J - Power Calculations
OMB: 0923-0045
KARE Feasibility Verification Power: Page
Appendix J
Power Calculations for Katrina and Rita Exposures Registry Feasibility Sample
This document describes the power calculations for the Katrina and Rita Exposures (KARE) Registry Pilot feasibility sample. The focus of the power calculations is on the verification rate. The first section describes the analytic objective for which the power will be calculated. Section two presents the power calculations to determine the necessary analytic samples sizes to achieve the analytic objective. Finally, section three shows how the analytic sample size is inflated to produce the selection sample size.
1. Verification Rates for the KARE Feasibility Study
The analytic object is to verify the information in the FEMA database using registrant responses for three variables: trailer type, county in which the trailer was located, and city in which the trailer was located. For each of these three variables, we will construct an indicator variable that has a value of one if the database and registrant agree and has a value of zero if they do not agree. For each indicator variable, the mean of the indicator variable will provide the verification rate. The outcome of interest is whether or not the verification rate is greater than or equal to 0.75. Consequently, the power calculations will use the null hypothesis is that the verification rate is less than or equal to 0.75, and the alternative hypothesis is that the verification rate is greater than 0.75.
2. Power Calculations
The power calculations were produced using PASS 20111 software. Given the analytic, or respondent, sample size of 2,829 for the KARE sample, we would be able to detect a difference of 0.02 (or a verification rate of 0.77) with 80% power. That is, we would be able to state that the verification rate is greater than 0.75 using a one-sided binomial test. The target significance level is 0.05. The actual significance level achieved by this test is 0.0499. These results assume that the population proportion under the null hypothesis is 0.75. We will round 2,829 to 3,000 in the following calculations.
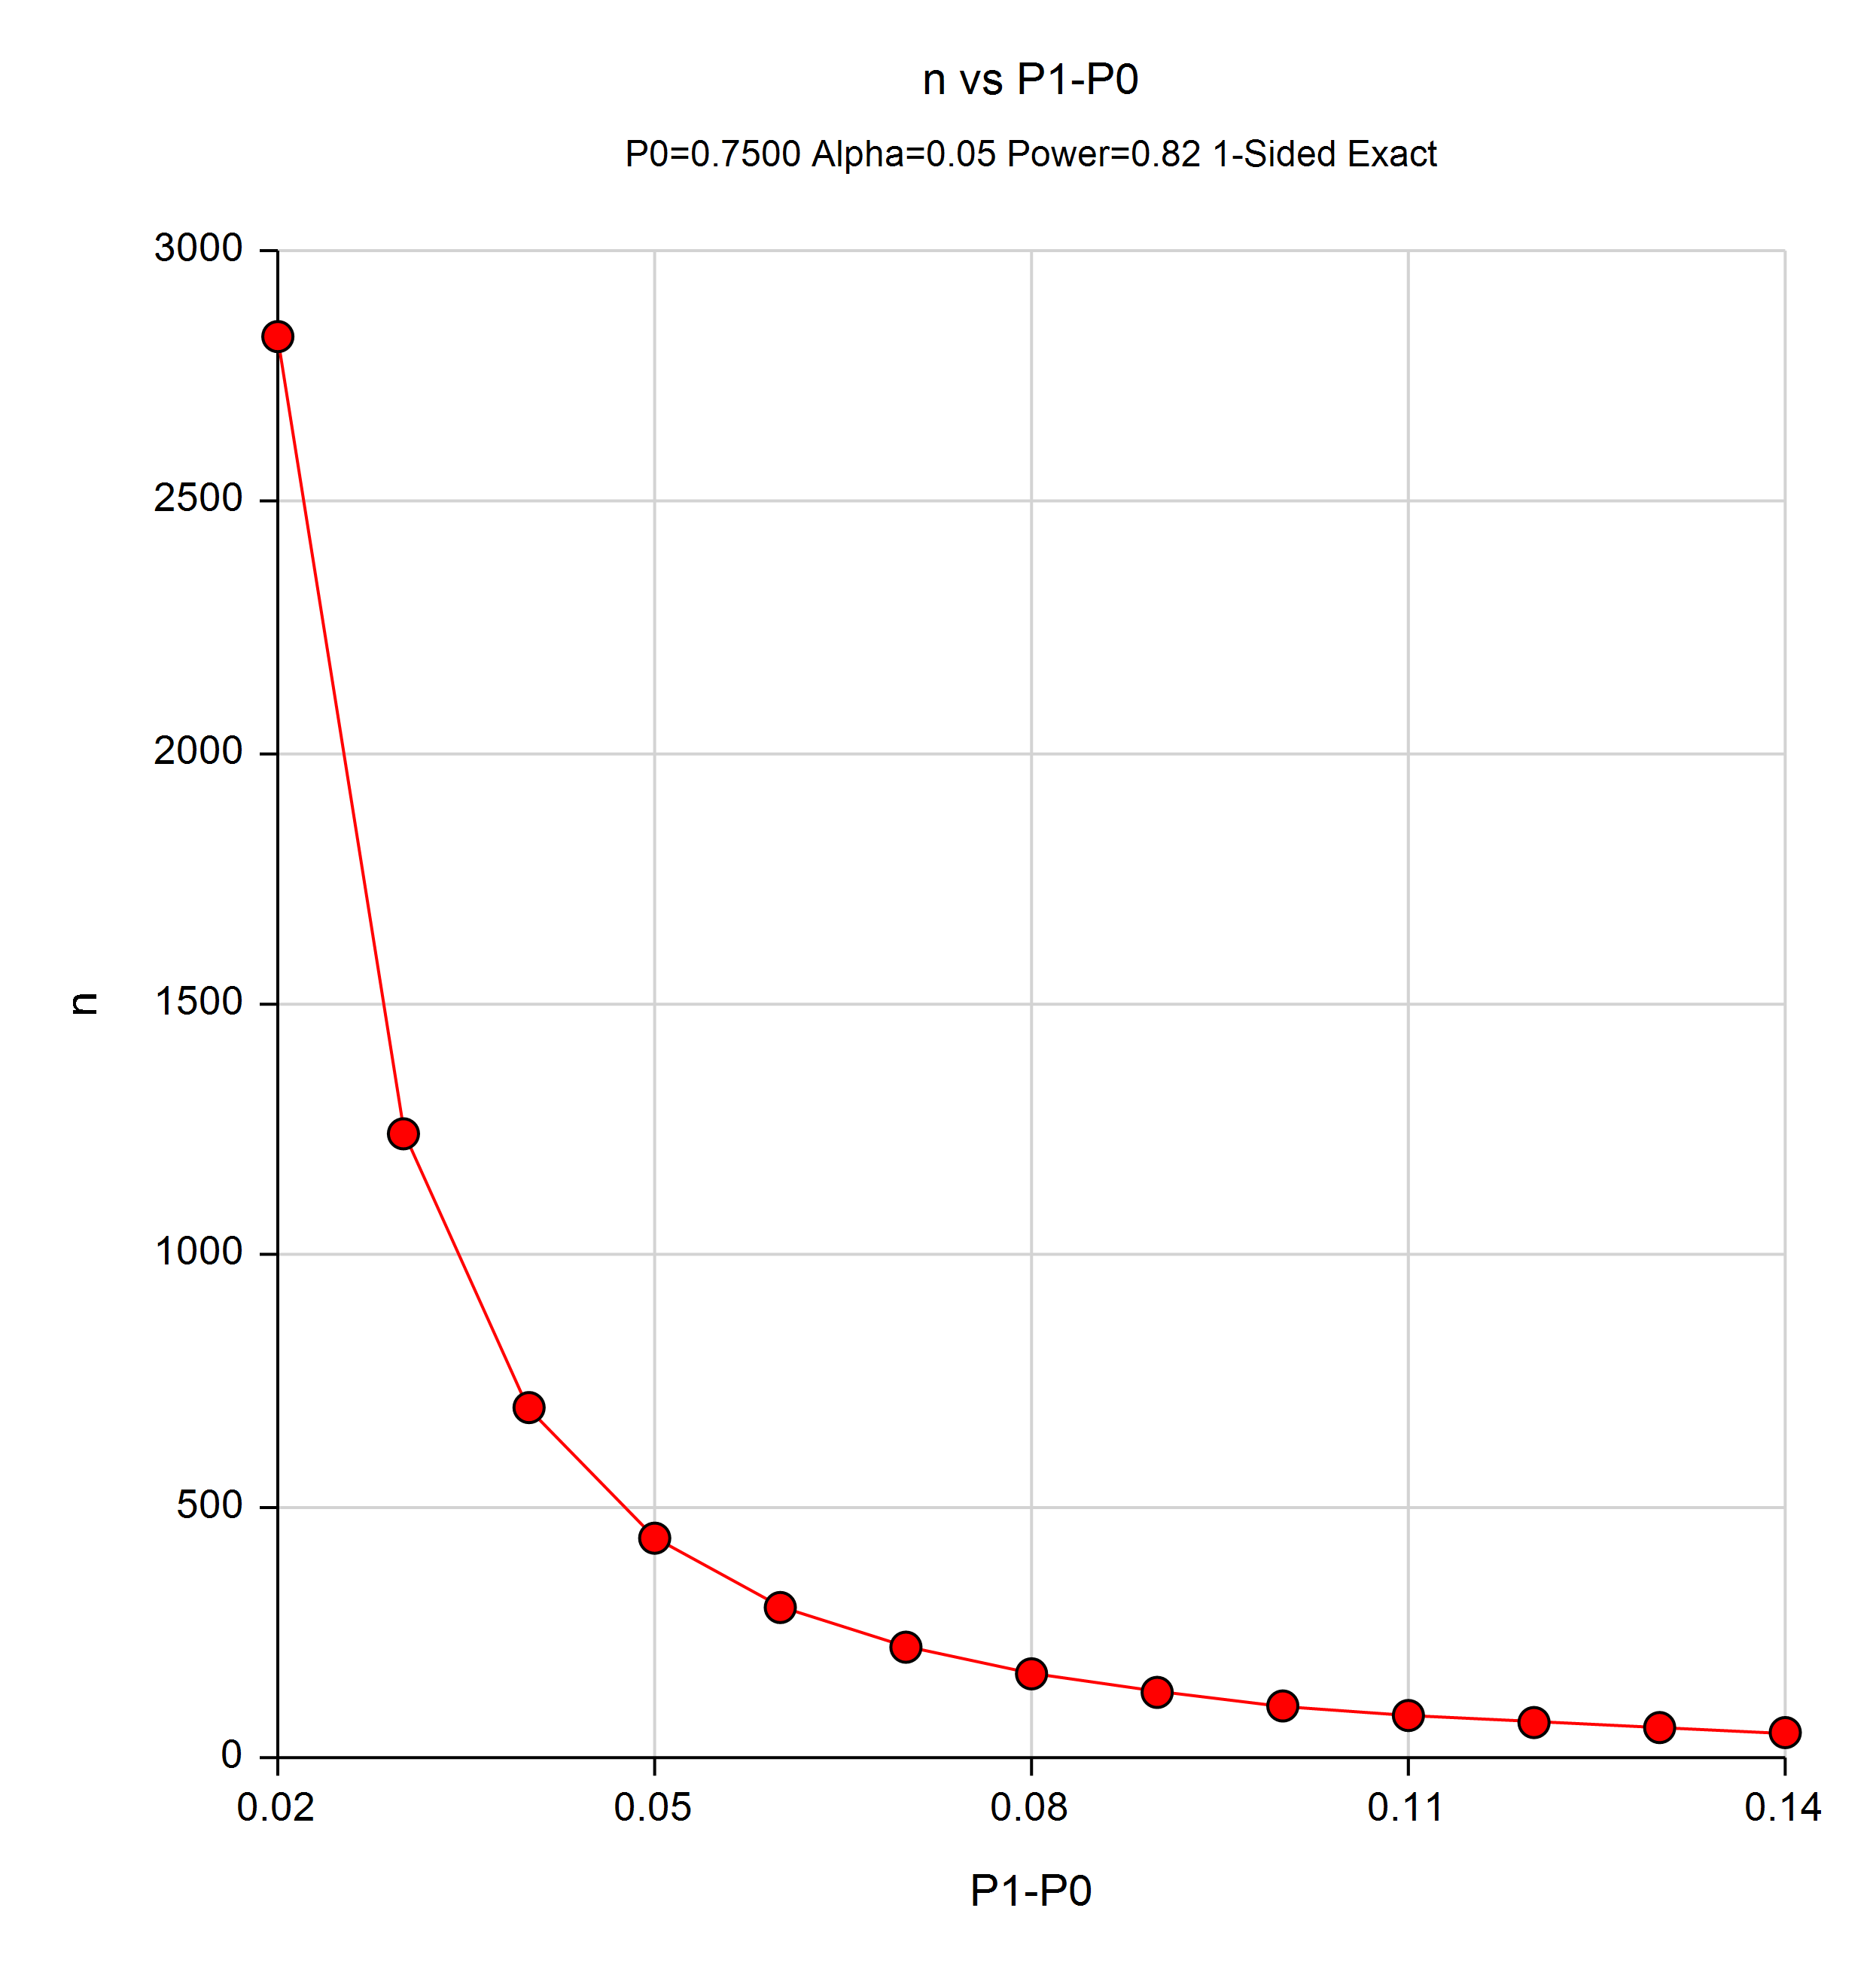
Exhibit 1 is a graphical representation of the relationship between analytic sample size and verification rate. The vertical axis (n) is the sample size necessary to detect the minimal difference between the null hypothesis verification rate (0.75) and the observed verification rate (P1). The horizontal axis (P1-P0) is the difference between the observed verification rate (P1) and the hypothesized verification rate (P0 = 0.75).
Exhibit 1. Sample Size and Minimum Detectable Difference

Exhibit 2 shows the sample size (n) and difference (P1 – P0) represented graphically in Exhibit 1, as well as, some additional variables related to the power calculations.
Exhibit 2. Sample and Difference in the Observed and Hypothesized Verification Rates
Power |
n |
Proportion |
Proportion |
Difference (P1 - P0) |
Target |
Actual |
Beta |
Reject
H0 |
0.80 |
2,829 |
0.75 |
0.77 |
0.02 |
0.05 |
0.05 |
0.20 |
2,160 |
0.80 |
1,242 |
0.75 |
0.78 |
0.03 |
0.05 |
0.05 |
0.20 |
957 |
0.80 |
697 |
0.75 |
0.79 |
0.04 |
0.05 |
0.05 |
0.20 |
542 |
0.80 |
437 |
0.75 |
0.80 |
0.05 |
0.05 |
0.05 |
0.20 |
343 |
0.80 |
299 |
0.75 |
0.81 |
0.06 |
0.05 |
0.05 |
0.20 |
237 |
0.81 |
220 |
0.75 |
0.82 |
0.07 |
0.05 |
0.05 |
0.19 |
176 |
0.80 |
167 |
0.75 |
0.83 |
0.08 |
0.05 |
0.05 |
0.20 |
135 |
0.81 |
130 |
0.75 |
0.84 |
0.09 |
0.05 |
0.05 |
0.19 |
106 |
0.80 |
103 |
0.75 |
0.85 |
0.10 |
0.05 |
0.05 |
0.20 |
85 |
0.81 |
84 |
0.75 |
0.86 |
0.11 |
0.05 |
0.05 |
0.19 |
70 |
0.81 |
70 |
0.75 |
0.87 |
0.12 |
0.05 |
0.04 |
0.19 |
59 |
0.82 |
60 |
0.75 |
0.88 |
0.13 |
0.05 |
0.05 |
0.18 |
51 |
0.82 |
50 |
0.75 |
0.89 |
0.14 |
0.05 |
0.05 |
0.18 |
43 |
3. Selection Sample Size
The analytic sample size is the sample size required to meet the analytic objective of calculating the verification rate (≥75%). The selection sample size is the analytic sample size adjusted for non-contact, ineligibility, non-cooperation, and attrition. Exhibit 3 shows the adjustments to the analytic sample size, expected rates, and sample count. The selection sample size will be about 10,000. We rounded up the analytic sample size from 9,915 to 10,000 to account for any uncertainty in the expected rates for the adjustments.
Exhibit 3. Analytic Sample Size, Sample Size Adjustments, and Selection Sample Size
Sample |
Adjustment |
Rate |
Count |
Selection Sample |
|
|
9,915 |
|
Retention |
0.65 |
6,445 |
|
Cooperation |
0.70 |
4,512 |
|
Eligibility |
0.95 |
4,286 |
Analytic Sample |
Contact |
0.70 |
3,000 |
1 Hintze, Jerry L. (2011). PASS 2011. Utah: Kaysville.
| File Type | application/msword |
| Author | dcreel |
| Last Modified By | OS Reviewer |
| File Modified | 2012-11-01 |
| File Created | 2012-10-31 |
© 2026 OMB.report | Privacy Policy