Grid Sample Selection Synopsis
0248 - Grid Sample Selection Synopsis.docx
Generic Clearance of Survey Improvement Projects
Grid Sample Selection Synopsis
OMB: 0535-0248
2014 GIRAFFE Grid Segment Selection Process Description
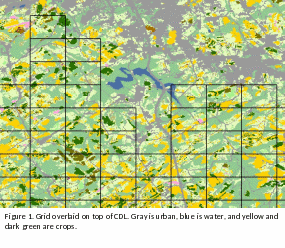
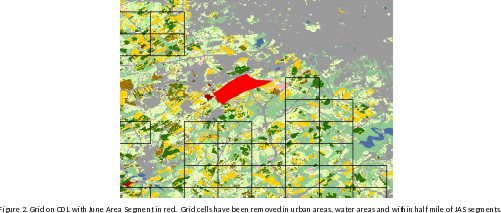
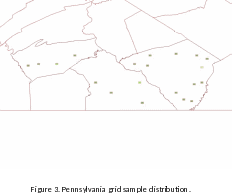
The procedure followed in determining the grid segments used in the 2014 GIRAFFE testing basically removed grid cells we were confident we did not want to select. NASS will only include the grid cells for counties for each state identified as suitable for using in this test as determined by the respective field offices. Using NASS’s Cropland Data Layer (CDL), a raster data set that uses remote sensing techniques to classify land cover, we calculated percent urban area, percent water area and percent cropland (see Figure 1). Using these calculations NASS removed grid cells that had a percent urban value greater than 15 percent. Then we removed grid cells with a percent water value greater than 15 percent. I removed grid cells that were within half a mile of our current June Area segments to hopefully minimize the chance of visiting a farmer twice this summer (see Figure 2). The remaining grid cells were each assigned a unique Cell ID value in order to identify each cell. Using the percent crop values, we assigned a stratum value to each grid cell based on our stratum definitions for each state. Grid cells were then selected for each state using the following allocations by strata (see Figure 3). It was not a random selection, but rather determined in an effort to have a spatial distribution and an attempt to use grid cells that would yield meaningful results within the context of the test.
PA 17 - Stratum 13 2 - Stratum 20 1 - Stratum 40
|
NC 17 - Stratum 13 2- Stratum 20 1 - Stratum 40
|
SD 12 - Stratum 11 5 - Stratum 12 2 - Stratum 20 1 - Stratum 40 |
11 General Cropland, greater than 75% cultivated
12 General Cropland, 51-75% cultivated.
13 General Cropland, greater than 50% cultivated
20 General Cropland, 15-50% cultivated
40 Less than 15% cultivated (e.g. rangeland/forest)


| File Type | application/vnd.openxmlformats-officedocument.wordprocessingml.document |
| Author | Rick Hardin |
| File Modified | 0000-00-00 |
| File Created | 2021-01-29 |
© 2026 OMB.report | Privacy Policy