Appendix Pilot concept mapping summary report
AppendixGPilotConceptMapReport.doc
Teen Dating Relationships Opportunities for Youth to Define What's Healthy and Unhealthy (Pilot study)
Appendix Pilot concept mapping summary report
OMB: 1121-0333
.

.
.
.
.
.
.
.
.

understanding abuse in teen dating relationships through concept mapping
pilot Concept mapping Summary Report
JULY 2012
Prepared for
national institute of justice (NIJ) – Office of justice programs (OJP)
by
concept systems, incorporated
understanding abuse in teen dating relationships through concept mapping
pilot concept mapping summary report
Table of Contents
Project Design and methodology 6
interpretation and Next Steps 17
Appendix II: Facilitated Discussion Guiding Questions……………………………………………………………………...25
Appendix III: References……………………………………………………………………………………………………………………26
Table of Figures
Figure 2. Point Cluster Map 11
Figure 3. Labled Concept Map 12
Figure 4. Frequency vs. Desirability Pattern Match: All Participants. 13
Figure 5. Frequency Pattern Match: Ages 14, 15, 16 vs. Ages 17, 18. 14
Figure 6. Frequency Pattern Match: Males vs. Females. 15
Figure 7. Frequency Pattern Match: Dating Experience- A lot vs. None………………...…………………..……..16
Figure 8. Concept Map: A Dimensional Perspective……………………..…………………………………………………..18
understanding abuse in teen dating relationships through concept mapping
Project summary report
executive Summary
The prevalence of adolescent dating violence has surfaced as a significant issue with implications for the criminal justice, public health and education fields. Much of the prior research used to inform teen dating violence prevention and intervention efforts applies adult frameworks and assumptions to characterizing relationships, however “further research is needed to test these assumptions” and to determine their validity in being applied to adolescents (Murphy and & Smith, 2010). Whereas existing research provides some evidence of conceptual disparities between adult and teen populations on relationship related topics, previous studies indicate that teens may perceive certain emotions and behaviors differently than do adults and researchers (Levy, 1990, O’Keefe, 2005, Galliher, Enno, & Wright, 2008). This field of research, therefore, lacks adequate consideration of the adolescent perspective, and signals the need to further identify the developmental, social, and environmental components of their interactions, and mechanisms of influence that are specific to teen dating violence.
The present study, with funding from the Department of Health and Human Services (HHS) and the Department of Justice (DOJ), intends to use concept mapping to more fully explicate the commonalities and disparities among the ways in which adolescents ages 11-21 and adults conceptualize characteristics associated with teen dating relationships. It is anticipated that concept mapping will allow project planners to compare the relationship characteristics of adolescents’ conceptualizations of relationship characteristics with those of practitioners, researchers, teachers and parents. Furthermore, concept mapping will reveal commonalities and disparities among those characteristics of dating relationships viewed as frequent and desirable, and will also allow for comparison of these opinions among various subgroups (e.g. racial/ethnic groups, gender, geographic areas, dating experience). It is expected that the results of this study will be used to determine how prevention and intervention efforts can most effectively target relationship characteristics related to abusive behavior, particularly in better informing the language and content of such interventions and responses. The findings may also be used to educate youth about dangerous behaviors that they may not consider negative or abusive, and will also inform the development of new initiatives and projects or revisions of existing projects.
In September 2011, the Office of Management and Budget (OMB) requested that the project Planning Group conduct a formal pilot with a sample of 50 adolescents, ages 14-18, in New York and Washington, DC in advance of executing the full study with the proposed larger sample (150 adults, 250 adolescents ages 11-21). The purpose of this pilot was to test the ability of the concept mapping methodology to sufficiently capture the conceptualizations of adolescents. As such, the project Planning Group worked closely with Concept Systems, Inc. (CSI) to engage a small group of teens in an inclusive, iterative process of developing and refining a preliminary conceptual framework. This preliminary framework allowed the Planning Group to verify the utility of concept mapping as an appropriate process for better understanding how teens understand dating relationships. Successive recruitment planning efforts in light of this pilot will enable the Planning Group to more efficiently execute this study with a broader, more diverse population that includes both youth and adults. This report summarizes the process by which the pilot study participants identified a comprehensive scope of concepts that collectively constitute aspects of teen dating relationships, as well as the interpretation and implications of the results.
Project Design and methodology
The purpose of this pilot study was to gather, aggregate, integrate and analyze the specific knowledge and opinions of a relatively small sample of 50 teens on the topic of teen dating, as a means of confirming the use of concept mapping as an appropriate methodology to better understand how youth conceptualize characteristics associated with dating relationships. The desired outcomes of this effort were to lay the groundwork for the use of the study recruitment processes and concept mapping methodology in a larger, more comprehensive study to more fully understand and compare how both youth and adults conceptualize healthy and unhealthy aspects of teen dating relationships, in a way that may used to better inform national teen dating violence prevention and intervention initiatives.
In order to accomplish these desired results, members of the project Planning Group used The Concept System® planning and facilitation methodology. Concept Mapping is a mixed methods planning and evaluation approach that integrates familiar qualitative group processes (brainstorming, categorizing, and assigning value ratings to a set of statements) with multivariate statistical analyses to help a group describe its ideas on any topic of interest and to represent these ideas visually through a series of related maps.
This Concept Mapping approach had several key advantages for this inquiry:
It elicited the ideas of diverse youth in unique ways to understand thoughts, actions, feelings and behaviors that teens might have or do in dating relationships.
It produced clear visual representations of how the group of teens as a whole conceptualizes the characteristics associated with teen dating and their relations to one another.
It assured a well-informed, group-oriented process.
The Concept Mapping process typically requires the participants to brainstorm a set of statements relevant to the topic of interest, individually sort these statements into piles of similar content or themes, rate each statement on one or more dimensions, and generate a series of quantitative maps which reveal a topology of thought resulting from the analysis of this data. Participants and project planners can then use these maps as a basis for further discussion and a framework for conclusions and action planning. The entire process is driven by the stakeholders themselves, ranging from initial brainstorming, to the eventual identification and naming of clusters, to interpretation and analysis of the maps.
This report summarizes what the Planning Group, through a group of teen participants in the New York and DC areas, identified as specific issues and characteristics relevant to teen dating relationships. With assistance from CSI consultants, the contributions of the stakeholder-participants in the pilot component of this project led to the results presented here. These results will be used as a basis for refining ongoing research planning for using the concept mapping methodology with a broader sample of teens and adults.
The following steps were taken to achieve the goals of this study1:
Establishing the FOCUS
To facilitate the collection of meaningful input, members of the Planning Group and Advisory Group, with guidance from Concept Systems, Inc., developed a focus prompt to which teens ages 14-18 responded:
“A thought, action, feeling or behavior that teens in dating relationships might have or do is…”
Identify the Participants
The participant identification guidelines for this pilot study, per OMB, called for a target of 50 participants ages 14-18, half of which reside in the Washington, DC metro area and the other half of which reside in New York. In order to protect the anonymity of participants, per the study’s IRB approval requirements, participants were recruited through youth-serving organizations in the DC and New York area. Instructions for all concept mapping activities, including parental consent and website log-in information, was delivered from CSI to participants via organizational representatives, so that project managers and planners were never made aware of participant identity. Youth-serving organizations were identified and invited to recruit teen participants through Planning and Advisory member contacts.
Idea Generation
During the period of December 5, 2011 through February 20, 2012, youth ages 14-18 were asked to provide input on thoughts, actions, feelings or behaviors that teens in dating relationships might have or do using the above prompt as the focus for the structured responses. Teens were given instructions from their respective organizational representative for accessing a project-specific website on which participants could submit their ideas online2 after submitting a signed parental permission form (ages 14-17) or consent for (18+). For the online brainstorming activity, teens were recruited through Cornell Cooperative Extension’s Teen Advisory Group and CITY Project (New York City), as well as the Men Can Stop Rape organization in Washington, DC.
Idea Synthesis
In response to the focus prompt during the brainstorming phase, a total of 116 statements were generated by teen participants. At a meeting on February 27, 2012, the Planning Group used the following criteria in reviewing these preliminary statements, in conjunction with those produced during an initial pilot in November 2010, to produce a final set of 86 statements:
Relevance to the stated focus question or within the scope of the question at hand;
Redundancy or duplication;
Clarity of meaning; and,
Relative appropriateness for the sorting and rating tasks to be completed.
Appendix I includes the final list of 86 ideas that resulted from this process.
Structuring the Ideas
Following the completion of the idea generation or brainstorming phase, participants were contacted and asked to participate in tasks to sort and rate the final set of ideas. For the online sorting and rating activities, participants were recruited through Cornell Cooperative Extension’s Teen Advisory Group (New York City), the Ithaca Youth Council (Ithaca, NY) and the Bishop O’Connell High School (Arlington, VA). In addition to the web-based participation, CSI facilitated two in-person sorting and rating sessions with the teens through the Ithaca Youth Council on April 26, 2012 and the Windsor United Methodist Church (Windsor, NY) on April 29, 2012, as a means of eliciting additional participation through more captive, in-person audiences.
Sorting. In the sorting task, individuals are asked to organize or sort the entire final database of 86 ideas into groups or themes based on their perceived similarity of the ideas. Teens recruited through the aforementioned youth-serving organizations were asked to complete this task, as well as the subsequent rating task described below, between March 6, 2012 and April 30, 2012. Concept Systems, Inc.Error: Reference source not found provided consulting assistance and facilitation to this process, and again provided a dedicated website for those participants to complete the task online. The subset of participants that was asked to complete this activity in-person used paper sort cards and a sort recording form to note their piles and pile labels.
Rating. For the rating task, teens recruited through the identified youth-serving organizations were asked to rate each of the final 86 ideas on two four-point scales. Participants were asked to rate along two dimensions: Frequency (how common each idea is in teen dating relationships) and Desirability (the extent to which one would want or desire each idea in a teen dating relationship). Stakeholders completed this task by using the dedicated website, or by filling out a paper ratings form that was distributed during the in-person facilitation meetings.
Computing the Maps
The Concept System® 3 uses multi-dimensional scaling and hierarchical cluster analysis to integrate the sorting information from each individual, convert that qualitative information to quantitative data, and develop a series of easily readable concept maps and reports. These maps show the perspective of the entire group of participants as well as sub groups. In effect, The Concept System® results represent the unique perspectives of a diverse group of individuals, preserve the best thinking of each individual and integrate the individual detail to construct and produce a coherent picture of the entire group.
The analysis uses the sort information to construct an NxN binary matrix of similarities, using the sorting results from all sorting activity participants. The total similarity matrix was analyzed using non-metric multi-dimensional scaling (MDS) analysis with a two-dimensional solution. The two-dimensional solution yields a configuration in which statements grouped together most often are located closer to one another in two-dimensional space than those grouped together less frequently. The x, y configuration resulting from the MDS analysis was the input for the hierarchical cluster analysis. To determine the best fitting cluster solution the analysts examined a range of possible cluster solutions suggested by the analysis, and took into account the fit of the contents within clusters as well as the specific desired uses of the results.
Map Interpretation
The maps and reports produced by The Concept System® reflect and summarize the work of the stakeholders during the idea generation and structuring (sorting and rating) phases. The next step in the process required interpretation and discussion by the stakeholders in this project, including both youth and the Planning Group. Four tasks were undertaken in this step:
First, the resulting preliminary data was reviewed with the Planning Group on May 7, 2012. This review involved a preliminary discussion of the meaning, relevance and implications of the results.
Second, the presentation was revised with suggested cluster labels from the Planning Group.
Third, the concept map results were shared with teens ages 14-18 through two facilitated discussions. The first facilitated discussion was conducted with 8 teens (7 male, 1 female) recruited through the Men Can Stop Rape organization in Washington, DC on June 11, 2012. The second discussion was conducted with 15 teens (1 male, 14 female) recruited through the Cornell Cooperative Extension Teen Advisory Group in New York City on June 21, 2012. At the meetings, participants
reviewed the cluster map and the statements in each cluster,
discussed the cluster labels and provided suggestions for more appropriate or articulate labels based on the content of each cluster,
discussed the broader themes suggested by the data, including the dimensions of the map,
discussed specific ideas or themes that were felt to be missing from the map,
discussed specific ideas or themes that were surprising to be part of the map,
considered how adults (parents, teachers, community leaders, etc.) might perceive, understand or react to elements of the map,
and considered how the information conveyed in the map might be used to develop programming related to healthy teen dating relationships.
Fourth, the cluster labels were further revised with feedback elicited from the facilitated discussion participants, and the pilot study results were reviewed with the project Advisory Group via webinar on July 10, 2012.
A more detailed description of the feedback and next steps suggested by the Planning Group, Advisory Group and facilitated discussion participants can be found in the “Interpretation and Next Steps” section near the end of this report. Before summarizing these meetings, we review the concept mapping results in greater detail.
results
Concept Mapping combines group process (whether literal or virtual) with computer technology that uses multivariate statistical techniques to develop maps that show what a group of identified stakeholders thinks and values in relation to a specific topic of interest or need. A single Concept Mapping project produces a number of interrelated maps, which we can consider to be different views of the same structure. In this case, the participant group was comprised of teens ages 14-18 recruited through youth-serving organizations in New York and the DC area, that were recommended by Planning and Advisory Group members. Youth participants were asked to provide structured input on specific thoughts, actions, feelings or behaviors that teens in dating relationships might have or do. Forty participants completed the conceptual sorting of ideas for analysis (23 online, 17 in-person), which is above the average threshold for producing reliable results in concept mapping4. Fifty-two participants contributed their input on the Frequency rating (31 online, 21 in-person), and forty-seven participants contributed their input on the Desirability rating (28 online, 19 in-person).
Concept mapping results
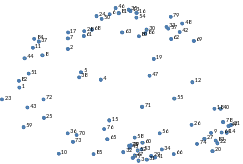
Concept Maps were generated showing the relationships for the 86 distinct ideas generated as part of the brainstorming process. The point map below shows each of the brainstormed ideas as a point on the screen, and provides a meaningful arrangement of the content. Ideas that appear closer together were sorted more frequently by participants into the same group. This map illustrates 86 points, each representing one of the distinct ideas brainstormed by the stakeholders from the original raw list of 116 statements.
Figure 1. Point Map, indicating the array of all statements and their relationship to each other.
As a result of hierarchical cluster analyses, a cluster point map illustrates how the individual content ideas are related via higher level concepts. The cluster map view shows the categories that emerged based on sorting data from contributors. In this case, the optimal solution was a nine-cluster solution, as indicated in Figure 2 below.
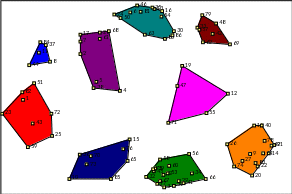
Figure 2. Point Cluster Map, showing the 86 statements grouped within nine clusters.
The data suggests that nine major themes can be considered as a meaningful framework when considering how teens conceptualize thoughts, actions, feelings and behaviors related to teen dating relationships. The Labeled Cluster Map shows the clusters labeled with these categorical issues. The name given to each cluster reflects the theme or topic expressed in the statements within that cluster. The following are those categories, as they are represented in a counter-clockwise review of the map:
Unpleasant Feelings
Hurtful or Abusive Behaviors and Feelings
Doubt and Trust Issues
When a Relationship Takes Over Priorities
Exciting Behaviors with Potential Risks
Expression of Affection
Positive Activities and Behaviors
Positive Feelings
Naiveté
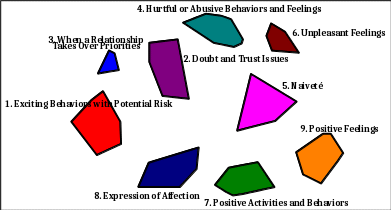
Figure 3. Labeled Concept Map. A nine-cluster concept map indicating the main topics, or concepts, that contain the 86 ideas that make up the content of the project results.
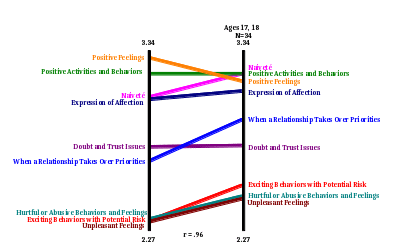
Ratings information was also requested from participants in the development of the framework, permitting additional analyses to compare these ratings. We created a Pattern Match, shown below, to compare the ratings of Frequency and Desirability from all project participants who provided ratings.
The Pattern Match below shows the correlation between the average Frequency and Desirability ratings for each cluster. Cluster averages are attained by averaging the ratings of all statements in a particular cluster. In this case, the overall correlation is .89, which indicates that participants’ perceptions of frequency are highly predictably aligned with their perceptions of desirability. The degree of slope of the lines connecting concepts on the left (Frequency) to same concept on the right (Desirability) illustrates this strong alignment.
Hurtful
or Abusive Behaviors and Feelings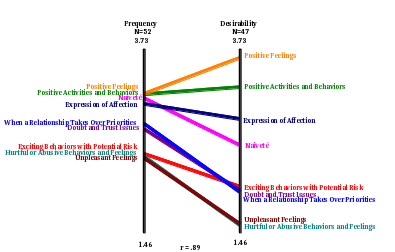
Figure 4. Frequency and Desirability Pattern Match: All Participants.
To illustrate: on the left vertical axis the location of the conceptual cluster “Positive Feelings” indicates that, on average, those who rated gave the items in that cluster ratings of higher frequency than the items in all other clusters, on average. On the Desirability vertical line, those same items that comprise “Positive Feelings” were also, on average, rated of higher desirability (3.73) than the items in all other clusters, and also rated higher than the same items were rated on frequency (3.24).
The analysis also allows for comparison on the same rating; e.g., frequency, from the perspectives of two participant subgroups. We obtained information regarding participant subgroups from responses to the demographic questions asked during the sorting and rating activities.
Figure 5. Frequency Pattern Match: Ages 14, 15, 16 vs. Ages 17, 18.
Female
N=23
Male
N=28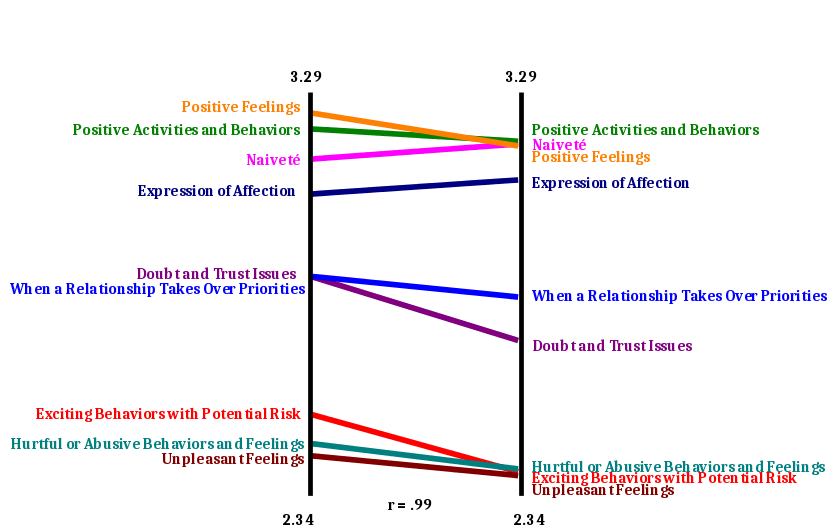
Figure 6. Frequency Pattern Match: Females vs. Males.
A
lot
N=9
None
N=8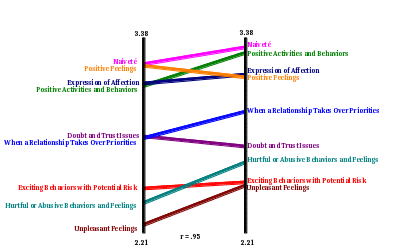
Figure 7. Frequency Pattern Match by Dating Experience: A lot vs. None.
Figures 5, 6 and 7 illustrate that raters’ perceptions of frequency were strongly aligned. Agreement on frequency between subgroups (in this case, those raters ages 14, 15, or 16 vs. those ages 17 or 18, females vs. males and those who indicated having a lot of dating experience vs. no dating experience) is particularly high, as is reflected by the near perfect correlation coefficients of .96, .99 and .95, respectively. Collectively, these subgroup comparisons suggest that participants perceive the frequency and desirability of concepts associated with teen dating relationships as highly aligned regardless of age, gender and amount of dating experience.
interpretation and Next Steps
The following interpretive steps of the project were used to build upon the developed conceptual framework in order to:
Discuss the insight derived from the concept map, as a means to better understanding how teens conceptualize dating relationships.
Confirm the validity of the framework results with stakeholders.
Refine the study recruitment process and approach as necessary to most efficiently elicit a wide range of youth and adult stakeholder opinion within the parameters of the larger study.
PRELIMINARY INTERPRETATION
The Planning Group and CSI used the Preliminary Interpretation meeting to review the results of the pilot study, including potential cluster labels and latent dimensions of the map. The final cluster labels were determined after reviewing the concept map results with teens through two facilitated discussions described below. Consideration of the map’s latent dimensions elicited insight from the Planning Group around the emergent relationships among the conceptual constructs, and how these relationships might be articulated and predicted in two-dimensional space (Figure 8).
After
reviewing the location of the ideas and their respective cluster
membership, the Planning Group suggested that the map content
described increasingly healthy, or positive, aspects of dating
relationships the farther “south” one looked along the
“north-south” dimension. Likewise, ideas described
relatively increasingly unhealthy, or negative, aspects of teen
dating the farther “north” one looked along this same
dimension. A review of the content as it appears along the
“east-west” dimension suggests that the farther “east”
one reads, the more internal to the individual the ideas are in
content. This gradation coincides with the location of most
feelings-related statements on the eastern side of the map. On the
contrary, the farther “west” one reads on the map, the
more external, or co-experienced, the ideas are in content. This
gradation coincides with the location of most behavior-related
statements on the western side of the map.
FACILITATED DISCUSSIONS
After reviewing the results of the concept map with the Planning Group, CSI facilitated two discussions with teens to confirm and enhance, to the extent possible, the results of the inquiry process. Discussions were conducted with teens ages 14-18 from Men Can Stop Rape in Washington, DC and the Cornell Cooperative Extension Teen Advisory Group in New York City. In addition to furthering the interpretation of the map from the perspective of stakeholders, these discussions also helped garner a better understanding of the teens’ knowledge and opinions of dating relationships and aided in revision of cluster labels using terminology that resonates with the adolescent population.
The facilitated discussions were conducted in three parts. First, CSI provided participants with an overview of the concept mapping process, including the brainstorming, sorting and rating activities, as well as an orientation to the resultant point and cluster maps. Next, the group reviewed the statements within each cluster, and was asked to suggest labels to describe the contents of each cluster. CSI also orientated participants to the pattern match as a means of eliciting their impressions of the ratings results. Finally, CSI asked participants to comment on a series of semi-structured questions (Appendix II).
Unhealthy
Internal/Private
External/Public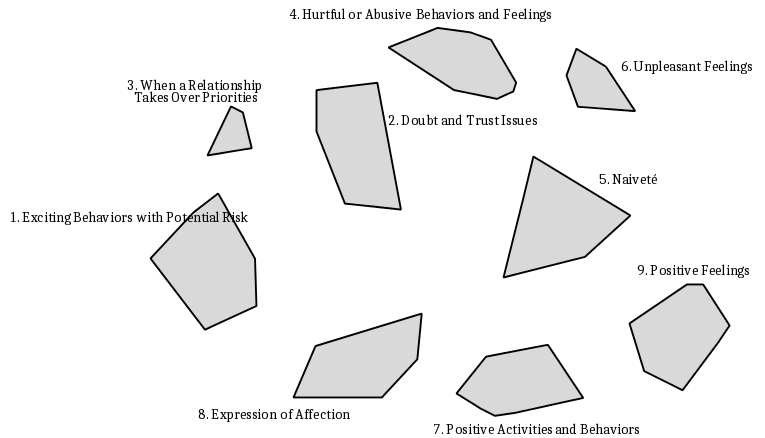

Healthy
Figure 8. Concept Map: A Dimensional Perspective
The discussion group in Washington, DC was largely comprised of males, and the group in New York City largely of females. Overall, despite gender differences, attendees in both groups confirmed that the map was a valid representation of the characteristics and scope of thoughts, actions, feelings and behaviors in teen dating relationships. Some participants in both discussions felt that the map lacked sufficient representation of technology and sex related content, more specifically around texting, “sexting” and Facebook related activities and behaviors. Feedback regarding cluster labels was strongly aligned among both groups, and the reconciliation of these suggestions is reflected in the labeled cluster map featured in this report (Figure 3) and in all further presentations of the pilot study map.
When asked to describe any references they use when thinking and/or talking about dating relationships, participants in both groups recognized specific television shows and celebrity relationships as examples of more extreme, problematic relationships. Family (parents) and teachers were recognized more frequently as relationship role models. Those participants from the Teen Advisory Group, who had also partaken in the brainstorming, sorting and rating activities, noted that they drew heavily from their own dating experiences when deciding how to respond to the concept mapping tasks.
When asked to provide their thoughts on how adults might receive this concept map, youth commented on perceived generational differences in dating behaviors. For example, the prevalence and importance of technology in teen dating relationships today- both in finding and communicating with a partner- was thought by teens to be almost non-existent in teen relationships of previous generations.
Teens were also asked for suggestions on how to best articulate the “north-south” and “east-west” dimensions of the map. Participants noted that the northern region of the map included relatively more “dangerous” or “negative” experiences, whereas the southern region represented “comfortable” or “ideal” experiences. Teens described content in the eastern region of the map as “internal,” and related to “inner feelings,” whereas the western region was more “public” or “things other people can see you do.” Based on these descriptions of the content location, we can conclude that teens’ understanding of the map’s latent dimensions comports well with that of the Planning Group.
Although the teens agreed that the dimensions were useful in further categorizing the relationships among concepts, many participants commented that the degree to which an idea on the map was considered healthy or desirable in certain relationships depended on the details of the particular dating situation; these participants also noted that this especially applied to the ideas located toward the center of the map. Teens noted, for example, how a statement like “public display of affection (PDA)” could be considered highly desirable in some situations, but less ideal or healthy in relationship in which PDA is a mechanism for someone to exert control over their partner. In this regard, the teens recognized a level of uncertainty in drawing conclusions about statements without information about the context in which it is considered.
In addition to the dimensions, teens in both groups offered a temporal description of the relationship among clusters. Clusters in the south-eastern region of the map (Positive Feelings, Positive Activities and Behaviors) were used to reference characteristics of the beginning of a relationship. Those clusters in the northern region (Hurtful or Abuse Behaviors and Feelings, Unpleasant Feelings, Doubt or Trust Issues, When a Relationship Takes Over Priorities) were reflective of the end of a relationship, or of indicators that a relationship should end. Also of note was the tendency for many teens to use temporal pile labels when completing the sorting activity. This trend, in conjunction with the temporal perspective articulated in both facilitated discussions, suggests that time may be an important factor in adolescents’ conceptualization of dating relationships.
ADVISORY GROUP WEBINAR
Finally, the findings were presented and reviewed with the project Advisory Group that is comprised of practitioners and researchers in the field. Several Advisory Group members commented on how strongly the concept mapping results resonated with their own research and practice experiences. In particular, the location of certain ideas such as “play fighting” on the map speaks to the conceptual ambiguity that teens experience when trying to determine whether certain thoughts, actions, feelings or behaviors are healthy or unhealthy, desirable or undesirable. Advisory Group members commented that adolescents can often struggle in trying to make sense of features of dating relationships. Further, this noted ambiguity resonates with teens’ recognition during the facilitated discussions of the contextual dependence of perceived healthiness in many aspects of teen relationships.
Advisory Group members remarked that the broader recruitment targets for the larger study (250 youth, ages 11-21; 150 adults) may also allow for the concept mapping methodology to discern greater differences of opinion in subgroup ratings comparisons. Although the design of the larger study is not intended to recruit a nationally representative sample to produce generalizable results, efforts will be made to involve geographically and racially diverse youth to the extent possible within the project parameters. Greater demographic variability among participants may reveal areas of weaker correlation in ratings of frequency and desirability, which can in turn lead to areas for future inquiry. It is anticipated that as a whole, the larger study will lead to the development of additional research questions that future studies may investigate with a more purposefully representative sample.
Conclusions and Recommendations
The concept mapping project described in this report provides a summary of a range of thoughts, actions, feelings and behaviors that adolescents associate with teen dating relationships. The emergent framework provides a well-grounded basis for better understanding how teens conceptualize the relationships among these ideas in a way that can be applied to the larger study and, subsequently, to better inform teen dating violence prevention and intervention initiatives.
The use of concept mapping as an appropriate methodology for answering the project research question is evident in two main regards. First, the production of a robust framework is in itself a testament to the ability of the concept mapping process to elicit the conceptualizations of the adolescent population on the topic of interest. Second, the subsequent interpretative discussions allowed the Planning Group and CSI to confirm that the breadth and depth of information and conceptual relationships contained in the map indeed resonate with teen stakeholders, as well as with current and ongoing research initiatives of Advisory Group members working in this field.
We advise, as a critical adjunct in furthering our understanding of how teens think about dating relationships, that the full study be conducted with the intended sample of 250 teens ages 11-21 and 150 adults including researchers, practitioners, teachers and parents. We anticipate that this larger concept mapping study will considerably augment the insight derived from the pilot results by:
eliciting the opinions of a more diverse sample of adolescents, allowing us to achieve greater saturation of the topic, and to better identify commonalities and variation across groups of participants,
including adult participants in the process, thereby allowing us to compare the conceptualizations and opinions of adults and teens,
and providing a rich foundation for future research inquiries in this field.
The concept mapping methodology provides an appropriate and optimal process for developing an emergent framework that emphasizes the complex, interrelated aspects of teen dating violence from multiple perspectives (particularly those from youth). This work will help to advance a unified practice, research, and policy agenda. Without such information, planning and development may be limited in terms of appropriately matching language and communications, intervention and responses, and measurement and data collection with targeted beneficiaries.
AppendiCES
Appendix I: Statement list
The following is a list of the 86 statements used in the concept mapping project for the focus prompt:
“A thought, feeling, action or behavior that teens in dating relationships might have or do is…”
# |
Statement |
1 |
liking their Facebook statuses. |
2 |
acting single. |
3 |
getting tattoos of each others names. |
4 |
posting your anniversary all over Facebook. |
5 |
play video games together. |
6 |
kissing. |
7 |
deleting messages so that your partner doesn't see them. |
8 |
checking your partner's text messages. |
9 |
having late night phone calls or texting. |
10 |
working out together. |
11 |
dancing together. |
12 |
buying stuff for each other. |
13 |
dressing up like each other, or matching outfits. |
14 |
taking pictures. |
15 |
hanging out at home. |
16 |
lying to your parents. |
17 |
touching each other. |
18 |
making single people jealous. |
19 |
cooking for one another. |
20 |
give or receive massages. |
21 |
getting food. |
22 |
making babies. |
23 |
going shopping. |
24 |
say they're "going out." |
25 |
watching television. |
26 |
having sexual intercourse. |
27 |
working out or dieting to try to look fit. |
28 |
skipping school to spend time together. |
29 |
rushing into sex. |
30 |
making mistakes. |
31 |
studying less. |
32 |
sneaking around. |
33 |
trying to please someone other than yourself. |
34 |
arguing. |
35 |
sticking up for each other. |
36 |
holding hands. |
37 |
stalking their Facebook page. |
38 |
being too needy. |
39 |
using each other. |
40 |
pressuring each other. |
41 |
bringing each other down. |
42 |
PDA (public display of affection). |
43 |
play fighting. |
44 |
cuddling. |
45 |
being abusive. |
46 |
being victimized. |
47 |
manipulation. |
48 |
caring for each other. |
49 |
cheating. |
50 |
being honest. |
51 |
sharing secrets. |
52 |
communication. |
53 |
support. |
54 |
respect. |
55 |
hitting or slapping each other. |
56 |
being polite. |
57 |
controlling. |
58 |
fighting. |
59 |
lust. |
60 |
acceptance. |
61 |
never satisfied. |
62 |
feeling lucky. |
63 |
happy. |
64 |
discomfort. |
65 |
feeling complete. |
66 |
feeling incomplete. |
67 |
hatred. |
68 |
jealousy. |
69 |
anger |
70 |
annoyance. |
71 |
infatuation |
72 |
uncertainty about what the future holds. |
73 |
scared that your partner will leave you. |
74 |
intimacy. |
75 |
trust. |
76 |
always wanting to look good for your boyfriend or girlfriend. |
77 |
friendship. |
78 |
wanting to experiment. |
79 |
having fun. |
80 |
feeling insecure. |
81 |
not knowing what love really is. |
82 |
thinking that they are in love. |
83 |
focusing on one person more than other important things in life. |
84 |
being overly dramatic. |
85 |
having to pick between your partner or your family or friends. |
86 |
finding someone to talk to or share your feelings with. |
AppendixI II: facilitated discussion guiding questions
When you look at this map, and when you think of the focus question that we asked teens like yourselves to answer, what kind of relationships come to mind? Are you thinking of your own relationships? Friends’ relationships? Dating relationships you’ve heard about from others or seen on TV? Things you see or hear through social media such as Facebook?
Is there anything about this map that surprises you?
Are there either clusters or specific ideas that appear on this map that you would not expect to see? In other words, are there clusters or ideas that you would not consider to be thoughts, actions, feelings or behaviors that teens in dating relationships might have or do?
Are there things, for example, that appear close together that you would expect to appear farther apart? And are there things that appear farther apart that you would expect to appear closer together?
Is there anything that you feel might be missing from this map?
Are there certain ideas or themes (cluster) that you would have expected to see that is not here?
Are there other issues or topics related to teen dating relationship that are not a part of this map, but which you believe are important to be discussed?
Think of adults that you know- parents, teachers, activity leaders, etc. What do you think they would think of this map?
What do you think adults might find surprising about this map?
Are there ideas or topics that are not on this map, that you think adults might expect to see?
Are there ideas or topics that are on this map that you think adults might not expect to see?
If we were to ask adults to do the activities that we asked teens to do, do you think they would have come up with different ideas? The same? Do you think they would have sorted the ideas in the same way?
Are there specific groups of adults in your community that you feel should see the information as it appears on this map? For example, do you think that there are things about teen dating relationships on this map that your teachers or parents would be particularly interested or surprised to know about? Are there other adults who you feel don’t know how teens think about dating relationships that should?
When we reviewed this map with our Planning Group (all adults), we discussed ways we could talk about areas of the map as representing even bigger picture themes. So for example, we talked about how over on this part of the map we see more negative, or unhealthy ideas…whereas as we move this way, we see more positive or healthy ideas. Do you all have any other ways of describing how the “flavor” or themes change as we move from, say, “north” to “south”?
AppendixI III: references
Galliher, R. V., Enno, A. M., & Wright, R. (2008). Convergence and divergence across multiple methods for assessing adolescent romantic relationships. Journal of Adolescence, 31, 747-769
Kane, M., & Trochim, W. (2007). Concept mapping for planning and evaluation. Thousand Oaks, CA: Sage Publications.
Levy, B. (1990). Abusive teen dating relationships: An emerging issue for the 90s. Response to the Victimization of Women and Children.) 13(1).
Murphy, K. & Smith, D. (2010). Adolescent girls’ responses to warning signs of abuse in romantic relationships. Journal of Interpersonal Violence, 25(4),626-647.
O’Keefe, M. (2005). Teen Dating Violence: A Review of Risk Factors and Prevention Efforts. VAWnet: The National Online Resource Center on Violence Against Women (www.vawnet.org: Applied Research Forum).
For further information on concept mapping, please contact:
Concept Systems Inc.
136 E. State St.
Ithaca, NY 14850
Telephone: 607.272.1206
Toll-free: 800.260.1602
Fax: 607.272.1215
Email: [email protected]
1 The methodology is described in detail in Kane and Trochim: Concept Mapping for Planning and Evaluation. 2007: Sage Publications, Thousand Oaks, CA.
2 The Concept System® computer software (Concept Systems, 2009) was used to perform all analyses and produce all of the maps and statistical results. Data was also collected over the World Wide Web using the Concept System Global© software, to allow for participation from any location with access to the World Wide Web. Detailed references and articles on the Concept System can be obtained by calling 607-272-1206 or by emailing [email protected].
3 The Concept System® and Concept System Global© software are licensed through Concept Systems Incorporated, Ithaca, New York (http://www.conceptsystems.com).
4 Rosas, SR, & Kane, M. Quality and Rigor of the Concept Mapping Methodology: A Pooled Study Analysis, submitted for publication.
| File Type | application/msword |
| File Title | CONCEPT SYSTEMS INC |
| Author | Concept Systems |
| Last Modified By | Alyssa Goldman |
| File Modified | 2012-07-26 |
| File Created | 2012-07-19 |
© 2026 OMB.report | Privacy Policy
