NRBS Cycle 1 Non-Response Analysis 03-28-2014
NRBS Cycle1 Non-Response Analysis_032814.docx
The National Recreational Boating Survey
NRBS Cycle 1 Non-Response Analysis 03-28-2014
OMB: 1625-0089


|
National
Recreational Boating Survey
Cycle
1 Non-Response Analysis
March
28, 2014
Submitted
to: Dr.
Philippe Gwet, Mathematical Statistician United
States Coast Guard Boating
Safety Division CG-BSX-21 2703
Martin Luther King Jr. Ave, SE Washington,
DC 20593-7501
Submitted
by: ICF
Macro, Inc. 126
College Street Burlington,
VT 05401



Table of Contents
List of Figures
Figure 1. Response Rates by Selected Boat Type for 2011 Boat Survey, Mail Sample 2
Figure 2. Response Rates by Region for 2011 Boat Survey, Mail Sample 3
Figure 3. Response Rates by Region for 2011 Boat Survey, RDD Sample, by Call Type 4
Figure 4. Proportion of Completed Boat Survey RDD Interviews Achieved by Number of Call Attempts 5
Figure 5. Mean of Selected Boat Survey Items for Early and Late Responders 6
Figure 6. Owner’s Experience in Boat Operation by Panel Recruitment Status 8
Figure 7. Panel Recruitment Rate by Census Region 9
Figure 8. Distribution of Boats by Type in Population and by Panel Recruitment Status 10
Figure 9. Owner’s Experience in Boat Operation by Panel Participation Status 10
Figure 10. Panel Participation Rate by Census Region 11
Figure 11. Distribution of Boats by Type in Population and by Panel Participation Status 12
Figure 12. Response Rates by Region for 2011 Boat Survey, RDD Sample (LL + CP) 13
Figure 14. Mean of Selected Participation Survey Items for Early and Late Responders 15
Background
In 2011–2012, ICF Macro (hereafter, ICF) conducted the 2011 National Recreational Boating Survey (NRBS) on behalf of the U.S. Coast Guard (USCG), to provide data to support the 2012-2016 strategic plan of the National Recreational Boating Safety (RBS) Program. The National RBS Program’s primary goals are to reduce fatalities to specified levels for each upcoming year and to decrease personal injury, property damage, while cooperating with environmental and national security efforts as related to recreational boating. Data collected for the National RBS Program enables the USCG to better identify safety priorities, coordinate and focus research efforts, and encourage consistency in the information that is collected as well as the applied analysis methods that are used.
The NRBS design was driven by a desire to achieve comprehensive population coverage and high quality measurement of a variety of boat features and boating activities. Consequently, the NRBS was designed as a system of three surveys—the Boat Survey, the Trip Survey, and the Participation Survey—to comprehensively measure boats and boaters in the United States.
Any information collection from the general public and conducted or sponsored by a Federal agency requires periodic Office of Management and Budget (OMB) clearance. This report provides ICF’s analysis of non-response for each of the three aforementioned surveys.
2011 Boat Survey
The 2011 Boat Survey measured the incidence of recreational boat ownership and information about these boats. The survey consisted of two modes: A listed mail sample, drawn from state boater registration databases, and a dual-frame (landline and cell phone) RDD component.
Mail Sample
The mail sample was prepared for analysis by first assigning a standard AAPOR disposition to each record based on the last recorded mail event. The following analyses compare respondents who returned completed interviews (I) to eligible non-respondents (E). For simplicity, the small number of records of unknown eligibility (U) was excluded from these analyses, in addition to the ineligible (X) records.
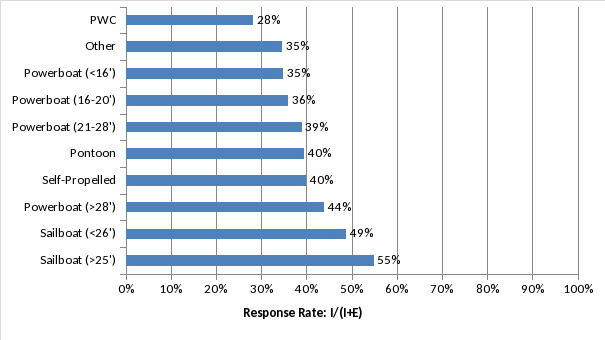
The first analysis examined whether
variation in the rate of response was related to the type of boat
selected for profiling during the Boat Survey. As shown in Figure 1,
the rate of response to the mail survey was significantly associated
with the type of boat selected for profiling,
 .
This variation appears to be driven primarily by higher response
rates from sailboats and long (>28’) powerboats, and by
lower response rates from PWCs.
Figure 1. Response Rates by Selected Boat Type for 2011 Boat Survey, Mail Sample
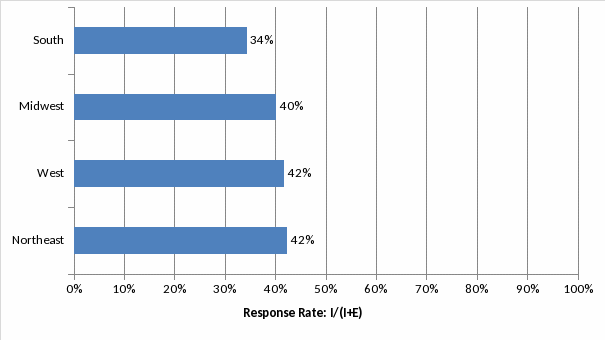
As shown in Figure 2,
significant variation in response rates was also observed across the
four US Census regions,
 .
In this case, the variation is driven primarily by lower response
rates in the South region.
Figure 2. Response Rates by Region for 2011 Boat Survey, Mail Sample
These analyses suggest that the probability of response to the mail survey may be associated with characteristics that are relevant to survey estimates (i.e., boat types). The potential for this variation to bias survey estimates, however, is minimized by several features of the survey design. First, rare boat types, which were defined to include PWCs, were oversampled to increase their representation. Second, responses were weighted by boat type to known or estimated population totals for registered and unregistered boats. Because this weighting adjustment was computed separately within each state, it also corrected for variation in non-response across geographic regions. Nevertheless, the observed variation in response rates by boat type suggests that future efforts to survey this population should continue to oversample rare boat types, particularly those such as PWCs that are less likely to generate a response.
RDD Sample
The RDD sample was prepared for analysis by first assigning a standard AAPOR disposition to each record. Complete interviews (I) include completed interviews with boat owners as well as completed interviews with non-boat owners who completed the boating participation module. The following analyses compare respondents (I) to eligible non-respondents (E). For simplicity, the records of unknown eligibility (U) were excluded from these analyses, in addition to the ineligible (X) records.
Compared to the mail sample, the
RDD sample provides less auxiliary information because the frame is
constructed from phone number databases; hence, there is no way to
classify non-respondents by boat type. As with the mail sample,
however, response rates can be compared by geographic region based
on the state associated with each phone number on the frame. This
comparison can be made separately for both landline and cell phone
records (with the caveat that the geographic accuracy of cell phone
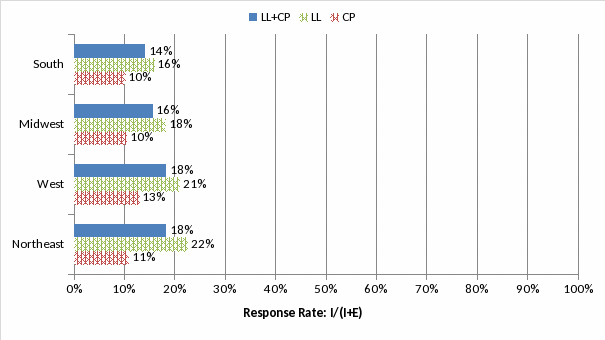
records is known to be lower). As shown in Error! Reference source not found.,
response rates for the full RDD sample (landline and cell phone
combined; blue bars) varied significantly by region,
 ,
with the Northeast and West regions being higher than the Midwest
and South. The same, statistically significant pattern was observed
in both landline (green bars) and cell phone (red bars) sample
separately.
Figure 3. Response Rates by Region for 2011 Boat Survey, RDD Sample, by Call Type
Response rates in the RDD landline
sample can also be compared based on the geographic stratification
of ZIP codes according to the per-capita density of boat owners.
Specifically, within each state, landline sample was divided into a
high- or low-density boat owner stratum based on the ZIP code
associated with the phone number. Data on boat owner density was
received from Info-Link, the same list vendor that provided access
to state boater registry databases. Info-Link used these databases
to compute the rate of boat owners per capita in each ZIP code, and
these rates were used to define density strata. Response rates in
high-density strata were significantly higher (19%) compared to
low-density strata (16%),
 .
.
An alternative approach to non-response analysis in RDD surveys is to compare responses based on the point in the dialing protocol at which a completed interview was achieved. Although this type of analysis does not technically compare responders to non-responders, it can approximate such a comparison to the extent that late responders are similar to non-responders.
The cumulative distribution of call attempts required to achieve a completed interview for all records on the survey dataset is shown in Figure 4. For the purposes of the current analysis, respondents who required 5 or fewer call attempts are classified as “early responders” and respondents who required more than 5 attempts are classified as “late responders.” This results in 80% of survey responses being categorized as early and 20% of survey responses being categorized as late.
Figure 4. Proportion of Completed Boat Survey RDD Interviews Achieved by Number of Call Attempts
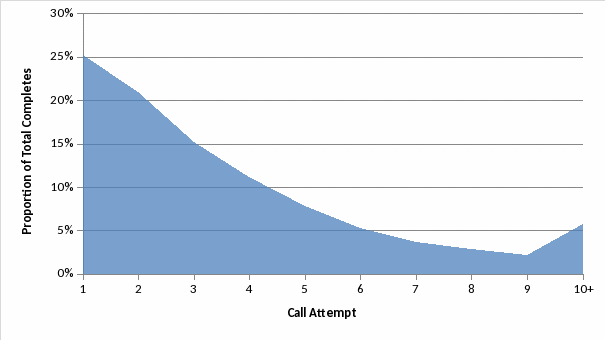
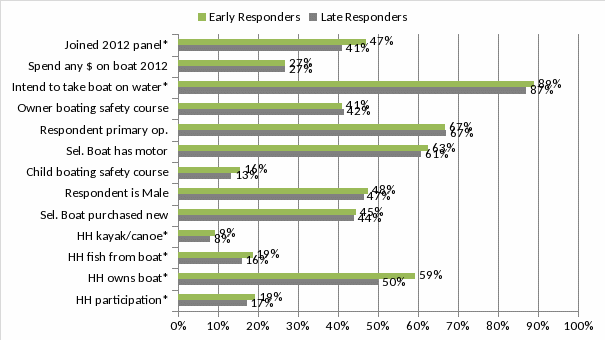
Figure 5 compares the proportions for selected dichotomous survey items between early and late responders. Significant differences are marked with an asterisk at the end of the survey item label (y-axis).
Compared to late responders, early responders were significantly more likely to report:
Household participation in recreational boating
Household participation in fishing from a boat
Household participation in canoeing or kayaking
An intention to take the selected boat on the water
And to agree to join the 2012 Trip Survey panel
Though of small magnitude, these differences generally suggest that late responders are somewhat less engaged with boating, implying a significant but small risk of non-response bias to the extent that the opinions of boat owners less engaged with boating may be underrepresented.
Figure 5. Mean of Selected Boat Survey Items for Early and Late Responders
Two continuous demographic measures
were also compared between early and late responders. Late
responders had significantly fewer people living in their households
(M = 2.62, SD = 1.45) compared to early responders (M
= 2.71, SD = 1.47),
 .
In addition, late responders were significantly older (M =
52.81, SD = 18.15) compared to early responders (M =
51.71, SD = 15.98),
 .
.
Conclusions
The regional variation in RDD response rates mirrors that observed for the mail sample (Figure 2), with the lowest rates in the South region. Response rates were also higher within high-density boat owner strata for the landline sample, raising the possibility that the survey may over-represent boaters who find the survey more personally relevant, to the extent that interest in boating is geographically clustered. With regard to bias due to regional variation in response rates, the risk of bias is small due to responses being weighted by boat type to known or estimated population totals within each state. Likewise, the risk of bias due to higher response rates from high-density strata is mitigated by weighting responses by density strata within each state. Although the response rate in high-density strata was only 3 points higher than in low-density strata, this difference suggests that future efforts to target boat owners and boating participants in this way must take care to ensure that respondents from low-density strata—which may have different boating cultures—are not systematically underrepresented.
The analyses comparing early vs. late responders in the RDD sample further suggested that, to the extent late responders are similar to non-responders, the survey may over-represent individuals who are more strongly engaged with boating. Again, the magnitude of these differences is small, but they underscore the importance of achieving completed interviews with hard-to-reach respondents.
2012 Trip Survey
The 2012 Trip Survey measured details about specific boating trips using a panel of boat owners recruited during the 2011 Boat Survey. Over the course of 2012, panelists were sampled each month to report on trips taken in the preceding month. Thus, the panel served as the sampling frame each month (with recently-contacted panelists being withheld from selection). The survey was offered in CATI and Web modes.
There are two types of potential non-response bias to investigate in the Trip Survey:
Panel Recruitment Bias: due to boat owners who completed the Boat Survey but declined to join the Trip Survey panel
Panel Participation Bias: due to boat owners who completed the Boat Survey, agreed to join the panel, but never responded to Trip Survey requests
Panel Recruitment Bias
Because all boat owners recruited to the 2012 panel necessarily completed the 2011 Boat Survey, it is possible to compare recruited boat owners (n = 23,368) to non-recruited boat owners (n = 8,465) and their selected boats along a number of dimensions.
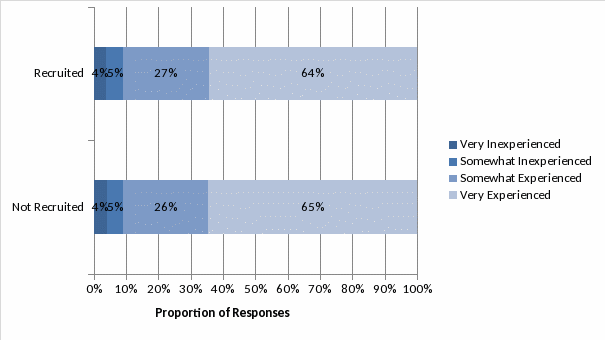
As shown in Figure 6,
there were no significant differences between recruited and
non-recruited owners in the owner’s experience in boat
operation,
 .
.
Figure 6. Owner’s Experience in Boat Operation by Panel Recruitment Status
Differences were observed, however, in other boat owner characteristics. Specifically:
A higher proportion of the boat owners recruited to the panel reported taking a boat safety course (46%) compared to non-recruited owners (43%),
 .
.A lower proportion of the boat owners recruited to the panel reported being the primary operator of the selected boat (77%) compared to non-recruited owners (81%),
 .
.
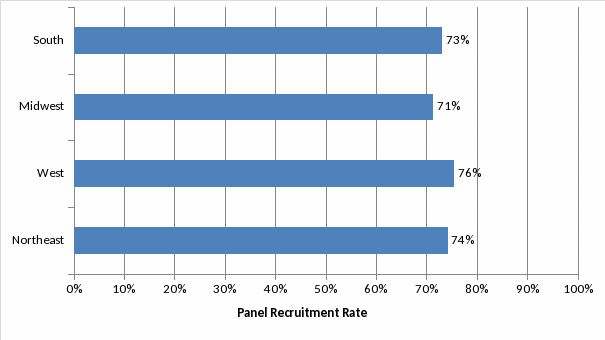
As shown in Figure 7,
recruitment rates also varied by geographic region,
 .
.
Figure 7. Panel Recruitment Rate by Census Region
Recruitment rates also differed
with regard to the characteristics of the boats selected for
inclusion in the panel. A higher proportion of boats successfully
recruited to the panel were un- or non-registered (31%) compared to
non-recruited boats (27%),
 .
The higher proportion of un- or non-registered boats in the
recruited sample is closer to the proportion of such boats in the US
population, which was estimated from 2011 Boat Survey data to be
43%. On the other hand, the average purchase price of the boat was
not significantly different between recruited boats (M =
$27,518, SD = 62,483) and non-recruited boats (M =
$25,366, SD = 56,542),
 .
.
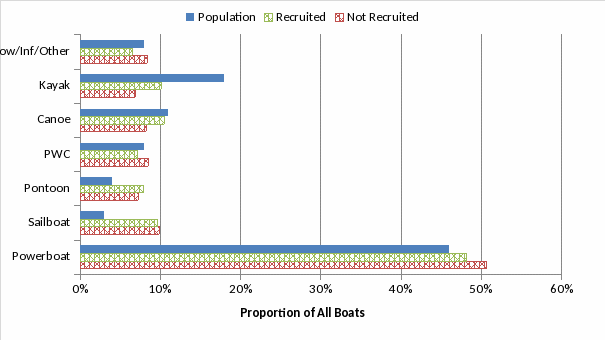
As shown in Figure 8,
the distribution of boat types also differed between recruited and
non-recruited boats,
 .
The distributions also departed from the population distribution
(estimated from 2011 Boat Survey data); in particular, it appears
that sailboats and pontoon boats were overrepresented and kayaks
were underrepresented in the recruited panel compared to the
population.
Figure 8. Distribution of Boats by Type in Population and by Panel Recruitment Status
Panel Participation Bias
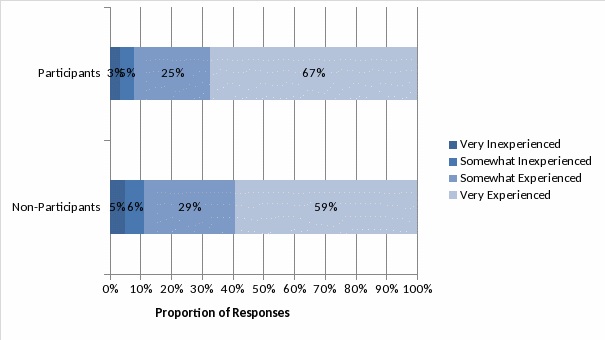
The same analyses can be used to compare, among all boat owners who were successfully recruited to the panel, those who never participated in the 2012 Trip Survey (n = 8,305) against those who participated at least once (n = 15,063).
As shown in Figure 9,
participating panelists had significantly less experience in boat
operation than non-participating panelists,
 .
.
Figure 9. Owner’s Experience in Boat Operation by Panel Participation Status
Differences were also observed in other boat owner characteristics. Specifically:
A higher proportion of the participating panelists reported taking a boat safety course (48%) compared to non-participating panelists (43%),
 .
.A higher proportion of participating panelists reported being the primary operator of the selected boat (81%) compared to non-participating panelists (71%),
 .
.
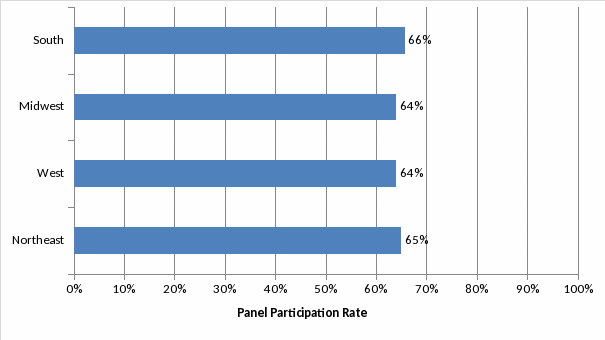
As shown in Figure 10,
the variation in panel participation rates by region was
non-significant,
 .
.
Figure 10. Panel Participation Rate by Census Region
Recruitment rates also differed
with regard to the characteristics of the boats selected for
inclusion in the panel. A lower proportion of participating panel
boats were un- or non-registered (27%) compared to non-participating
boats (37%),
 .
The average purchase price of the boat was marginally lower for
participating boats (M = $24,566, SD = 48,727)
compared to non-participating boats (M = $34,453, SD =
86,358),
 .
.
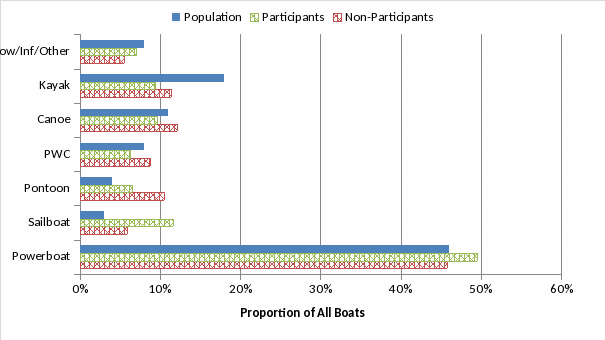
As shown in Figure 11Figure 8,
the distribution of boat types also differed between participating
and non-participating boats,
 .
The largest differences appeared to be due to relatively lower
participation by owners of pontoon boats and relatively higher
participation by owners of sailboats. The distributions also
departed somewhat from the population distribution (estimated from
2011 Boat Survey data).
Figure 11. Distribution of Boats by Type in Population and by Panel Participation Status
Conclusions
A number of differences were
observed with regard to who was successfully recruited to the Trip
Survey panel and who participated in the panel, both in terms of
characteristics of boat owners and the boats themselves. In general,
however, the magnitude of the differences in these characteristics
based on panel recruitment or participation were quite small, with
the strength of association
 generally less than .1 (on a scale from 0 to 1). Some variation in
population characteristics is to be expected due to non-recruitment
and non-participation, and the amount of variation observed here is
not especially high. Most notably, the variation in participation
rates by boat type suggests that additional effort may be helpful in
the future to ensure higher participation among owners of kayaks,
but this variation is accounted for in the 2012 Trip Survey by
weighting responses by boat type. It is also worth noting that the
lack of demographic data (e.g., sex, race, age, etc.) on panelists
precludes comparisons along these dimensions, and would therefore be
helpful to collect in the future (e.g., as part of the preceding
Boat Survey).
2013 Participation Survey
The 2013 Participation Survey measured recreational boating participation using a stratified, national RDD phone design.
The RDD sample was prepared for analysis by first assigning a standard AAPOR disposition to each record. Complete interviews (I) include completed interviews with a member of a contacted household. The following analyses compare respondents (I) to eligible non-respondents (E). For simplicity, the records of unknown eligibility (U) were excluded from these analyses, in addition to the ineligible (X) records.
RDD samples generally provide
little auxiliary information because the frame is constructed from
phone number databases. Response rates can, however, be compared by
geographic region based on the state associated with each phone
number on the frame. This comparison can be made separately for both
landline and cell phone records (with the caveat that the geographic
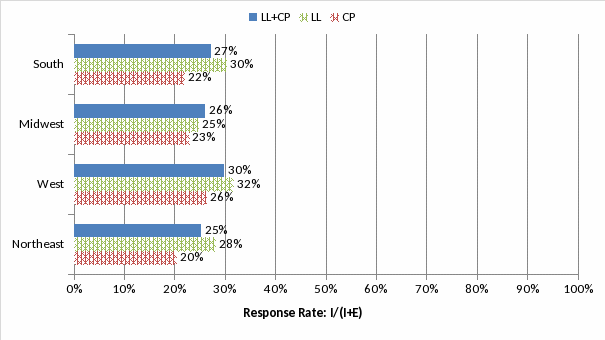
accuracy of cell phone records is known to be lower). As shown in Figure 12
(blue bars), response rates for the full RDD sample (landline and
cell phone combined) varied significantly by region,
 ,
with the West region being five points higher than the Northeast. In
the landline sample (green bars), response rates were higher for the
West and South regions, whereas for the cell phone sample (red
bars), response rates were higher for the West region.
Figure 12. Response Rates by Region for 2011 Boat Survey, RDD Sample (LL + CP)
An alternative approach to non-response analysis in RDD surveys is to compare responses based on the point in the dialing protocol at which a completed interview was achieved. Although this type of analysis does not technically compare responders to non-responders, it can approximate such a comparison to the extent that late responders are similar to non-responders. The cumulative distribution of call attempts required to achieve a completed interview for all records on the survey dataset is shown in Figure 13.
Following the same dichotomization used for the 2011 Boat Survey RDD analysis, respondents who required 5 or fewer call attempts are classified as “early responders” and respondents who required more than 5 attempts are classified as “late responders.” This results in 79% of responses being categorized as early and 21% of responses being categorized as late.
Figure 13. Proportion of Completed Participation Survey RDD Interviews Achieved by Number of Call Attempts
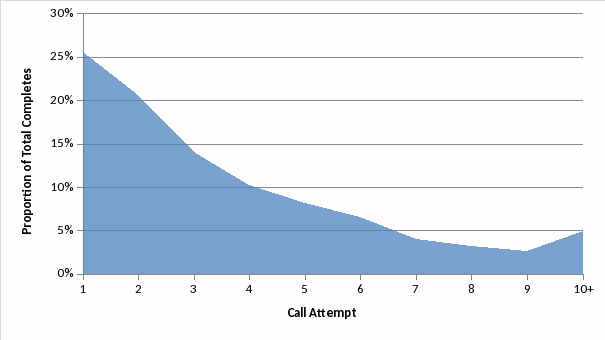
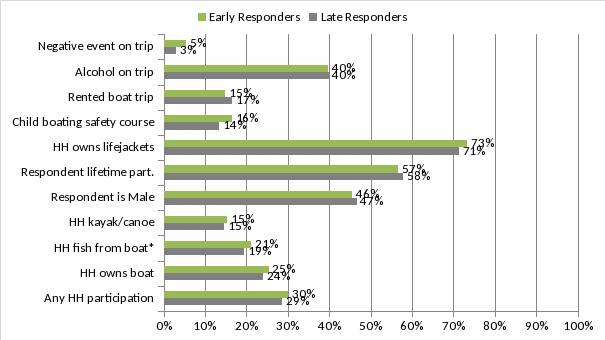
Figure 14 compares the proportions for selected dichotomous survey items between early and late responders. Significant differences are marked with an asterisk at the end of the survey item label (y-axis).
Of the 11 items analyzed, only one—the proportion of households in which someone had fished from a boat during 2012—was significantly different between early and late responders, with early responders being slightly more likely to report having done so. Otherwise, there was little difference in survey outcomes between these two groups.
Figure 14. Mean of Selected Participation Survey Items for Early and Late Responders
Two continuous demographic measures
were also compared between early and late responders. Late
responders had significantly fewer people living in their households
(M = 2.67, SD = 1.47) compared to early responders (M
= 2.75, SD = 1.47),
 .
In addition, late responders were significantly older (M =
53.26, SD = 18.26) compared to early responders (M =
52.59, SD = 16.09),
 .
This demographic pattern is identical to that observed in the
analysis of the RDD sample from the 2011 Boat Survey.
Conclusions
With regard to the observed regional variation in response rates, the risk of bias is small due to responses being weighted to known population totals within each state. Although a small number of significant differences were observed in survey outcomes between early and late responders in the Participation Survey, the magnitude of these differences was very small. Taken together, these analyses suggest that, to the extent that late responders are similar to non-responders, there is low risk for bias due to non-response in this survey.
| File Type | application/vnd.openxmlformats-officedocument.wordprocessingml.document |
| Author | Kurt R. Peters |
| File Modified | 0000-00-00 |
| File Created | 2021-01-29 |
© 2026 OMB.report | Privacy Policy