J - Call Block Research study
J - Call Block Research study.docx
American Time Use Survey-Eating and Health Supplement
J - Call Block Research study
OMB: 1220-0187
Possibilities to Improve Calling Efficiency in the American Time Use Survey
Brian Meekins, Research Statistician
Office of Survey Methods Research
March 30, 2013
Purpose: To identify patterns in call history data that can create greater efficiencies in calling without creating greater bias in American Time Use Survey (ATUS) estimates.
Data: This analysis examined 50,145 sample cases attempted by the ATUS for interview from January of 2006 to December of 2007. As in all ATUS sample, these cases completed Wave 8 of the CPS. In addition, the cases analyzed for this work provided a phone number for contact by CPS interviewers.1 These cases provided a telephone number in CPS interviews and completed Wave 8 of that survey. Call history information is available for each of these cases, which includes the date, time, day of the week, outcome, and length of each call attempt. Demographic and telephone usage information collected by CPS interview is also available. For 51 percent of the cases – those completing the ATUS – additional demographic information and time use data are also available.
Methodology: Call efficiency is measured by the number of successful outcomes per effort expended. A successful outcome is defined in one of three ways: a completed interview, a contacted case, or a sample unit determined to be ineligible (and therefore out of sample and requiring no further calling). Effort is measured by the number of calls to sample cases or the number of days sample cases remain in the field. The functional form of calling efficiency can be modeled as time-to-event data or a survival curve, where the event is some form of a successful outcome: interview completion, contact, or completion or ineligible combined, and time is attempts or days in the field.
A number of plots are used in order to assess the efficiency of ATUS calling. Most of these plots juxtapose successful outcome by effort. One example of such a plot is the cumulative survival plot that begins at the point of zero attempts on the x-axis and the total number of sample units on the y-axis. Advancing one unit on the x-axis indicates an additional attempt made to all sample units. All sample units that receive a successful outcome at a given attempt are removed from the curve. In this way the curve decreases to a non-zero minimum indicating that full effort by ATUS has been expended and no additional attempts are made to the remaining sample units. Other plots may show the probability of contact or completion by sample attempt or days in the field.
In addition to examining plots, these data are analyzed using proportional hazard models.2 The “hazard” of a successful outcome is regressed on a long list of covariates that include: demographic variables, telephone usage and some survey operation information from the CPS, as well as call history information from the ATUS. Appendix A describes the key variables used in these models. The results of the “best3” proportional hazard model are verified using stepwise logistic regression.
In an analysis of calling efficiency it is sometimes useful to eliminate from the analysis the cases that are relatively easy to contact or complete in order to focus on cases that are more difficult. In this way, the analysis employs different “cuts” on the data including: 1. the entire sample; 2. cases with more than one attempt; 3. cases with more than three attempts; 4. cases with more than seven attempts; 5. cases in the field more than one day; and 6. cases with a recorded contact. The majority of the plots incorporate all sample units, but hazard models are only run on sample units with more than one attempt. For the five other cuts on the data we found the best fitting model for both contact and completion. Therefore a total of 10 “best” models were found and confirmed with stepwise logistic regression.
Particular attention was given to the time of day of the call attempt. Sample units with certain characteristics are plotted against the time of day of both contact and completion. In this way, we can ascertain the time of day that will most likely lead to a successful outcome.
Given the outcome of this analysis, we can propose changes in order to improve calling efficiency. However, if these proposals suggest the elimination of some call attempts or field days, then the impact of these proposed changes is examined in three ways. For each proposal the average response rate is calculated and compared to the current approach. In addition, the CPS demographic information for completed interviews for each of the proposed cuts is compared to the CPS demographic information of the completed interviews under the current approach and the CPS demographic information for the entire sample. Finally, time use estimates from the ATUS are calculated for those completed interviews under the conditions of the proposed cut and compared to the current calling methodology.
Findings: Within the years 2006 and 2007 approximately 51.6 percent of cases attempted in the ATUS resulted in a completed interview or sufficient partial. Table 1 in Appendix C lists the percentages of all final call dispositions divided into the four major categories of completion or sufficient partial, ineligible, refusal, or noncontact. The definitions for these categories are found in Appendix A. Table 2 in Appendix C summarizes some of the operational information pertinent to this research, including the average and median number of call attempts, survey days, days record is active, and interview length. In addition, for sample units that have one or more contacts, the mean and median number of contacts and attempts to initial contact is calculated. These measures are explained in detail in Appendix A. The mean number of attempts (11.6) and survey days (3.1) is much higher than the median number of attempts (6) and survey days (2). This indicates a positively skewed distribution where a few of the sample units receive a very large number of attempts.
Efficiency Plots: Plots examining the outcome of call attempts by attempt number or day in the field reveal steep diminishing of positive outcome (either a completed interview or contacted household) as the number of attempts to a sample unit becomes larger. The shape of these plots is consistent with a survival function (inverse of the hazard function), where one can observe sharp decline in the first five attempts, or the first day of calling and a more gradual decrease over the remainder of the attempts or days in field.
Figure 1 in Appendix D, plots this decrease by attempt. Beginning with the entire sample at zero attempts, the plot shows the resulting curve when a sample unit is removed from the active sample (the sample available for calling) by way of completion. We refer to this action of removal from the active sample as being “cleared.” On the first attempt, approximately 5,000 cases are completed and therefore removed from the active sample, or cleared. The result is a steep decline over the first five data points on the plot. Subsequent attempts are less fruitful until a near plateau is reached at 25 attempts, indicating that very few of these remaining cases are completed with each successive attempt. Figure 2 shows the same curve for initial, or first, contact with a household. In this case, the unit is cleared if some contact is made to the household. Again, after 25 attempts the curve becomes quite flat. A recurring theme in this analysis is the large extent to which contact drives completion.
Examining calling efficiency in a different way, we can see in Figure 3 that the percentage of call attempts that end in a noncontact increases dramatically after 30 attempts. Prior to 30 call attempts the probability is between 75 and 80%, but after 45 attempts 95 percent of the calls placed to sample units result in a noncontact.
Figure 4 shows the number of sample units cleared by completion by days in the field. We can easily see the general shape of the survival curve including a plateau or relatively flat part of the curve after five attempts. We can also plot the cases cleared by completion within each day the sample unit is fielded. Figure 5 shows the cases cleared by first, or initial, contact by attempt, where each line indicates a successive day in the field. The top line is the first day in the field where up to 10 attempts are shown within that day, the second line from the top is the second day in the field, showing a less steep curve over the initial five attempts. This line continues to become less steep s the number of days in the field progresses (eight days are shown), so that the eighth day of calling is quite flat.
Models: A number of significant covariates emerged from proportional hazard models (and were confirmed using simple logistic regression). Table 3 in Appendix C shows selected hazard ratios and statistical significance of direct effects for models where the hazard of completing an interview with a sampling unit is regressed on number of covariates. In addition, Table 3 shows the hazard ratios and statistical significance of models where contacting a household for the first time is regressed on a similar group of covariates. Both of the models used sample units with more than one call attempt. Hazard ratios for models using sampling units that were more difficult to complete or contact (those with greater than three attempts, seven attempts, more than one field day, and previously recorded contact) are not shown.
In models of the hazard of contacting a household, where sample units were called more than once, not having the same target respondent on the ATUS as the CPS had little to no effect. However, if the sample unit did not complete a CPS interview through a Census call center, the hazard ratio (HR) was statistically significant and less than one (HR = 0.80). This indicates a modest negative relationship between initial contact of a sampling unit and having a CPS interview through a call center. Similarly, if the sample unit never conducted a CPS interview over the telephone in the field, the hazard of initial contact was significantly smaller (HR = 0.82). These relationships were fairly strong and statistically significant when examining sample units with more than one call attempt, but for more difficult to reach populations, where the number of attempts or number of days in the field were higher, the relationship was diminished or unobserved.
A larger number of significant findings are observed when regressing the hazard of completion on a similar set of covariates. Many of these relationships can be observed when modeling sample units with more than one attempt, sample units more than three attempts, sample units with more than seven attempts and sample units with more than one day in the field. Having no refusals in previous attempts is, unsurprisingly, a strong predictor of interview completion when considering sample units with one or more attempts (HR = 2.52), three or more attempts (HR = 1.90), seven or more attempts (HR = 1.77), and more than one day in the field (HR = 1.72). Sample units with two or more consecutive no answer outcomes had a reduced hazard of completion compared to other sample units. This is true regardless of the number of previous attempts to the sampling unit.
Having a different ATUS reference person than the CPS is negatively related to the hazard of completion (HR = 0.85). In addition, largely as a result of difficulty of contacting these households, a sample unit that did not complete a CPS interview through a Census call center, had a significantly lower hazard of completing an ATUS interview (HR = 0.70). Similarly, if the sample unit never conducted a CPS interview over the telephone in the field they had a significantly lower hazard of completing an ATUS interview (HR = 0.66). Finally, sample units that provided complete income data on the CPS had a significantly lower hazard of completing the ATUS (HR = 1.44).
In sample units with a previously recorded contact, not having a ‘no answer’ was significantly, strongly, and positively related to subsequent completion (HR =2.20). Calling around the same time as the previously recorded contact (plus or minus 1 hour) was modestly and positively related to completing the ATUS interview (HR = 1.17). Unsurprisingly, among sample units that have a recorded contact, having a refusal is a negative predictor of completion (HR = .65).
Sample units that are called regarding their time use on Saturday or Sunday (weekend diary days) are slightly more difficult to contact and complete an interview. Sample units called in the summer are also more difficult to contact and interview. Sample units occupied by the owner of the home and sample units with a female reference person are have a greater hazard of completing and interview, but no direct effect is observed for initial contact of the sampling unit. Sampling units with a reference person with a college degree or more are have a greater hazard of completing and interview. Sample units with older reference persons are easier to complete and contact, while sampling units in which only Spanish is spoken are more difficult to complete or contact. Black households are much more difficult to contact, but a similar effect for the hazard of completing an interview is not observed. Odds ratios for these effects can be found in Table 5 in Appendix C.
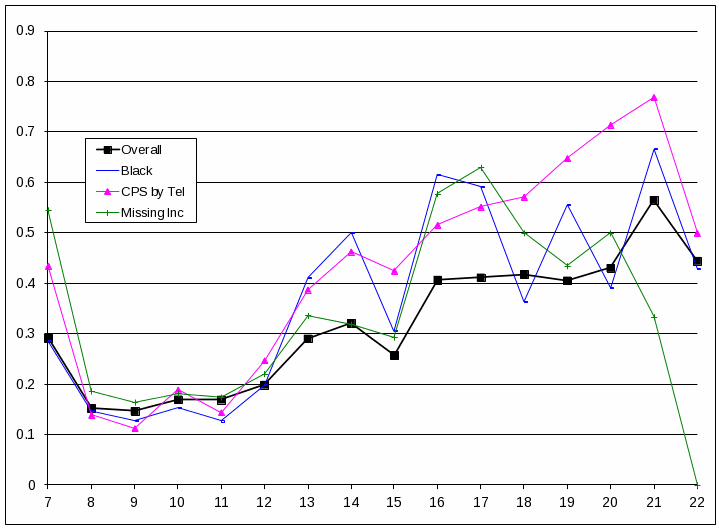
Time of Day: The time of day of the ATUS calling appeared to be related to the probability of completion for those that conducted a CPS interview by telephone and those that did not provide valid income data for the CPS. Specifically, CPS telephone interview completions were more likely than their counterparts to complete their interviews in the evening until quite late (9pm - 10pm). By contrast income incompletes were most likely to complete interviews between three and six o’clock, with the probability of completion being quite low in the late evenings. Finally, sample units with a black reference person are more likely to be contacted and complete an interview in the afternoon. Figure 6 in Appendix D shows the proportion of attempts that result in a completed interview by time of day for all sample units, sample units that failed to provide income data on the CPS, sample units with a black reference person, and sample units that completed a CPS telephone interview. Figure 7 shows the proportion of attempts that result in a contact by time of day for sampling units with the same characteristics.
Efficiency Conditions: Based on the analysis of the call history data, ATUS sample units with the following three efficiency conditions receive a disproportionate large number of attempts:
1. Cases that have a recorded refusal.
2. Cases that have 25 call attempts or more.
3. Cases that have been in the field 5 days (weeks) or more.
Given that eliminating further attempts to sample units with these conditions would improve efficiency in ATUS calling, they warrant further inspection. Table 5 in Appendix C compares the current approach by ATUS with cuts based on the three different “efficiency” conditions for an average calling period. We can see that on average under current strategy ATUS sample units are attempted 21,451 times. By eliminating cases that have one recorded refusal (Condition 1), the total number of attempts in an average field period would be decreased to 20,773. If sample units with 25 call attempts or more (Condition 2) were dropped from subsequent calling the number of attempts would be reduced to 20,135. Finally, if all ATUS sample units that have been in the field 5 survey days (Condition 2) were dropped the total number of attempts would be 17,556, resulting in a savings of 5,895 attempts.
Not surprisingly, the number of completions would also be reduced across these three conditions. For an average calling period the total number of completed interviews under the current protocol is 1,078. Eliminating cases satisfying Condition 1 would eliminate 57 completed interviews on average, while eliminating cases satisfying Condition 2 and Condition 3, would eliminate 34 and 97, respectively. The resultant response rate (AAPOR RR1) is shown in the final column. While the savings in attempts is clear (under Condition 2 there is a 14 percent reduction in attempts), and the impact on response rates small (again under Condition 2 there is a two percentage point decrease), the impact on sample estimates must be assessed.
Table 4 in Appendix C summarizes the demographic characteristics of ATUS sample units as they were collected by CPS interview. In this table the full sample (completions and other outcomes) are compared to the current approach and to approaches that eliminates cases using each of the efficiency conditions. While there are some important differences between the full sample and completions, there are few differences between completions under the current approach and completions under any of the three efficiency conditions. As is typical, nonresponders are more likely to be renters, less educated, younger, and never married. However, while the differences are not great there is a consistent pattern of larger differences between Condition 3 and the current approach, as well as the full sample. This indicates that calling under Condition 3 will likely lead to ATUS respondents with consistently different characteristics than the population.
While the number of completions affects the response rate and the differences in demographic characteristics can lead to somewhat larger variance in the sample weights, the primary concern of making changes to calling protocol is nonresponse bias. Table 6 in Appendix C shows the cumulative time ATUS respondents spent engaged in major category activities during their diary day averaged across interview wave. In this case, no information is available for the entire sample, so the three efficiency conditions are compared only with the current approach. The largest differences across all conditions appear to be in the categories for Work and work related activities, where Condition 3 responders report almost four minutes less time and Socializing and leisure, where Condition 3 responders report almost 3.5 minutes more. The remainder of the differences, especially between Condition 1 or Condition 2 and the current approach, are very small.
Summary and Recommendations: Analysis of ATUS call history data from 2006 to 2007 indicates that a small number of ATUS sample units receive a disproportionately large amount of effort. Specifically, those sampling units with more than 25 attempts, sampling units that remained in the field longer than one month (five or more survey days), and those with a recorded refusal require a large number of attempts and result in relatively few completed interviews. In addition, eliminating completed interviews with these characteristics had little impact on time use estimates or sample demographics.
According to hazard models, significant predictors of contact and completion include having a telephone interview in the field or a CATI interview on at least one wave of the CPS. Having a refusal or consecutive no answer outcomes are also strong negative predictors of completion. Calling around the same time as a previous contact is a positive predictor of subsequent contact while refusing to provide income information on the CPS is a negative predictor.
In general, calling efficacy is greater in the later hours of the day. Sampling units with a Black reference person, sampling units that completed at least one wave of the CPS by telephone, and sampling units that refused to supply income information to the CPS has somewhat different patterns of contact and completion by time of day. Calls made to these sample units can be optimized.
In addition, the following is recommended in order to increase the efficiency of calling in the ATUS:
1. Increase the number of calls to previously contacted households around the time of the previous contact (and cut down on those outside of that time).
2. Do not purposely mix daytime and evening calls. This has little effect on the probability of either contact or completion.
3. Increase the number of calls made in the evening and call quite late (up until 10pm). A corresponding decrease in calling should be made during the day.
4. Limit late calling for those who have missing CPS income data.
5. Increase the number of attempts to Black households in the afternoon.
6. Increase the number of attempts made late in the evening for those that completed the CPS by telephone.
7. Cease calling on sample units with more than 25 call attempts. Consider eliminating ATUS sample units if they refuse once, have consecutive no answers, or are in the field for more than four survey days.
Appendix A: Variable Definitions
Outcome variables/call dispositions
completion – Completed interview or sufficient partial interview.
ineligible – Household is not eligible to complete the interview. Possible reasons include if the selected household member is underage or member of the Armed Forces or if the household is vacant or not a regular residence.
refusal – Respondent or household refuses to conduct the interview.
contact – Any completion, partial completion, ineligible, or refusal where a household member answered the phone.
noncontact – Any disposition where no one in the household answered the phone (busy, no answer, answering machine, etc.).
CPS Demographic Variables
age – Age of CPS reference person coded into quartiles
race – Race of CPS reference person coded as “black” or “not black”
home ownership status – Indicates whether the CPS reference persons owns their residence or rents.
number of persons – Coded as single person household, two persons, three or four persons, or five or more person household.
respondent education – Highest level of education received by CPS reference person. Coded as less than high school, high school/some college, or college degree or more.
parental nativity – Parental nativity of CPS reference person. Coded as both parents born in the U.S., one parent born in the U.S., or no parents born in the U.S.
marital status – Marital status of CPS reference person. Coded as married, separated/divorced/widowed, or never married
Hispanic – Hispanic, not Hispanic status of CPS reference person.
sex –CPS reference person is male or female.
employment status – Employment status of CPS reference person. Coded as full time, part time, or not employed.
student – Whether or not the CPS reference person is a student or not a student.
own children – At least one dependent child under the age of 16 in the home.
non-family members – At least one non-family member living in the household.
only Spanish – Spanish is the only language spoken in household.
Appendix A: Variable Definitions (cont.)
Other CPS Variables
telephone IV – At least one CPS interview was conducted by telephone.
CATI IV - At least one CPS interview conducted in Census Call Center.
same CPS and ATUS R– Flag for same reference person (respondent) selected in CPS and ATUS.
telephone in HH – Flag indicating that there is a telephone in the household.
telephone acceptable – CPS respondent indicated that a CPS telephone interview was acceptable.
income missing – CPS respondent refused to provide, or did not know household income.
ATUS Call History Variables
refusal flag - At least one ATUS refusal outcome was recorded for the household.
number of refusals – The number of recorded ATUS “refusal” outcomes for a household.
callback flag - At least one ATUS callback outcome was recorded for the household.
number of callbacks - The number of recorded ATUS “callback” outcomes for a household.
no answer flag - At least one ATUS no answer outcome was recorded for the household.
number of no answers - The number of recorded ATUS “no answer” outcomes for a household.
contact flag - At least one recorded ATUS outcome was a contact (completion, partial completion, ineligible, or refusal where household member answered the phone).
number of contacts - The number of recorded ATUS “no answer” outcomes for a household.
weekend interview – The ATUS respondent’s diary day was either Saturday or Sunday.
summer – Calling for this household took place during the summer (June, July, or August).
night or evening – Calling for this household took place during the evening (after 5pm).
diary day – The day of the week on which ATUS respondents report their activities. Interviews are attempted the following day of the week.
survey days (weeks) – The number of days which the call is attempted. Because ATUS sample units have a specific diary day of the week, they can only be called on one day of the week (the following day). Therefore, this is the same as the number of weeks the ATUS sample unit is in the field.
days record is active – The total number of days that the sample unit is remains in a non-final call disposition. This is calculated as the first day the sample unit is attempted subtracted from the last day the sample unit is attempted.
Appendix B: Hazard Function
The American Time Use call attempt data can be approximated by a number of continuous hazard functions. These hazard functions can be estimated using Cox Proportional Hazard models and expressed in the following manner:
Let T, represent time to an event. In the cases of ATUS call efficiency analysis the event can be an interview completion (or first contact, or ineligible and completions) and T is the number of attempts or days in the field required to produce that completion for a given household. Then the hazard function, which estimates the risk of an event occurring at any time t is:

In the Cox Proportional Hazard
models the log of this function is regressed on a baseline hazard
function, α(t)
and a number of covariates,
 :
:

In many cases the ATUS call attempt data are “right censored,” where the value of T is unknown for some sample units. The most typical example is when the Census decides to stop attempting the sample unit because some maximum number of attempts is reached, but fails to complete an interview. In this case the number of attempts, or time (T), to a completed interview is unknown. One attractive feature of the Cox model is that it is able to accommodate such right censored data.
The effect of a covariate in Cox Porportional Hazard Models is typically assessed with a hazard ratio. This ratio compares the hazard of cases given a certain set of covariates(Xβ) compared to those with a different set of covariates (X′β):

These hazard ratios (hr) are interpreted similarly to odds ratios derived from logistic regression coefficients (where hazard and risk in hazard models are analogous to odds and likelihood in logistic regression). Therefore, the reported odds ratios in this paper can be interpreted as the difference in households with a given condition (X=x1) compared households with a reference condition (X=x2). A hazard ratio of one would represent no difference between the two conditions, while hazard ratios that are less than one (but never less than zero) indicate a negative relationship between a condition and risk compared to a reference condition, and hazard ratios greater than one indicate a positive relationship.
Appendix C: Tables
Table 1: Final Disposition All Sample Data
|
Count |
Percent |
Completion or Sufficient Partial |
*25,867 |
51.6 |
Ineligible |
8,426 |
16.8 |
Refusal |
7,928 |
15.8 |
Noncontact |
7,924 |
15.8 |
*Includes those later discarded due to data quality concerns |
||
Table 2: Basic Call Attempt Information
|
Mean |
Std dev |
Median |
Attempts |
11.6 |
12.1 |
6 |
Survey Days (Weeks): |
3.1 |
2.4 |
2 |
Days Record is Active |
18.1 |
18.6 |
14 |
Interview Length (min) |
23.8 |
12.8 |
23 |
Number of Contacts* |
2.7 |
4.4 |
1 |
Attempts to Initial Contact* |
7.4 |
8.1 |
4 |
*For those with at least one contact in call histroy |
|||
Table 3: Odds Ratios for Direct Effects of Covariates in Proportional Hazard Models of Interview Completion and Initial Contact*
|
Completion |
Contact |
||
Variable |
Odds Ratio |
Stat Sig |
Odds Ratio |
Stat Sig |
Refusal on first call |
2.524 |
<.0001 |
--- |
--- |
Callback on first call |
.993 |
.8310 |
--- |
--- |
No answer on first call |
1.640 |
<.0001 |
--- |
--- |
First called after 5pm |
1.419 |
.0013 |
.887 |
.0919 |
Saturday or Sunday diary day |
.966 |
.0134 |
.958 |
<.0001 |
Summer |
.920 |
<.0001 |
.937 |
<.0001 |
Owns home |
1.310 |
<.0001 |
--- |
--- |
Number in HH : 1 person |
1.015 |
.6093 |
--- |
--- |
2 persons |
1.007 |
.7826 |
--- |
--- |
3 or 4 persons |
1.025 |
.2590 |
--- |
--- |
Both parents born in U.S. |
1.064 |
.0042 |
--- |
--- |
One parent born in U.S. |
1.117 |
.0035 |
--- |
--- |
Male |
.947 |
.0002 |
--- |
--- |
Respondent Ed: < high school |
.836 |
<.0001 |
.993 |
.7066 |
high school/some college |
.792 |
<.0001 |
.915 |
<.0001 |
Non-hispanic |
1.072 |
.0050 |
1.189 |
<.0001 |
Employed full time |
.851 |
<.0001 |
.801 |
<.0001 |
Employed part time |
.988 |
.6347 |
.907 |
<.0001 |
Age: first quartile |
.633 |
<.0001 |
.635 |
<.0001 |
second quartile |
.669 |
<.0001 |
.643 |
<.0001 |
third quartile |
.772 |
<.0001 |
.753 |
<.0001 |
Non-black |
--- |
--- |
1.309 |
<.0001 |
Only Spanish spoken in HH |
.704 |
<.0001 |
.825 |
<.0001 |
Missing CPS income |
1.440 |
<.0001 |
--- |
--- |
Same ATUS/CPS R |
.847 |
<.0001 |
.977 |
.0368 |
CPS CATI int |
.703 |
<.0001 |
.804 |
<.0001 |
CPS Telephone int |
.658 |
<.0001 |
.819 |
<.0001 |
*Sample cases with one or more call attempts --- Not in model |
||||
Table 4: CPS Demographic Characteristics by Efficiency Condition
|
All Outcomes |
Completed Interviews |
|||
Demographic Characteristic |
(Full Sample) (n=50,145) |
Current (n=25,867) |
Condition 1 (n=24,494) |
Condition 2 (n=25,052) |
Condition 3 (n=23,532) |
Telephone IV Acceptable |
90.5 |
93.5 |
93.5 |
93.5 |
93.4 |
Telephone in HH |
93.5 |
95.9 |
95.9 |
95.8 |
95.8 |
Only Spanish in HH |
3.0 |
2.9 |
2.9 |
2.9 |
2.8 |
Renter |
32.2 |
25.3 |
25.4 |
25.3 |
25.4 |
Number in HH : 1 person |
24.1 |
25.1 |
25.0 |
25.2 |
26.0 |
2 persons |
23.8 |
24.4 |
24.3 |
24.5 |
24.8 |
3 or 4 persons |
38.0 |
37.2 |
37.3 |
37.1 |
36.6 |
5 or more persons |
14.1 |
13.4 |
13.4 |
13.3 |
12.7 |
Family income: first quartile |
22.3 |
19.4 |
19.1 |
19.6 |
19.9 |
middle 50% |
52.9 |
52.6 |
52.6 |
52.5 |
52.5 |
upper quartile |
24.8 |
28.0 |
28.3 |
28.0 |
27.6 |
Age: first quartile |
25.4 |
20.8 |
20.9 |
20.6 |
20.2 |
second quartile |
23.8 |
22.6 |
23.0 |
22.4 |
22.1 |
third quartile |
26.5 |
28.1 |
28.3 |
28.1 |
27.9 |
fourth quartile |
24.3 |
28.4 |
27.9 |
29.0 |
29.8 |
Own children in HH |
65.3 |
62.9 |
63.2 |
62.6 |
61.8 |
Employed full time |
52.4 |
50.8 |
51.2 |
50.3 |
49.8 |
Employed part time |
10.1 |
10.8 |
11.0 |
10.9 |
10.8 |
Not employed |
37.5 |
38.4 |
37.9 |
38.8 |
39.4 |
Black |
16.5 |
13.2 |
13.0 |
13.0 |
13.0 |
Respondent Ed: LT high school |
20.0 |
18.1 |
17.8 |
18.2 |
18.1 |
high school/some college |
55.5 |
53.2 |
53.1 |
53.1 |
53.2 |
college degree or more |
24.5 |
28.7 |
29.1 |
28.8 |
28.7 |
Marital Status: married |
47.1 |
50.8 |
50.9 |
50.9 |
50.5 |
separated, divorced, widow |
25.0 |
25.5 |
25.3 |
25.6 |
26.1 |
never married |
27.9 |
23.7 |
23.8 |
23.6 |
23.4 |
Hispanic |
15.9 |
13.6 |
13.6 |
13.6 |
13.2 |
Female |
55.5 |
57.3 |
57.2 |
57.3 |
57.8 |
Table 5: Average Call Attempts, Completions, and Response Rate for Interview Cycle by Efficiency Proposal
|
Attempts |
Attempts Saved |
Completions |
Completions Lost |
Response Rate* |
Current |
23,451 |
--- |
1,078 |
--- |
61.8 |
Condition 1 |
20,773 |
2,678 |
1,021 |
57 |
58.5 |
Condition 2 |
20,135 |
3,316 |
1,044 |
34 |
59.8 |
Condition 3 |
17,556 |
5,895 |
981 |
97 |
56.2 |
*Response rate is unweighted AAPOR RR1. For explanation, see The American Association for Public Opinion Research. 2008. Standard Definitions: Final Dispositions of Case Codes and Outcome Rates for Surveys. 5th edition. Lenexa, Kansas: AAPOR. |
|||||
Table 6: Average Cumulative Duration of Time Spent in Major Category Activities by Efficiency Proposal
|
Completed Interviews |
|||
Time Use Estimate* |
Current (n=25,867) |
Condition 1 (n=24,495) |
Condition 2 (n=25,052) |
Condition 3 (n=23,532) |
Personal care |
737.63 |
736.49 |
737.61 |
737.06 |
Household activities |
153.86 |
153.57 |
153.91 |
154.22 |
Caring for & helping HH members |
114.05 |
114.40 |
114.37 |
115.24 |
Caring for & helping non-HH members |
67.47 |
67.54 |
67.88 |
67.64 |
Work & work related |
424.35 |
424.31 |
423.03 |
420.59 |
Education |
262.53 |
263.72 |
261.21 |
261.16 |
Consumer purchases |
63.29 |
63.32 |
63.31 |
63.74 |
Prof. and personal care services |
60.57 |
60.42 |
60.72 |
60.61 |
Household services |
45.84 |
45.40 |
46.03 |
45.06 |
Govt. & civic services |
66.91 |
68.54 |
65.37 |
64.40 |
Eating and drinking |
70.56 |
70.71 |
70.76 |
70.81 |
Socializing, leisure |
300.57 |
299.28 |
301.97 |
304.06 |
Sports & exercise |
109.98 |
109.46 |
109.29 |
107.69 |
Religious and spiritual |
105.69 |
105.39 |
105.53 |
104.80 |
Volunteer |
131.74 |
132.39 |
130.71 |
131.22 |
Telephone calls |
46.00 |
46.06 |
46.16 |
46.21 |
Traveling |
84.68 |
84.65 |
84.72 |
84.53 |
*For detailed description of time use categories see ATUS Coding Lexicons at: http://www.bls.gov/tus/lexicons.htm |
||||
Appendix D: Figures
Figure 1 Cases Cleared by Completion by Attempt
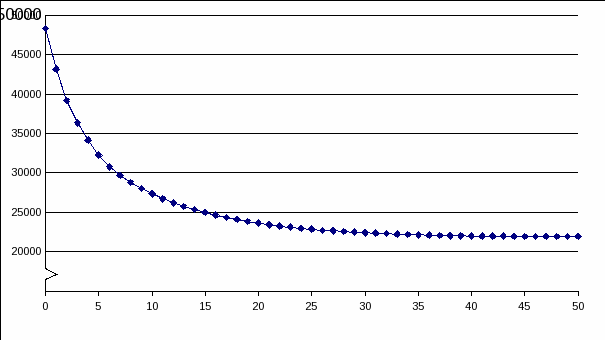
Figure 2: Cases Cleared by First Contact by Attempt
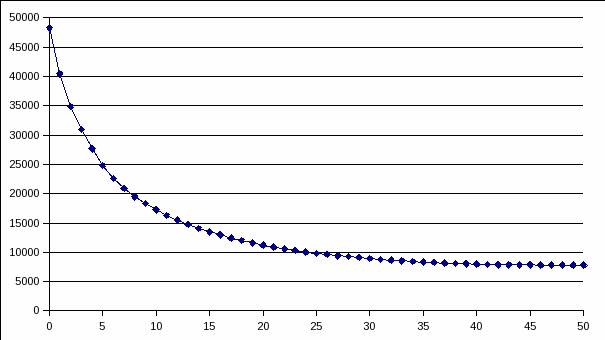
Figure 3: Percentage of Calls Resulting in Noncontact by Attempt Number
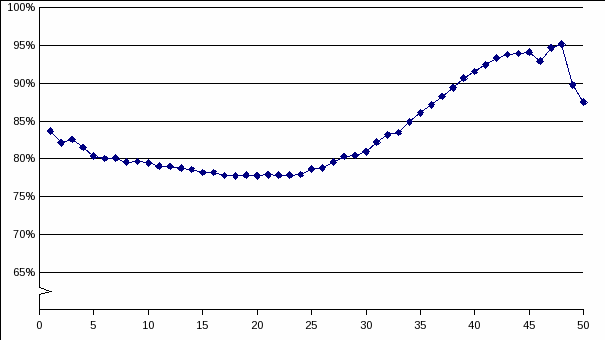
Figure 4: Cases Cleared by Completion by Days in Field
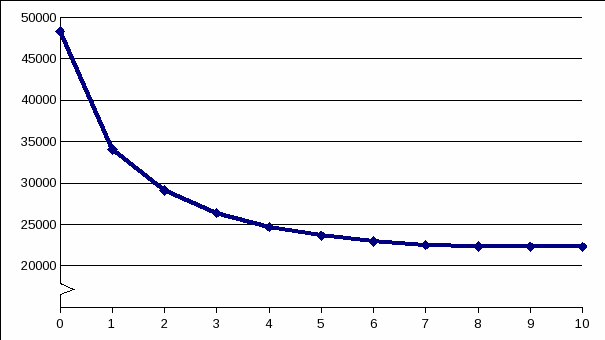
Figure 5: Cases Cleared by First Contact by Attempt within Day
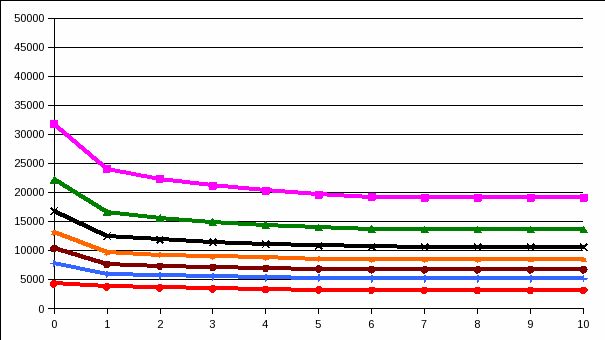
Figure 6: Percentage of Attempts Resulting in Completion by Time of Day
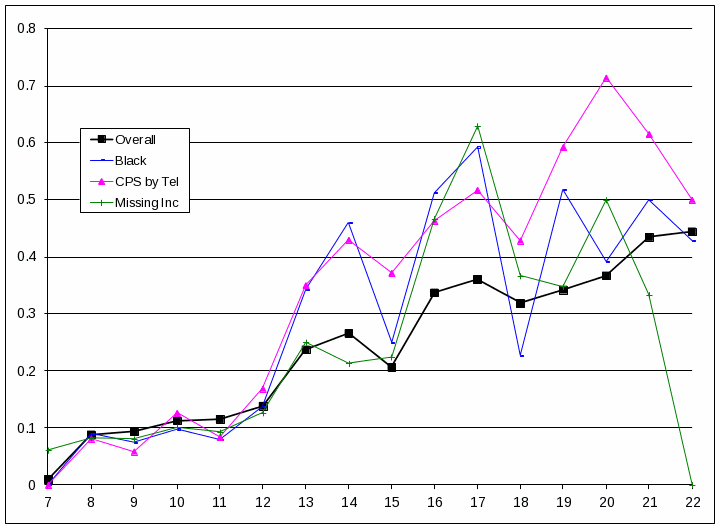
Figure 7: Percentage of Attempts Resulting in Contact by Time of Day
1 CPS Wave 8 respondents selected for the ATUS who do not provide a phone number during any of their CPS interviews are instead mailed request to complete the ATUS survey by calling a Census telephone number. Those cases are excluded from this analysis.
2 For a more detailed explanation of hazard models as applied to these data see Appendix B.
3 Models are evaluated by goodness of fit statistics, coefficient strength, and parsimony.
| File Type | application/vnd.openxmlformats-officedocument.wordprocessingml.document |
| Author | meekins_b |
| File Modified | 0000-00-00 |
| File Created | 2021-01-28 |
© 2026 OMB.report | Privacy Policy