Risk Reduction Focus Group
Focus Groups As Used By EPA For Economics Projects (Renewal)
2205.12 Questionnaires
Risk Reduction Focus Group
OMB: 2090-0028
Example Questions for Focus Group Questionnaires
The questions below represent the kinds of questions we intend to ask respondents, not a complete survey instrument.
Example of Introductory Text
In this meeting we will discuss environmental programs that protect public health by reducing exposure to toxic air pollutants. Examples of toxic air pollutants include benzene, dioxin, asbestos, toluene, and metals such as cadmium, mercury, chromium, and lead compounds.
Before we get started, however, we would like to ask you a few simple questions. There is no right or wrong answer to these questions: We are just interested in your opinions.
Examples of Initial Questions
Q0. (Warm-up Questions)
What have you heard about these kinds of pollutants?
How much of a concern to you are these pollutants in the air?
Questions on Protecting Different Groups of People
Q1. We would like you to tell us how much you care for the health of the members of several groups of people. Please rate each of the groups listed below on a scale from 0 to 100 points, where 0 = “I don’t care at all” and 100 = “I care very much.” The number of points indicates how much you care about reducing health risks to that group. Start with yourself. The size of each additional group gets larger and excludes members of the previous groups. So, the first group is yourself, the second group is your family (excluding you), the third is your neighbors (but not yourself and your family).
By way of example, if you cared about your family’s risks more than your own, you might allocate 50 points to yourself and 100 points to your family. But you can’t assign more than 100 points to any one group.
Assign at most 100 points to each of the following groups to indicate how important it is to you to reduce health risks to the group:
Reducing risks to myself _________
Reducing risks to only my family members (not yourself) ________
Reducing risks to only my neighbors (not you or your family) _________
Reducing risks to people in the city where I live (but not the above groups) ________
Reducing risks to the rest of my state (but not the above groups) __________
Reducing risks to the rest of the nation (but not the above groups) __________
Q1a: Are the instructions on assigning points in question 1 clear? Were they leading? Did you see these categories as mutually exclusive?
Q2. In 1980 4 children out of every 100 children in the US suffered from asthma. In 2009, 10 children out of every 100 suffered from asthma. A child whose family is below the poverty line is more likely to develop asthma than a child whose family is above the poverty line. Suppose that money were available to help asthmatic children in poor families.
You have the option of allocating this money in three ways:
Make an air purifier available,free of charge, to poor families whose children suffer from asthma.
Give a cash grant equal to the cost of the air purifier to poor families whose children suffer from asthma, with information about where air purifiers can be purchased.
Give a CVS drugstore gift certificate equal to the cost of the air purifier to poor families whose children suffer from asthma, with information about where air purifiers can be purchased.
Which option would you choose? Please Circle (a), (b), or (c).
Q2a. Why did you choose this option? Did the inclusion of poor families in the question affect how you considered the options and responded? How so?
Examples of Questions on Air Toxics and Distributions (with potential graphics)
Health Risks from Toxic Air Pollution
Now we’d like you to consider health risks from one toxic air pollutant—benzene. Benzene is produced whenever oil is burned, among other sources. It is produced by oil refineries, some other industries and is also found in car and truck exhaust. Benzene has been shown to cause cancer in humans, including leukemia and cancer of the mouth. Regulations have reduced benzene emissions from some sources, however there are still cancer deaths associated with benzene exposure.
The graph below (Figure 1) divides the 2010 US population (approximately 300 million people) into 5 groups of 60 million people each. The bars in the chart show the estimated number of cancer deaths due to benzene in each group. The groups have been ordered from the lowest to the highest risk: there are 60 deaths expected in the lowest risk group and 600 in the highest risk group.
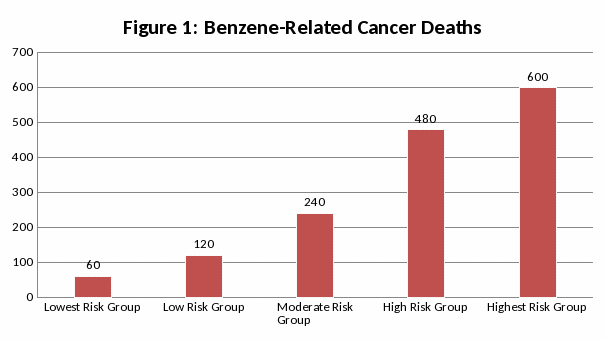
Q3. Can you tell from the figure how many deaths are expected in the moderate exposure group (the middle bar)? _____
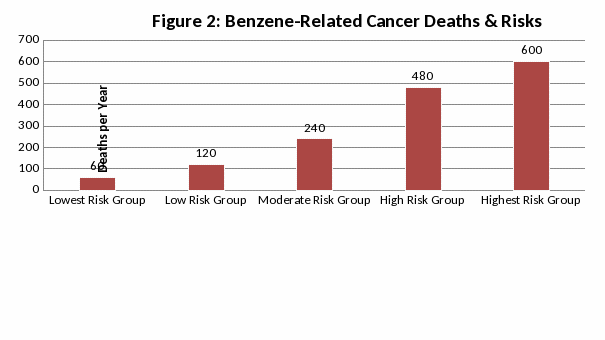
Another way to express the risks in each group is to look at the percent of people in the group who are likely to die each year. If 60 people will die out of 60 million, this is the same as 1 person dying out of every million people. A shorthand way of saying this is that each person’s risk of dying in the lowest group is 1 in 1 million. Figure 2 is the same as Figure 1, except that the risk of dying from benzene exposure has been added below each bar.
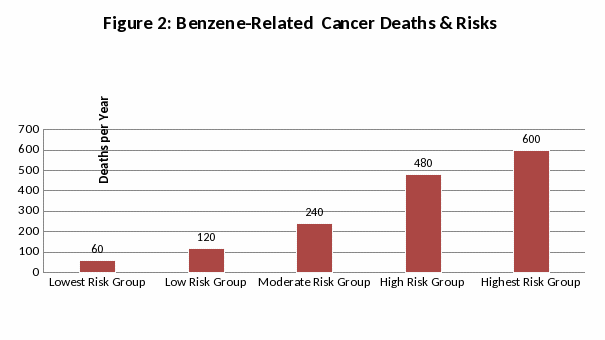
Q4.Looking at Figure 2, what is the risk of death for people in the highest risk group—the one where 600 people will die out of the 60,000,000 people in the group? _____________________
Q5.How many times greater is the risk of dying in the middle risk group than in the lowest risk group? _______________________________________________________________________
Examples of Questions on Willingness to Pay for Risk Reductions for self and family (for alternative policies, with different assumed risk groups)
We would like you to assume that you and your family are in the middle risk group—the group with 240 expected deaths and a risk of dying of 4 in a million in this figure:
< same as Figure 2, above>
Willingness to Pay for Health Risk Reductions for self and family (assuming middle risk group)
P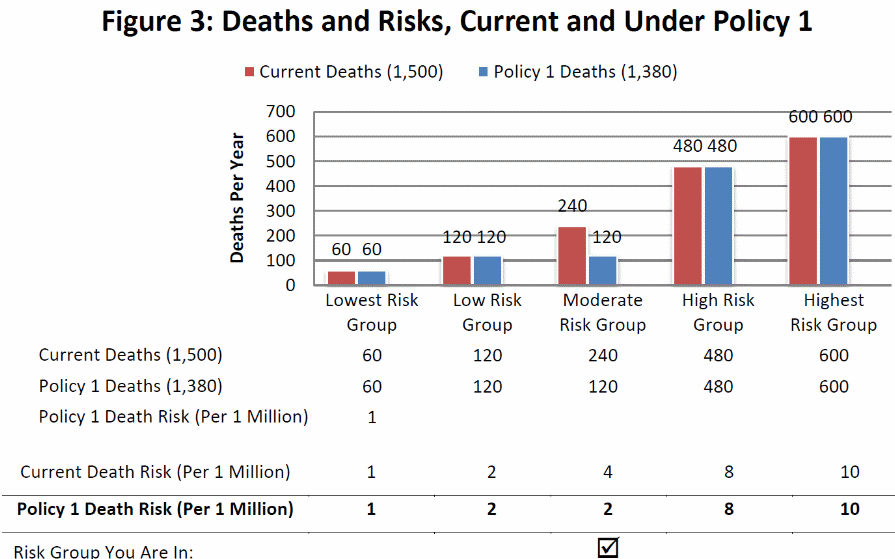
olicy
1.
Regulations
are being considered that would reduce emissions of benzene and thus
reduce the risks shown in the previous graphs. Suppose that these
regulations would cut the risk in your group (the middle group) in
half—from 4 in a million to 2 in a million. This would save
120 lives each year, as shown in Figure
3 below. Remember,
you and your family are in this risk group, so you would benefit from
the policy by having lower risk, as would the rest of the 60 million
people in your group.
Q6.How much do you think this policy would reduce your family’s risk? ____________
Q7a.Would you be willing to pay something for this risk reduction?
<If yes>Q7b. Would you be willing to pay $10 each year for this risk reduction? Yes orNo
<if yes>Q7c. What is the most you would be willing to pay each year? ___________________
Q8. When you answered the last question, were you paying to reduce risks to:
Circle all that apply:
yourself
your family
your neighbors
people living in your city
people living in your state
people throughout the country
Q8a. Is it clear that these categories are mutually exclusive?
Policy 2. Suppose that the program that would reduce risks to your group could be expanded to reduce risks to persons in the two highest risk groups as well as yours. Reducing risks in the two highest risk groups will not benefit you directly, as you and your family are still in the middle risk group.
S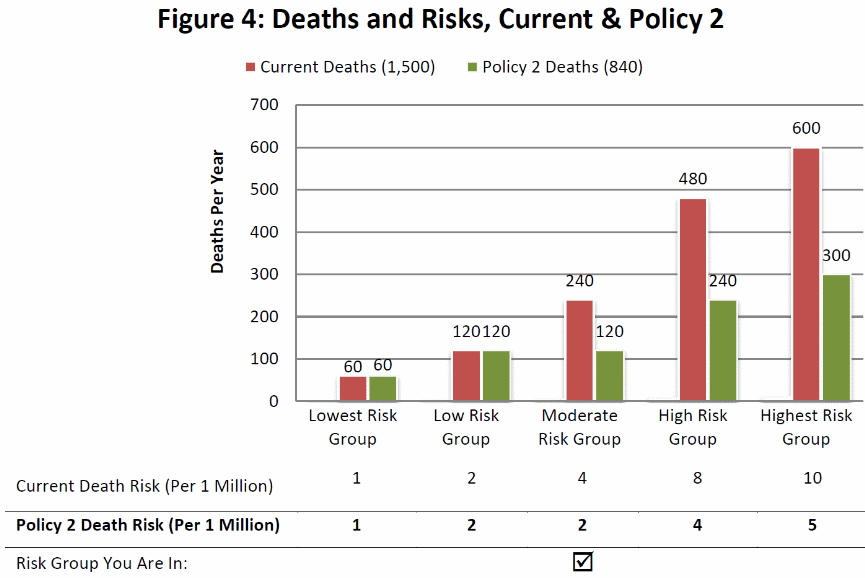
pecifically,
suppose that risks to persons in the two highest risk groups were
also cut in half. This would save 540 lives in the two highest risk
groups, as well as 120 lives in your risk group, as shown in Figure
4, for a total of
660 lives.
Q9. Would you be willing to pay something for this risk reduction? Circle: Yes orNo
Q10. Would you be willing to pay more than you would pay for the risk reduction to your group alone? Circle: Yes or No
<If yes>Q10b.How much more? ____
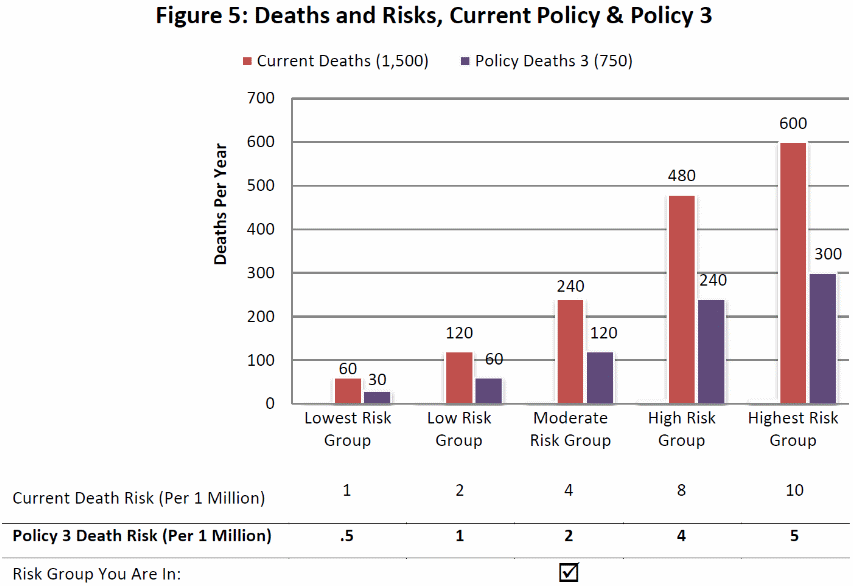
Policy 3. Suppose that the program to reduce exposure to toxic air pollutants were extended to all the groups. This would reduce risks by 50% in all groups, saving a total of 750 lives, as shown in this figure.
Q11. Would you be willing to pay something for this risk reduction?
Circle: Yes orNo
Q12. Would you be willing to pay more than you would pay for the risk reduction to your group alone?
Circle: Yes or No
<If yes>Q12b. How much more? ____________
Willingness to Pay for Health Risk Reductions for self and family (assuming High Risk Group)
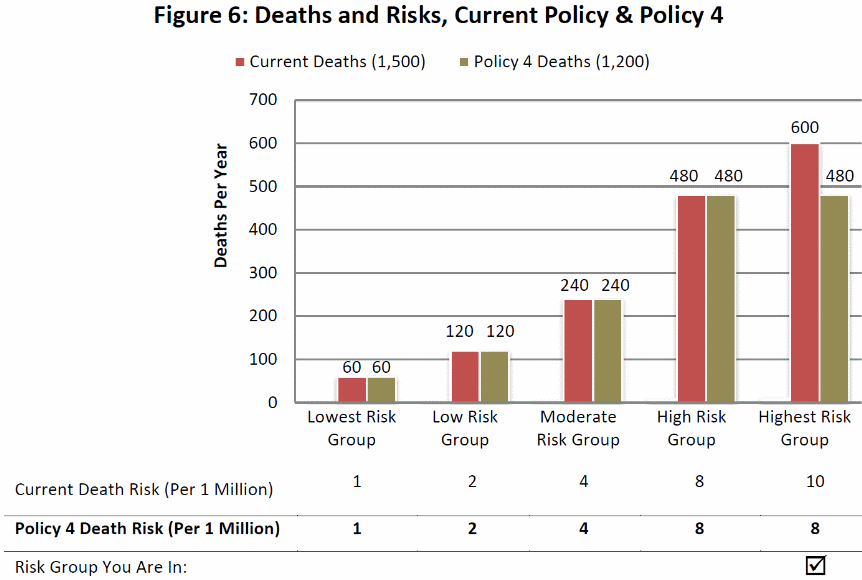
Policy 4. We would now like you to assume that, instead of being in the middle risk group, you and your family are in the highest risk group. Suppose a policy were put in place that would reduce risks only to your group—the highest risk group—by 20%, or, put another way, 120 deaths among the 60 million people. This is the same sized risk reduction that you were told about in Figure 3. This new policy is shown in Figure 6.
Q13.What would your risk of death be after the policy? ______________________________
Q14.Would you be willing to pay something for this risk reduction? Circle: Yes orNo
<If yes>Q15.How much would you be willing to pay? ___________________________
Q16. In the case of policy 4, we wanted to see if being in the highest rather than in the middle risk groupchanged your willingness to pay for the same reduction in deaths for your group (120) as in the policy 3 case. Did you notice this? Circle: Yes orNo
<If no>Q17. Would you change your WTP now that we have explained the situation?
Yes, my WTP would be larger for Q15 than for Q7c
Yes, my WTP would be smaller for Q15 than for Q7c
No, my WTP would be the same
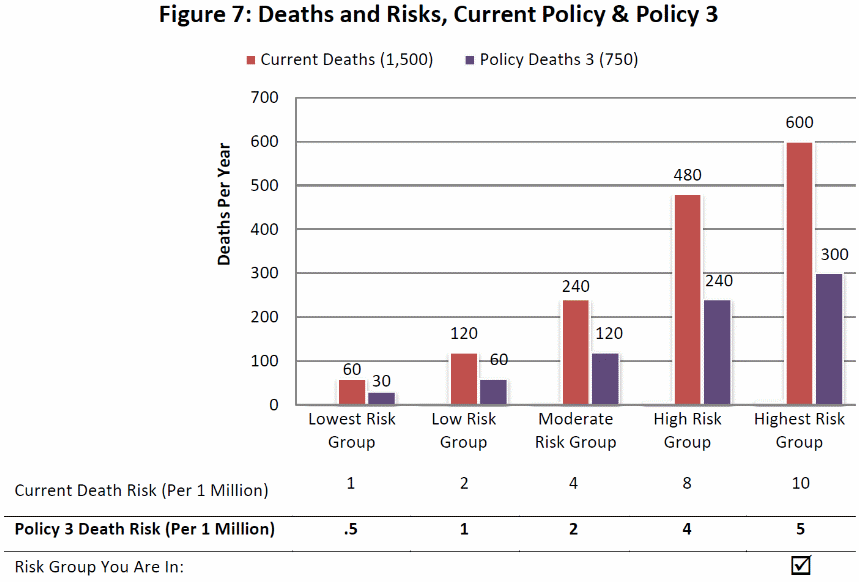
Policy 3 Again. Before we leave this section we’d like you to consider Policy 3 once again. This is the policy that will reduce risks by 50% in all 5 groups, saving a total of 750 lives. This policy is shown in Figure 7 below. Remember, you are now in the highest risk group instead of the moderate risk group.
Q18. Would you be willing to pay something for Policy 3? Circle: Yes orNo
<if yes>Q19. What would you be willing to pay? ________________________________
Examples of Questions on Willingness to Pay for Risk Reductions for others (for alternative policies)
Willingness to Pay for Health Risk Reductions to Others
Now we’d like you to consider some other environmental programs that would reduce cancer risks. Benzene is produced by oil refineries. Additional regulations are being considered for the oldest oil refineries in the United States in order to reduce benzene emissions. These regulations will not, however, affect Maryland,Virginia or the District of Columbia as there are no oil refineries in these states. So, people in these states (including you and your family) will NOT benefit directly from the policies.
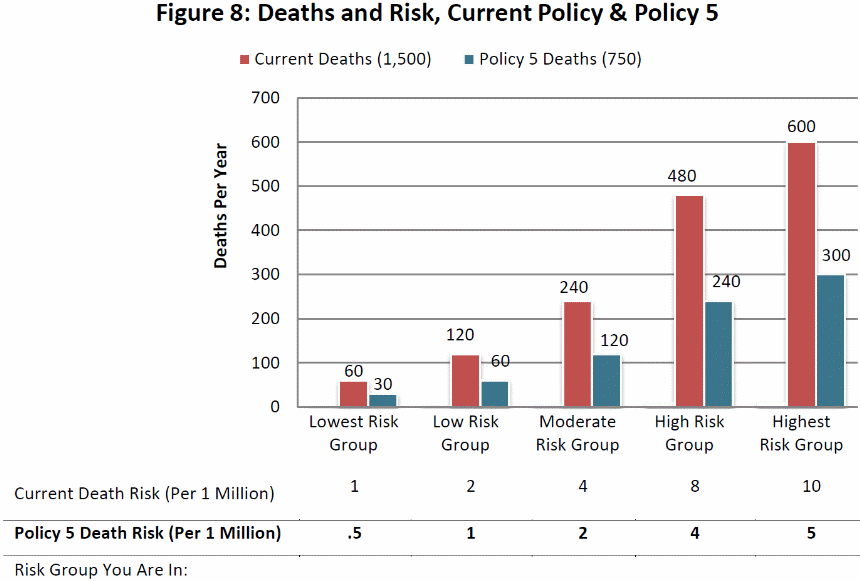
The number of current cancer deaths due to benzene remains the same as in Figure 2, shown again below.
Policy 5. Suppose that the oil refinery policy will reduce cancer deaths due to benzene exposure by 50% in all risk groups (i.e., it will reduce total deaths by 750, as shown in Figure 8). Remember, you are in none of the risk groups below.
Q20.Would you be willing to pay anything at all for the oil refinery pollution control program?
Circle: Yes orNo
<if yes>Q21.How much would you be willing to pay? __________________
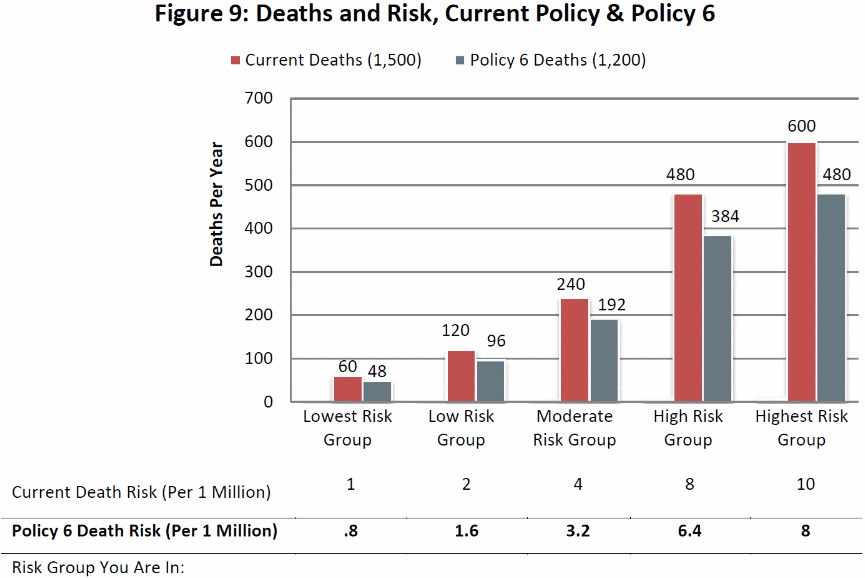
Policy 6. Suppose that the refinery program were to reduce risks by 20% in each group. This would save 300 lives, as shown in Figure 9.
Q22. How much would you be willing to pay for Policy 6? __________________________
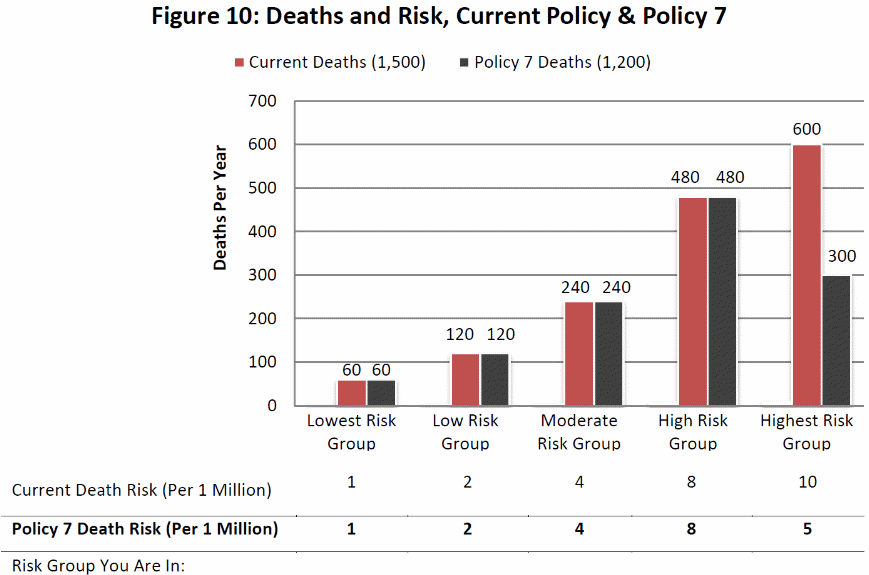
Policy 7. The last policy we would like you to consider would save the same number of lives as Policy 6 (300 lives) but would concentrate the lives saved in the highest risk group. This policy is shown in Figure 10 below:
Q23. How much would you be willing to pay for Policy 7? __________________________
Example Debriefing and Discussion Questions
What do you think determined your risk group in this questionnaire?
Prompts: Location, Sex, Income
Which other people did you think of as being in your risk group?
Prompts: People from your neighborhood? City?
What do you think about the graphs used in this questionnaire?
Prompts: Were they easy to understand? Were you comfortable with the color scheme?
How would you react if the risks associated with the policies were lower than the ones in the survey questions (for example, 1 in 10 million instead of 1 in a million)?
How did you feel about the length of the questions? (Or the “length of the questionnaire” as it is more fully developed in later focus groups and interviews.)
| File Type | application/vnd.openxmlformats-officedocument.wordprocessingml.document |
| Author | ferris |
| File Modified | 0000-00-00 |
| File Created | 2021-01-28 |
© 2026 OMB.report | Privacy Policy