Attachment 4 - Sample Design Considerations for the ORS
OMB Part B Attachment 4.docx
Occupational Requirements Survey (ORS)
Attachment 4 - Sample Design Considerations for the ORS
OMB: 1220-0188
Sample Design Considerations for the Occupational Requirements Survey
Bradley D. Rhein1, Chester H. Ponikowski1, and Erin McNulty1
1U.S.
Bureau
of Labor Statistics, 2 Massachusetts Ave., NE, Room 3160,
Washington, DC 20212
Abstract
The Bureau of Labor Statistics (BLS) is working with the Social Security Administration (SSA) to carry out a series of tests to determine the feasibility of using the National Compensation Survey (NCS) platform to accurately and reliably capture data that are relevant to the SSA's disability program. The proposed new Occupational Requirements Survey (ORS) is envisioned to be an establishment survey that collects information on the vocational and physical requirements of occupations in the U.S. economy, as well as the environmental conditions in which those occupations are performed. While NCS is also an establishment survey, sampled yearly from a national frame using probability proportionate to establishment employment size, it is unclear whether the NCS sample design will meet the goals of ORS. This paper discusses the advantages and disadvantages of integrating the sample design of ORS with the sample design of NCS, or whether an independent sample design for ORS would be more appropriate.
Key Words: sample design, sampling frame, establishment survey, sample selection, national survey
1. Introduction
The Social Security Administration (SSA) approached the Bureau of Labor Statistics (BLS), specifically the National Compensation Survey (NCS), because NCS collects data on work characteristics of occupations in the U.S. economy. SSA is interested in occupational information for use in their disability programs, including data on vocational requirements, physical demands, and environmental conditions in which the job tasks are performed. On April 18, 2012, SSA and BLS signed an interagency agreement, extended through FY 2014, to begin the process of attempting to collect new data on occupational information.
As a result, the Occupational Requirements Survey (ORS) was established as a test survey in October of 2012. The goal of ORS is to collect and eventually publish occupational information that will replace the outdated data currently used by SSA. The hope is that ORS will be able to build from the NCS platform in terms of survey design, systems, procedures, and experienced staff. However, in order to take full advantage of the NCS platform, an appropriate integrated sample design that meets the goals of each survey must be found. If such a sample design cannot be developed, an independent sample design for ORS will be considered.
In FY 2013, the BLS performed work to evaluate survey design options for ORS. While it is desirable for the ORS sample design to be integrated with NCS, it is unclear whether the NCS sample design will meet the goals of ORS. As a result, two types of sample designs were considered: independent and integrated. Therefore, ORS will be either a stand-alone survey with some overlap to the NCS, or a fully integrated survey where ORS is sampled, and then NCS is sub-sampled from the ORS sample. The ORS sample is expected to be larger than the NCS sample.
This paper will present some background information about ORS, an overview of the NCS sample design, an overview of ORS as it relates to NCS, attempts at integrating the NCS and ORS sample design, a possible independent ORS sample design, and a conclusion with some next steps.
2. Background Information on ORS
In addition to providing Social Security benefits to retirees and survivors, the Social Security Administration (SSA) administers two large disability programs which provide benefit payments to millions of beneficiaries each year. Final determinations about which citizens, or claimants, are eligible to receive benefits are based on a five step process that evaluates the capabilities of the worker, the requirements of their past work (prior job), and their ability to perform work for any job in the U.S. economy. If an applicant is denied disability benefits, SSA policy requires adjudicators to document the decision by citing examples of jobs the claimant can still perform despite their restrictions (such as limited ability to balance, stand, or carry objects)[1].
For over 50 years, the Social Security Administration has turned to the Department of Labor's Dictionary of Occupational Titles (DOT) [2] as its primary source of occupational information to process the disability claims [3]. SSA has incorporated many DOT conventions into their disability regulations. However, the DOT was last updated in its entirety in the late 1970’s, although a partial update was completed in 1991. Consequently, the SSA adjudicators who make the disability decisions must continue to refer to an increasingly outdated resource because it remains the most compatible with their statutory mandate and is the best source of available data at this time.
When an applicant is denied SSA benefits, SSA documents the decision by citing examples of jobs that the claimant can still perform. But some of the jobs in the American economy are not even represented in the DOT and other jobs, in fact many often cited jobs, don’t exist in large numbers in the American economy any longer. For example, a job that is often on the list for applicants is “envelope addressor.” If this job still exists in our economy, there aren’t too many of them and the positions are hard to find.
SSA has investigated numerous alternative data sources for the DOT such as adapting the Employment and Training Administration’s O*NET [4] (occupation information network), using the BLS Occupational Employment Survey [5] (OES), and developing their own survey. But they were not successful with any of those potential data sources and turned to the National Compensation Survey (NCS) at the Bureau of Labor Statistics.
3. Overview of the NCS Sample Design
The NCS provides comprehensive measures of employer costs for employee compensation, compensation trends, and incidence and provisions of employer-provided benefits.
The NCS produces several types of data with varying degrees of frequency as summarized below:
Employment Cost Index (ECI) data are released quarterly
Employer Costs for Employee Compensation (ECEC) data are released quarterly
Incidence and Provisions of Employer Provided Benefits data are released annually
Detailed Provisions for employer provided health insurance, defined benefit retirement plans, and defined contribution retirement plans are released once a year with a focus on one of these benefit areas each year
The NCS covers workers in private industry establishments and in State and local government for all 50 States and the District of Columbia. Establishments with one or more workers are included in the survey scope. Excluded from the survey are workers in the Federal Government, quasi-Federal agencies, the agricultural industry, and private households; the self-employed, volunteers and unpaid workers; and individuals who receive long-term disability compensation, work overseas, set their own pay (for example, proprietors, owners, major stockholders, and partners in unincorporated firms), or are paid token wages.
The BLS Quarterly Census of Employment and Wages (QCEW) serves as the sampling frame for the NCS sample. The QCEW is created from State Unemployment Insurance (UI) files of establishments, which are obtained through the cooperation of the individual state agencies (BLS Handbook of Methods, Chapter 5). This sampling frame includes many useful pieces of data for NCS, including monthly employment counts for each establishment, total quarterly wages for the establishment, establishment identification data, and contact information. The QCEW sampling frame includes all establishments, including units with monthly employment that are consistently positive, some with seasonal employment, newly formed businesses that may not yet have any employees, and establishments that have recently ceased operations. All establishments with one or more employees at any time during the year before the initiation of an NCS sample are considered to be in scope for the NCS.
Recently, the NCS has undergone a sample redesign. The redesigned NCS sample consists of three rotating replacement sample panels for private industry establishments, an additional sample panel for State and local government entities, and an additional panel for private industry firms in the aircraft manufacturing industry. Each of the sample panels is in the sample for at least three years before it is replaced by a new sample panel from the most current frame. Establishments in each sample panel are initiated over a 15-month time period. After initiation, data are updated quarterly for each selected establishment and occupation until the panel in which the establishment was selected is replaced. Estimates for all private industry outputs, except Detailed Provisions, use data from the entire set of three independent sample panels, plus an additional panel for aircraft manufacturing.
The redesigned NCS sample is selected using a two-stage stratified design with probability proportionate to employment size (PPS) sampling at each stage. The first stage of sample selection is a probability sample of establishments in 23 pre-determined geographic area strata and 5 aggregate industries. Within the five aggregate industries, there is an implicit stratification of 23 detailed industries where each detailed industry has been assigned a target percentage of a total sample. Target percentages were assigned to meet the publication goals of NCS. To meet these goals, industries such as education, hospitals, nursing homes, and aerospace were over-sampled. The second stage is a PPS selection of occupations, called quotes, within the establishments. A more detailed description of the new NCS sample design is given in Ferguson, et al. (2011), and a description of the estimates produced and the estimate methodology is given in Chapter 8 of BLS Handbook of Methods.
4. Overview of ORS, as related to NCS
The objective of the Occupational Requirements Survey (ORS) is to provide data on specific vocational preparation needed for average job performance, physical demands of a job, and environmental conditions that an employee is subject to work under for each occupation in the current US economy.
The ORS population of interest is assumed to be the same as for the National Compensation Survey; that is, it covers workers in State and local government and private industry establishments in the 50 States and the District of Columbia. Establishments with one or more workers are included in the survey scope. Excluded from the survey are workers in the Federal Government, quasi-Federal agencies, the agricultural industry, and private households; the self-employed, volunteers and unpaid workers. Also excluded are individuals who receive long-term disability compensation, work overseas, set their own pay (for example, proprietors, owners, major stockholders, and partners in unincorporated firms), or are paid token wages.
Also, it is assumed that ORS will be an ongoing survey that will produce estimates annually for individual occupations, but may not have a large enough sample size to produce data for all occupations. It is desirable for ORS to have wage and the occupational characteristics data that are collected by the NCS program. Sample designs that integrate the two surveys are preferable over those that do not as long as joint collection is done without impacting the quality of the NCS outputs. Feasibility tests were conducted in 2013, and are continuing in 2014, in order to assess the collection of data for both surveys from the same establishment.
The Social Security Administration also provided a list of the occupations most frequently held by claimants prior to applying for disability – 70% of all claimants previously held at least one of the jobs on this list. Each of these occupations is classified by a DOT code, and there are more than 12,000 unique DOT codes. This list of occupations will be referred to as SSA’s Occupations of Interest.
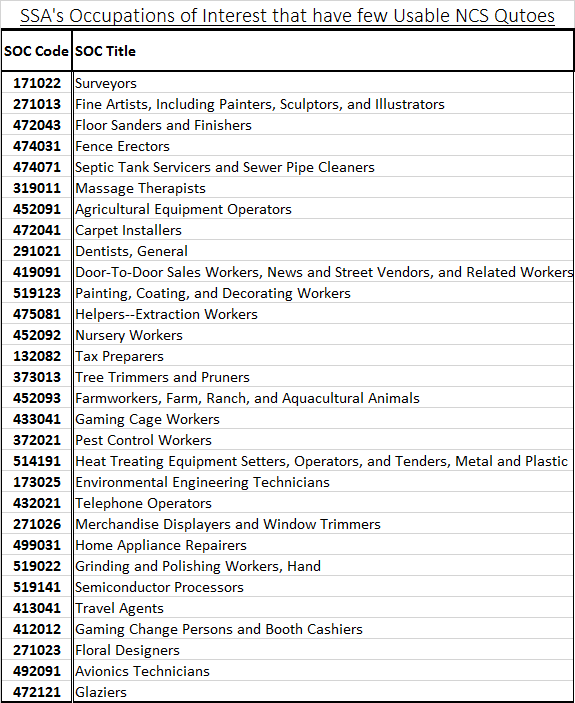
Occupations will be classified using Standard Occupational Classification codes (SOC) [6]. ORS will attempt to capture 8-digit SOC codes as provided by the Occupational Information Network (O*Net) [4] - a program that provides occupational data and is sponsored by the US Department of Labor under the Employment and Training Administration. NCS currently uses 6-digit SOC codes, capturing 764 of the 798 in-scope occupations categorized by these 6-digit SOC codes. The following list shows SSA’s Occupations of Interest that are found infrequently in NCS.
Table 1
Rare Occupations Sampled in NCS
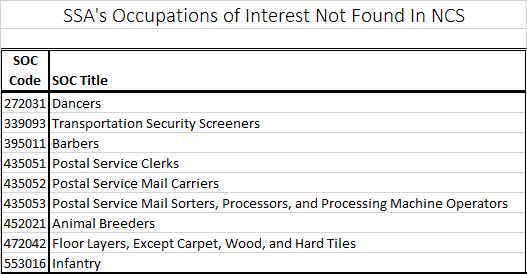
The next table of occupations represent the SSA Occupations of Interest that cannot be found in the current NCS sample. SSA requests data on all occupations that frequently appear in the fourth stage of the disability claims process – occupations listed in SSA Occupations of Interest. Five of these nine occupations are federal workers (Postal workers, infantry, and Transportation Security Screeners) and fall outside of the NCS scope. Dancers, barbers, animal breeders, and floor layers have a potential to be selected in NCS, but the chance of selection is very low. Some of these occupations are known to be self-employed; self-employed workers are not considered in scope for NCS.
Table 2
Another area of interest is size class. Certain occupations are likely to only appear in establishments of a particular employment size. One occupation that is found primarily in small establishments (less than 5 employees) is the Construction Worker 1: Floor Sanders and Finishers. Rare occupations like this one have a low probability of being included in the NCS sample. At the other end of the spectrum, flight attendants are almost always found in establishments with more than 250 employees. After defining five size classes – 1 to 4 employees, 5 to 19 employees, 20 to 49 employees, 50 to 249 employees, and more than 250 employees – it was found that 244 occupations could be found only in one size class. Other occupations, such as car mechanics, seem to fall into establishments of any size.
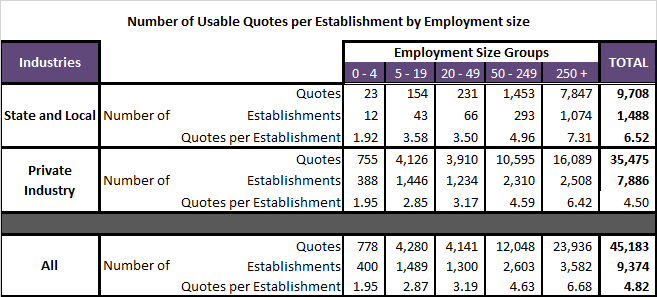
The table below shows the distribution of NCS establishments and quotes by size class and ownership. More than half of the sampled establishments fall into a size class where employment is greater than 50 employees. About 2% of the quotes collected in NCS appear in establishments with less than 5 employees. Four percent of all establishments in the NCS sample have an employment size of less than 5 employees. Most quotes and establishments fall into larger size classes under the NCS sample design.
Table 3
One of the main goals of NCS is to publish according to industry classifications. Fortunately, industry codes, classified by the North American Industry Classification System (NAICS) [7], appear on the sampling frame. ORS, however, aims to publish on the basis of occupation, and occupational codes are not found on the NCS sampling frame. Locating occupations within industries has proved to be difficult work. Hundreds of occupations, defined at the 8-digit SOC level, can be found in all NCS detailed industries, and many occupations exist in several industries. For now ORS will use industry as a proxy for locating occupations, sampling jobs by a probability selection based on occupational employment. More research will be needed if these methods do not supply a sufficient number of occupational observations that are needed to publish ORS estimates.
5. Integrating the ORS and NCS Sample Designs
For reasons stated in the introduction, it makes sense to consider integrating the sampling and collection of both surveys. NCS has already proved successful at collecting about 95% of the 6-digit SOC occupations that are in scope for ORS. While the NCS sample size is around 11,400 establishments collected over three years, the ORS sample will likely be at least 30,000 establishments collected in at least 3 years. So an integrated sample design would imply that NCS would be a subsample of ORS.
An integrated sample design would provide a few advantages. NCS resources, staff, and systems could all be shared more efficiently and cost-effectively. However, integrating the surveys would increase respondent burden and may compromise the goals of one or both surveys. Increases in respondent burden could lead to decreases in data quality for one or both surveys. Since the NCS is the source of the Employment Cost Index (ECI), a principle economic indicator, any change to the NCS will be monitored closely for its effect on response rates and data quality.
The search for a sample design that will meet the goals of both surveys began with identifying a manageable list of sample designs. Once listed, each one was tested on the basis of average sample counts and average employment (compared to the sampling frame) by industry and area. NCS has specific detailed industry targets for establishment counts, so verifying that these targets are met is a priority. Also, NCS weighted employment should reflect the employment on the sample frame. For ORS, an ideal sample design would provide sampled establishments that contain a maximum number of unique occupations and enough total unique occupations to publish national data at the 8-digit SOC level.
There were three attempts at integrating the two surveys into one sample design. All attempts at integration were evaluated by comparing the current sample design of NCS to an integrated sample design on the basis of average sample counts and employment by NCS industry and area. Once a sample design resulted in NCS industry distributions that were found to be satisfactory, the design would be assessed on whether the goals of ORS were also met. All sample designs were tested by running 150 simulated samples. The sample size for ORS was assumed to be 25,500 establishments for private industry. NCS kept its usual private industry sample size of 9,804 establishments. Unless noted, all sample designs assumed a 3-year rotation and NCS allocations by area and aggregate industry. All designs sample ORS initially before selecting NCS as a subsample.
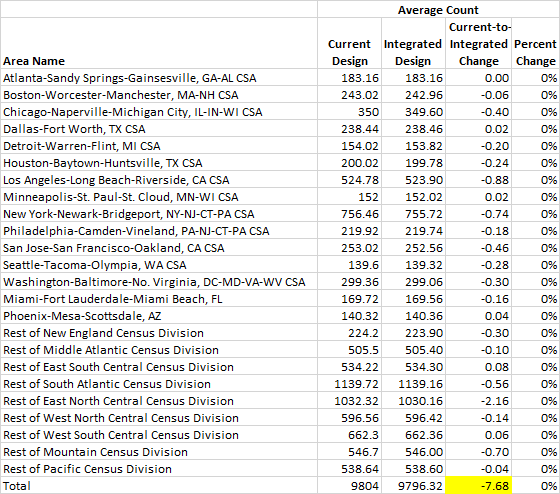
For the first attempt at integration, the ORS sample was allocated and sampled proportional to frame employment, disregarding the implicit NCS detailed industry targets. The ORS sample then served as a frame from which NCS would be subsampled. NCS was then subsampled using current NCS sampling procedures. The following table shows the resulting NCS area distributions, comparing the current NCS design with the first attempt at an integrated design. Little difference was found between the current NCS design and the proposed integrated design. The overall sample size did not quite reach the 9,804 establishments usually sampled in NCS. Area distributions for all attempted integrated sample designs were acceptable for NCS.
Table 4
Simulation #1: Comparison of NCS Area Distributions, by Average Establishment Count
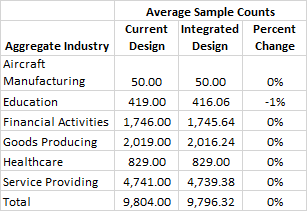
The following table shows the resulting aggregate industry distributions for NCS, comparing the current NCS design with the first attempt at an integrated design. As another positive result, there was little difference between the two designs at an aggregate industry level. All attempted integrated sample designs had this result; issues tended to appear at the detailed industry level.
Table 5
Simulation #1: Comparison of NCS Aggregate Industry Distributions, by Average Establishment Count
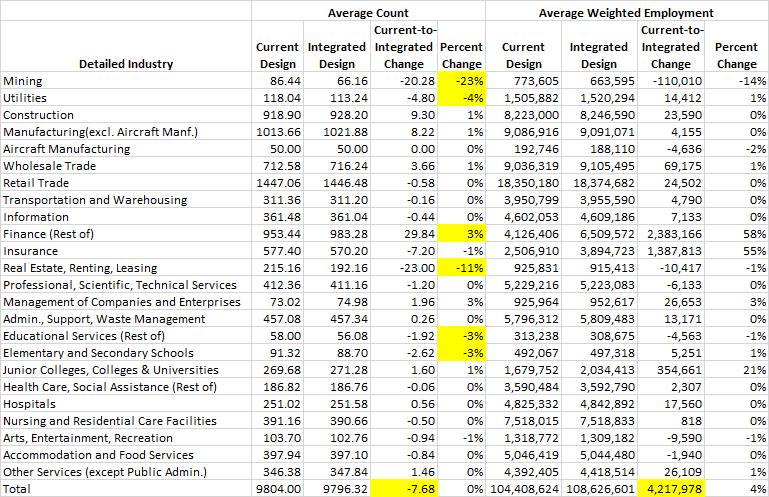
While there were no significant issues with the sampling at the area or aggregate industry level, the detailed industry sample sizes caused some concern. The table below highlights where some of the NCS targets were missed. Average sample counts for mining, utilities, real estate, finance, elementary and secondary schools, and rest of educational services differed from the NCS targets by more than one percent. Also, not only was the overall NCS sample count short of 9,804, the total weighted employment for the integrated sample design was more than 4 million employees too large. This sample design does not meet the goals of NCS.
Table 6
Simulation #1: Comparison of NCS Detailed Industry Distributions, by Average Establishment Count
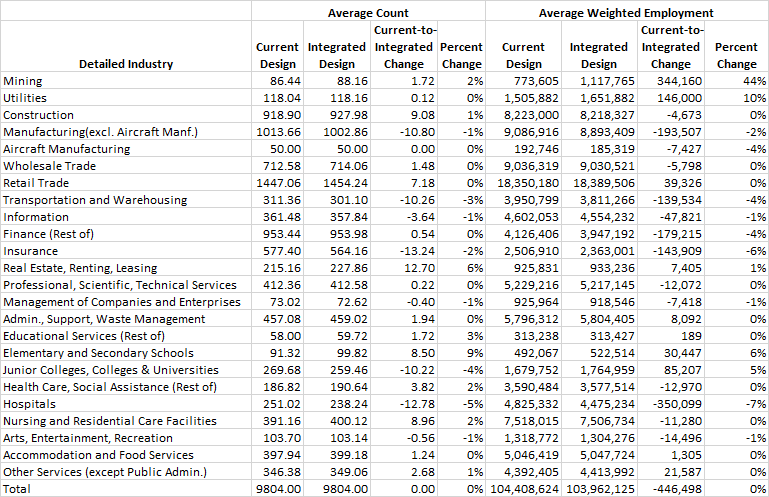
As a second attempt at sample design, both ORS and NCS were sampled with the current NCS procedures. After sampling ORS from the sampling frame, NCS was subsampled from the ORS sample. Again, there were no issues with the area or aggregate industry distributions, and the NCS sample size of 9,804 was reached.
The following table displays the detailed industry distributions, comparing the current NCS design to the second attempt at integrated sample design. Though there are some differences among the detailed industry counts, these differences are less severe than the ones found using the first attempt at sample design. As a result, this sample is acceptable for NCS. However, given the NCS detailed industry targets aimed at oversampling certain industries, this sample design is not very efficient for ORS, as too many sample units would be allocated to schools and hospitals.
Table 7
Simulation #2: Comparison of NCS Detailed Industry Distributions, by Average Establishment Count
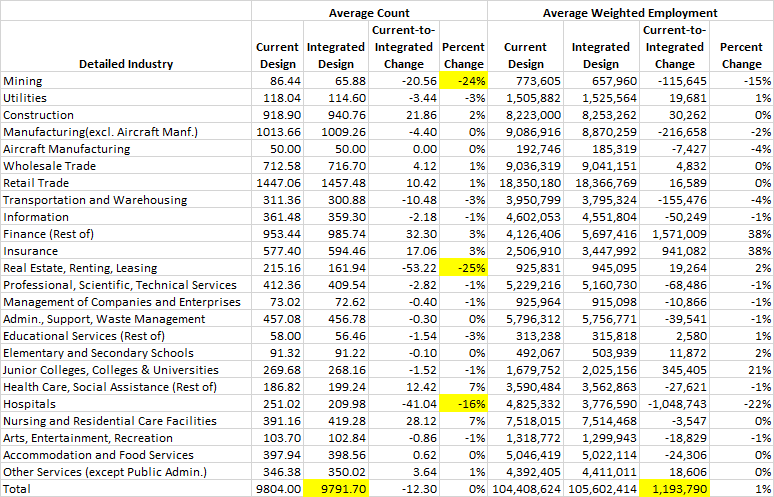
For a third attempt at an integrated sample design, ORS was allocated and sampled proportional to the frame employment, but adjusted so that the nationwide projected detailed industry counts would be no smaller than the targeted NCS sample counts for each detailed industry. NCS was then selected as a subsample using current NCS sampling methods. Once again, there were no issues among the area and aggregate industry distributions. However, the distribution of units among the detailed industries was not ideal for NCS. The table below shows that mining, real estate, and hospitals all received significantly less sample than the NCS targets require. Also, the total NCS sample size of 9,804 was not met, and the total weighted employment exceeded the total frame employment by 1.2 million employees.
Table 8
Simulation #3: Comparison of NCS Detailed Industry Distributions, by Average Establishment Count
None of these three initial integrated designs were able to satisfy both the needs of ORS and NCS simultaneously. The search for an integrated sample design continues as of the writing of this paper.
6. ORS with an Independent Sample Design
Using an independent sample design, ORS could be customized to meet the needs of the survey. The sample design of NCS would be left unchanged. Since the sampling frame does not contain occupational data, ORS would still likely take advantage of industry classifications. As mentioned before, there is no easy way to ensure that certain occupations appear in a sample that is stratified by industry.
Any independent ORS sample will be evaluated by identifying the establishments that appear in both NCS and ORS surveys. Establishments that appear in both surveys, called overlaps, would experience increased individual respondent burden, which could have a negative effect on one or both surveys. Overall individual respondent burden for many businesses would decrease with an independent design, compared with an integrated design, as many fewer establishments would appear in, and be collected for, both surveys. However, overall burden across all establishments in the nation will increase with an independent design because with few overlaps, the sample size of each survey will be almost entirely collected.
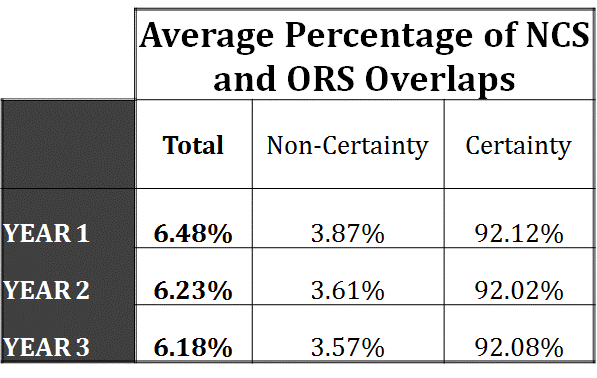
One option is to select ORS with PPS where size is the establishment employment, stratifying by area and the NCS aggregate industry definitions. This sample design yielded an average overlap of 6% of the NCS sample – an average overlap of about 92% of the NCS certainty units and slightly less than 4% of the NCS non-certainty units. A six percent overlap equates to about 200 NCS establishments per year, and about 75 of those 200 would be certainty units that are sampled every year. The following table shows the average percentage of overlaps in the NCS sample for each of the 3 years in the sample rotation.
Table 9
There may be other stratifications that would work better for ORS. Industry strata could be re-defined to improve the mix of occupations. Stratifying by size class and using a targeted sample allocation approach may improve the sampling of small establishments that may employ a particular occupation. The search for an independent sample design continues as of the writing of this paper.
7. Conclusion and Future Research
There are many things to consider when choosing a sample design for the Occupational Requirements Survey. Cost, individual respondent burden, overall respondent burden, response rates, data quality, the effect on the ECI, and whether the surveys could be integrated are all factors. At this point, no integrated sample design that has been studied fully meets the goals of both surveys. Further research is continuing in an attempt to find an appropriate integrated sample design. While an independent sample design would more easily allow the goals of each survey to be met, it would forfeit many efficiencies gained by integrating the two surveys.
Since a pre-production test of ORS is scheduled to begin in the summer of 2014, both an integrated and independent sample design must be determined by the end of April, 2014. The research continues.
References
[1] See and Social Security Administration, Occupational Information System Project
[2] See U.S. Department of Labor, Dictionary of Occupational Titles
[3] See Occupational Information Development Advisory Panel, 2010
[4] See O*Net Online, http://www.onetonline.org/
[5] See Occupational Employment Statistics website, http://www.bls.gov/oes/
[6] See Standard Occupational Classification website, http://www.bls.gov/soc/
[7] See North American Industry Classification System website, http://www.census.gov/eos/www/naics/
Ferguson, Gwyn R., Ponikowski, Chester, and Coleman, Joan (2010), “Evaluating Sample Design Issues in the National Compensation Survey”, 2010 Proceedings of the Section on Survey Research Methods, Alexandria, VA: American Statistical Association, http://www.bls.gov/osmr/abstract/st/st100220.htm.
Ferguson, Gwyn R., Coleman, Joan, Ponikowski, Chester H. (2011), “Update on the Evaluation of Sample Design Issues in the National Compensation Survey”, 2011 Proceedings of the Section on Survey Research Methods, Alexandria, VA: American Statistical Association. http://www.bls.gov/osmr/abstract/st/st110230.htm.
Ferguson, Gwyn R. (2013), “Testing the Collection of Occupational Requirements Data”, 2013 Proceedings of the Section on Survey Research Methods, Alexandria, VA: American Statistical Association.
Occupational Information Development Advisory Panel, “Findings Report: A Review of the National Academy of Sciences Report - A Database for a Changing Economy: Review of the Occupational Information Network (O*NET)”, June 28, 2010, Report to the Commissioner of Social Security,
Social Security Administration, Occupational Information System Project, http://www.ssa.gov/disabilityresearch/occupational_info_systems.html.
U.S. Bureau of Labor Statistics (2008) BLS Handbook of Methods, National Compensation Measures, Chapter 8. http://www.bls.gov/opub/hom/pdf/homch8.pdf
U.S. Department of Labor, Employment and Training Administration (1991), “Dictionary of Occupational Titles, Fourth Edition, Revised 1991”.
Note: Any opinions expressed in this paper are those of the author(s) and do not constitute policy of the Bureau of Labor Statistics.
| File Type | application/vnd.openxmlformats-officedocument.wordprocessingml.document |
| Author | rhein_b |
| File Modified | 0000-00-00 |
| File Created | 2021-01-27 |
© 2026 OMB.report | Privacy Policy