Common Metrics Staff Report (2014)
922 -Metrics Staff Report ISSUED 8-26-14.docx
FERC-922, [AD14-15] Performance Metrics for ISOs, RTOs, and Utilities in Regions Outside ISOs and RTOs
Common Metrics Staff Report (2014)
OMB: 1902-0262
COMMON METRICS
Commission Staff Report

Federal Energy Regulatory Commission
August 26, 2014
This report does not necessarily reflect the views of the Commission, its Chairman, or individual Commissioners, and it is not binding on the Commission
Table of Contents
I. Metrics Initiative Overview - 4 -
II. Common Metrics Report Summary - 5 -
1. NERC Reliability Standards Compliance - 8 -
b. Data Review and Metrics Assessment - 9 -
2. Dispatch Reliability - 11 -
b. Data Review and Metrics Assessment - 11 -
3. Load Forecast Accuracy - 16 -
b. Data Review and Metrics Assessment - 16 -
4. Wind Forecasting Accuracy - 18 -
b. Data Review and Metrics Assessment - 18 -
5. Unscheduled Flows Metric - 19 -
b. Data Review and Metrics Assessment - 20 -
6. Transmission Outage Coordination - 22 -
b. Data Review and Metrics Assessment - 22 -
7. Long-Term Reliability Planning – Transmission - 25 -
b. Data Review and Metrics Assessment - 25 -
8. Long-Term Reliability Planning – Resources - 28 -
b. Data Review and Metrics Assessment - 29 -
9. Interconnection and Transmission Process Metrics - 32 -
b. Data Review and Metrics Assessment - 33 -
10. Special Protection Systems - 37 -
b. Data Review and Metrics Assessment - 37 -
B. Systems Operations Performance Metrics - 39 -
b. Data Review and Metrics Assessment - 39 -
2. Resource Availability - 41 -
b. Data Review and Metrics Assessment - 41 -
b. Data Review and Metrics Assessment - 43 -
A. Other Metrics Specific to ISO and RTO Performance - 46 -
1. Load Forecasting Accuracy Metrics - 46 -
2. Transmission Outage Metrics - 48 -
3. Long-Term Reliability Planning – Resources - 50 -
5. Generator Net Revenue - 56 -
6. Percentage of Megawatt Hours Mitigated - 57 -
7. Market Pricing Metrics - 58 -
8. Energy Market Price Convergence - 61 -
9. Congestion Management Metrics - 61 -
10. Resource Availability Metric - 63 -
12. Administrative Costs Metrics - 66 -
13. Customer Satisfaction Metric - 69 -
14. Billing Controls Metric - 70 -
B. Other Metrics Specific To Regions Outside ISO and RTO Markets - 71 -
1. Outages With Less Than Two Days’ Notice - 71 -
3. Transmission Access/Transmission Service Requests Denials - 74 -
4. Demand Response and Renewables Integration Discussions - 75 -
5. Congestion Management - 76 -
Appendix A: Common Metrics
Appendix B: List of Participants
Federal Energy Regulatory Commission Staff Report
Common Metrics
The primary purpose of the Common Metrics Report is to provide a platform for review of Independent System Operator (ISO), Regional Transmission Organization (RTO) and utility performance. The Common Metrics Report provides two components for a performance review, as follows: (1) an analysis of the metrics data to confirm that the data provided by ISOs, RTOs and utilities in regions outside ISO and RTO markets are consistent with the definitions of the common metrics; and (2) an evaluation and confirmation that the common metrics are measuring the same activities and have the same meaning across the industry.
This report represents the culmination of five years of effort by ISOs, RTOs and utilities in regions outside ISO and RTO markets to develop performance metrics in a Commission Staff-led Metrics Initiative. These entities are to be commended for their contributions to the Metrics Initiative. Their contributions, ranging from submitting comprehensive performance assessments, to providing technical expertise in developing the common metrics and discussing issues of concern to stakeholders in informal discussions, have played a significant role in the evolution of these measures into best practices in the industry, to the benefit of consumers and other stakeholders.
The analysis framework discussed in this report consists of 31 common metrics that measure performance for the six ISOs and RTOs and five utilities in regions outside ISO and RTO markets for the 2006-2010 period. While this information is appropriate as a starting point for reviewing performance, further analysis is needed. For example, additional data will need to be collected to ensure that the performance review reflects the most recent information available and to provide additional data points to ensure that performance is not biased by one-time events. Ideally, additional utilities in regions outside ISO and RTO markets would provide data, thereby providing a more comprehensive basis for performance reviews.
In order to undertake further data collection, approval from the Office of Management and Budget (OMB) is required. Therefore, the next steps will be as follows:
The Commission will request approval for further data collection on performance metrics for the 2008-2012 and 2010-2014 periods from OMB.
Upon approval by OMB for additional data collection, the Commission will issue a notice requesting that the ISOs, RTOs and participating utilities provide information on a schedule to be specified in the notice.
As discussed more fully in the Common Metrics Report Summary, data collection will be requested on 30 of the 31 metrics discussed in this report. The transmission loading relief (TLR) and unscheduled flow metric will not be included in the data collection request. After the ISOs, RTOs and utilities provide their performance assessments for the 2008-2012 and 2010-2014 periods, the Commission will issue reports reviewing performance.
This report assesses which of the 31 metrics identified as candidates to be common metrics would be suitable as common metrics for evaluating the performance of ISOs, RTOs and utilities in regions outside ISO and RTO markets and provides the first comprehensive review of performance metrics data.
ISOs, RTOs and utilities1 submitted extensive performance metrics data, thereby providing the basis for a comprehensive performance review over the 2006–2010 review period. A five-year review period was chosen to ensure that performance evaluations would be based on long-term trends and not on short-term aberrations.
Significant features of the report are as follows:
Commission Staff identified 31 metrics as candidates to be common metrics. After reviewing the ISO, RTO and utility reports, all but one of these metrics were determined to meet the criteria for common metrics.2
The one metric that is not a suitable common metric is the metric for TLRs and unscheduled flow events. As discussed below, TLRs or unscheduled flow events are not used universally in the industry and the data might not be a reliable indicator of their role in managing reliability. As a possible alternative, a more suitable common metric might be a measure of the megawatts managed by all manual actions as a percentage of total megawatts subject to congestion management. Such a measure would encompass the full range of manual procedures used by ISOs, RTOs and utilities and it would not count TLRs that are not implemented.
The other common metrics have a common definition across ISOs, RTOs and utilities that apply to the same activities.
For example, a number of the reliability metrics are based on North American Electric Reliability Corporation (NERC) reliability standards that apply to all transmission providers. Accordingly, these metrics are suitable as common metrics since they are based on common definitions that are well understood by all transmission providers and have been reported on by these entities for a number of years.
As another example, inasmuch as ISOs, RTOs and utilities all perform interconnection and transmission services, the transmission planning metrics apply to activities that are common to ISOs, RTOs and utilities in regions outside ISO and RTO markets.
The common metrics discussed in this report represent the culmination of an effort spanning over five years to develop metrics that measure the performance of ISOs, RTOs and utilities in regions outside ISO and RTO markets with respect to reliability, operations and market performance. The common metrics and the metrics information provided in this report were developed in a voluntary and collaborative process led by Commission Staff. Participants in the process included ISOs, RTOs, utilities, state regulators, consumer advocates and various industry stakeholders, such as developers of renewable resources.1
As detailed in FERC’s FY 2009–2014 Strategic Plan, the objectives of the Metrics Initiative are as follows: (1) develop appropriate operational and financial metrics for ISOs/RTOs; (2) explore and develop appropriate operational and financial metrics for utilities outside ISO and RTO regions; (3) establish appropriate common metrics between ISOs and RTOs and utilities outside ISO and RTO regions; (4) monitor implementation and performance; and (5) evaluate performance and seek changes as necessary. The first objective was completed with the submission of a Report to Congress on performance metrics for ISOs and RTOs.2 The second objective was completed with the issuance of a Commission Staff Report on performance metrics in regions outside ISOs and RTOs.3 This report satisfies the requirements of the third and fourth objectives and takes the first step in meeting the requirements of the fifth objective.
The ISOs and RTOs have submitted two metrics reports. The first report, submitted on December 6, 2010, provided information on performance metrics for the 2005–2009 period. The second report, submitted on August 31, 2011, provided information on performance metrics for the 2006–2010 period. The ISOs and RTOs that submitted reports are as follows:4
ISO New England Inc. (ISO-NE)
New York Independent System Operator, Inc. (NYISO)
PJM Interconnection, L.L.C. (PJM)
Midcontinent Independent System Operator, Inc. (MISO)
Southwest Power Pool, Inc. (SPP)
California Independent System Operator Corporation (CAISO)
Utilities in regions outside ISO and RTO markets provided information on performance metrics for the 2006 – 2010 period in reports submitted in the first quarter of 2013. The utilities that submitted reports are as follows:
Duke Energy Corporation5 (Duke)
Southern Company (Southern)
Louisville Gas and Electric Company and Kentucky Utilities Company (LG&E/KU)
PacifiCorp6
Arizona Public Service Company (APS)
The process for developing common metrics started with the development of metrics for regions outside ISO and RTO markets. During this stage, Commission Staff, with the collaboration of utility participants and industry stakeholders, refined the list of 57 ISO and RTO metrics to a list of metrics that were also applicable to regions outside ISO and RTO markets. This list of common metrics, applicable to ISOs, RTOs and utilities outside of ISO and RTO markets, are the metrics proposed to be common metrics and to be discussed in this report.
To determine if these common metrics are, in fact, appropriate as common metrics, this report first confirms that the definition of each common metric is the same for ISOs, RTOs and utilities in regions outside these markets, and then evaluates the metrics data for each metric to determine if it is measuring the same activities and has the same meaning across all entities. To the extent that a metric is determined not to be suitable as a common metric, recommendations are made to revise the metric so that it can be a common metric. Finally, the metrics data in this report provide the first comprehensive review of performance based on the metrics data submitted by ISOs, RTOs and utilities outside these markets for the 2006–2010 period.
The common metrics measure reliability and systems operations performance. The reliability metrics, evaluated first, were chosen to measure the reliability of day-to-day operations using metrics such as compliance with national and regional reliability standards, real-time balance of supply and demand, and forecasting and special protection schemes. Reliability metrics were also chosen to measure long-term reliability using metrics such as long-term transmission planning and resource planning. The systems operations metrics were chosen to measure resource availability performance, resource costs and diversity.
This metric measures the number of violations of NERC reliability standards,1 provides information on how these violations were reported (self-reported or reported in audits), and indicates the severity of the violations. The metric also details compliance with operating reserve standards and unserved energy (or load shedding) caused by violations.
The reliability standards metrics2 measure both the significance of the violations and the effectiveness of self-reporting procedures in identifying violations in a timely manner. Of the twenty-nine violations shown on the table below, seventeen (more than half) were self-reported. Per NERC’s Violation Security Level Matrix, three incidents were rated severe, one was rated high and three were rated medium. All ISOs, RTOs and utilities were in compliance with operating reserve standards. No ISO, RTO or utility outside these markets reported unserved energy resulting from violations.
2006 – 2010 Reliability Standards Violations
Entity
|
Violations Made Public By NERC or FERC |
Violations Made Public By NERC Audits |
Violations Self Reported |
Severity Level of Public and Reported Violations |
CAISO |
0 |
0 |
1 |
Severity information not provided |
ISO-NE |
1 |
0 |
0 |
Severity information not provided |
MISO |
0 |
0 |
1 |
Severity information not provided |
NYISO |
0 |
0 |
0 |
|
PJM |
0 |
0 |
0 |
|
SPP |
0 |
0 |
0 |
|
APS |
5 |
4 |
1 |
1 severe |
Duke |
0 |
0 |
0 |
|
LG&E/KU |
0 |
0 |
1 |
1 medium |
PacifiCorp |
0 |
2 |
13 |
2 severe; 1 high; 2 medium |
Southern |
0 |
0 |
0 |
|
Note
Information represents data provided by ISOs, RTOs and utilities. FERC made public two additional violations in SPP in 2007 after these reports were submitted.
The reliability standards violations and operating reserve standards data submitted and discussion of the data by the ISOs, RTOs and utilities indicate that these metrics measure the same activities and have the same meaning for ISOs, RTOs and utilities in regions outside ISO and RTO markets, and therefore are suitable as common metrics. Such an outcome is expected for these metrics that are based on reliability standards developed for the entire electric industry by NERC. The data submitted and discussion of the data by the ISOs, RTOs and utilities for the unserved energy metric indicate that it is measuring the same activity and has the same meaning for ISOs, RTOs and utilities in regions outside ISO and RTO markets, and therefore is suitable as a common metric.
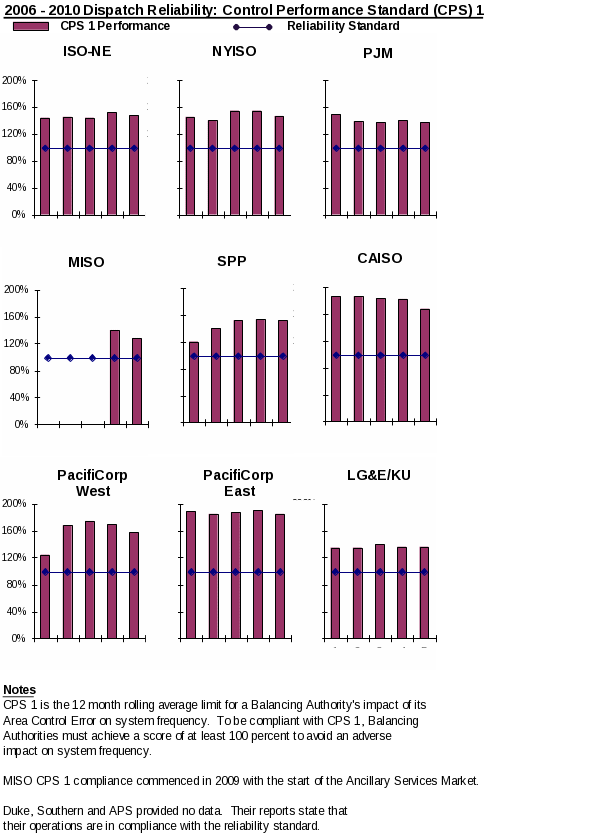
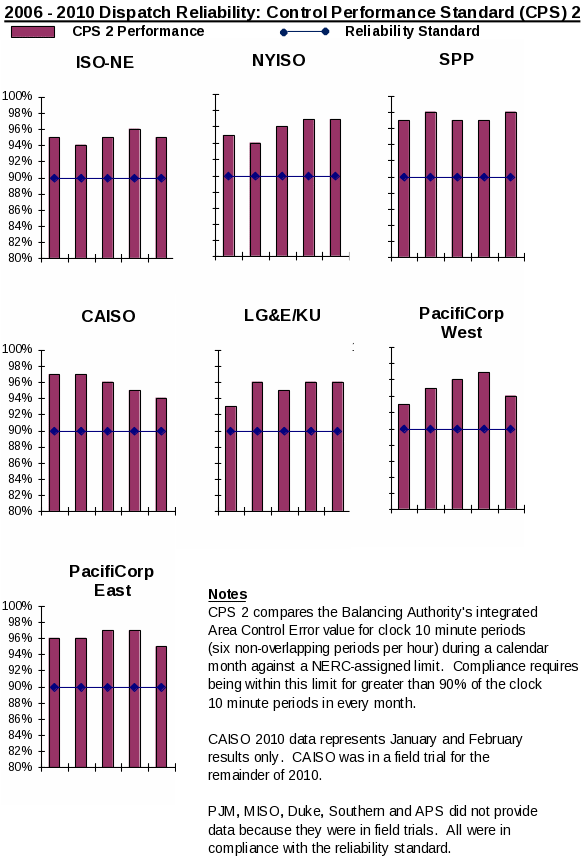
Dispatch reliability is measured by three metrics as follows: (1) Balancing Authority Area Control Error Limit or Control Performance Standard 1 and Control Performance Standard 2.3 These metrics measure the performance of dispatch operations in maintaining steady-state frequency within defined limits by balancing power demand and supply in real time; (2) the number of transmission load relief events (TLRs) of severity level 3 and higher called by the ISO, RTO or incumbent transmission provider or, for Western Electricity Coordinating Council (WECC) entities, unscheduled flow procedures equivalent to the TLR at a severity level 3 and higher, as measures of how often ISO, RTOs or transmission providers must resort to manual actions to redirect physical flows; and (3) Energy Management System Availability for performing real-time monitoring and security analysis functions, reported as a percentage of minutes of operational availability each year.
As shown on the Control Performance Standards charts below, all reporting ISOs, RTOs and utilities were in compliance with NERC reliability standards for managing supply and demand in real-time. Similar to the reliability standards metrics, the Control Performance Standard metrics are based on reliability standards developed for the entire electric industry by NERC. Therefore, the data submitted and discussion of the data by the ISOs, RTOs and utilities indicates that the Control Performance Standard metrics measure the same activities and have the same meaning across all entities, and therefore are suitable to be common metrics.
The data on the second metric, TLRs and unscheduled flow events, show a wide range of results as reflected in the table below, from a few events per year on certain utility systems to thousands of events per year on some of the ISO and RTO transmission systems. The meaning of this information should be interpreted with caution, particularly in interpreting the extent to which this data measures performance. For example, SPP’s operating protocols require that it issue TLRs in parallel with congestion management so that increases in TLRs reflect increased use of market redispatch.4 Accordingly, increases in TLRs in SPP are not necessarily an indication of increased use of manual redispatch.
TLR or Unscheduled Flow Events: Severity Level 3 or Higher
Entity |
2006 |
2007 |
2008 |
2009 |
2010 |
CAISO |
No Data |
0 |
200 |
30 |
50 |
ISO-NE |
No Data |
No Data |
No Data |
No Data |
No Data |
MISO |
750 |
750 |
550 |
300 |
200 |
NYISO |
0 |
0 |
0 |
200 |
150 |
PJM |
200 |
100 |
250 |
200 |
150 |
SPP |
500 |
1700 |
1700 |
1900 |
2450 |
APS |
16 |
15 |
10 |
8 |
9 |
Duke |
0.5 |
19.8 |
0 |
1.3 |
2.6 |
LG&E/KU |
No Data |
42 |
18 |
16 |
40 |
PacifiCorp |
8 |
122 |
281 |
25 |
54 |
Southern |
No Data |
No Data |
No Data |
No Data |
No Data |
Notes
Bold italics indicate TLR hours, as opposed to events, reported by Duke. ISO-NE and Southern did not report TLRs. LG&E/KU data includes events for all severity levels. LG&E/KU indicate that 75 percent of all events were severity level 3 and higher. LG&E/KU did not report information on severity level 3 and higher by year.
The data submitted on TLR and unscheduled flow events indicate that this metric is not suitable as a common metric because TLRs or unscheduled flow events are not used universally in the industry and the data are not reliable indicators of their role in managing reliability, as noted in the SPP discussion above.
A more suitable common metric might be a measure of the megawatts managed by all manual actions as a percentage of total megawatts subject to congestion management. Such a measure would encompass the full range of manual procedures used by ISOs, RTOs and utilities and it would not count TLRs that are not implemented. While we are not recommending that this metric be revised in this report, we encourage ISOs, RTOs, participating utilities and stakeholders to consider refinements to the metric or alternative metrics.
With respect to the Energy Management System availability metric, ISOs, RTOs and utilities in regions outside these markets provided the following information for the 2006–2010 period:
NYISO reported availability of greater than 99 percent, which is equivalent to Energy Management System unavailability of less than 87 hours and 36 minutes in a year.
PJM reported availability equal to 99.5 percent, which is equivalent to Energy Management System unavailability of 43 hours and 48 minutes in a year.
SPP reported availability since 2007 of greater than 99.5 percent.
PacifiCorp reported availability between 99.869 percent, which is equivalent to 11 hours and 29 minutes of unavailability in a year, and 99.9 percent, which is equivalent to 8 hours and 46 minutes of unavailability in a year.
ISO-NE, MISO, LG&E/KU and Southern reported availability of greater than 99.9 percent, which is equivalent to unavailability of less than 8 hours and 46 minutes in a year.
APS reported availability or greater than or equal to 99.94 percent, which is equivalent to unavailability of 5 hours and 15 minutes or less in a year.
Duke reported availability between 99.986 percent, which is equivalent to 1 hour and 14 minutes of unavailability in a year, and 100 percent for Progress Energy Carolinas and Progress Energy Florida. Duke did not report information for Duke Energy Carolinas.
CAISO’s report did not provide numerical data. Based on the graphical depiction in its report, availability ranges between 99.9 percent (equivalent to 8 hours and 46 minutes in a year) and 100 percent.
The data submitted and the discussion of the data by the ISOs, RTOs and utilities indicate that the Energy Management System Availability metric measures the same activities and has the same meaning across all entities, and therefore is a suitable common metric.
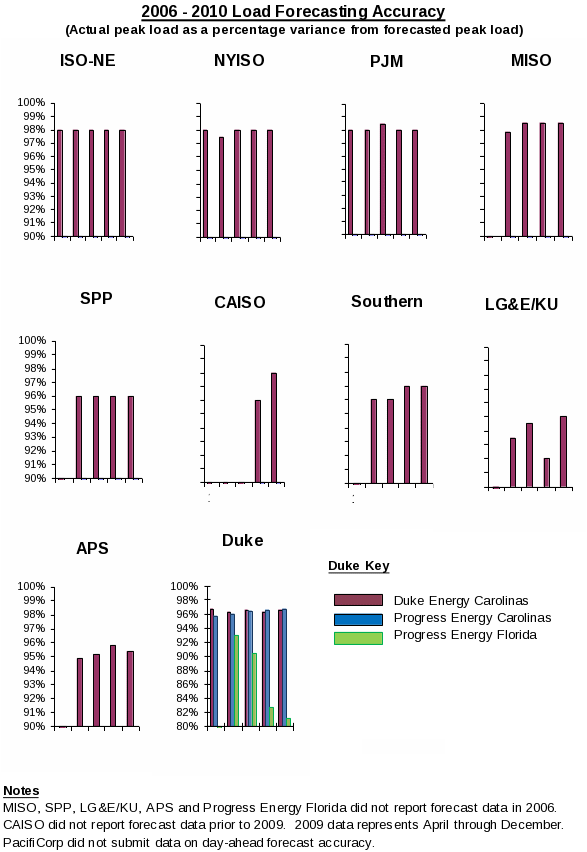
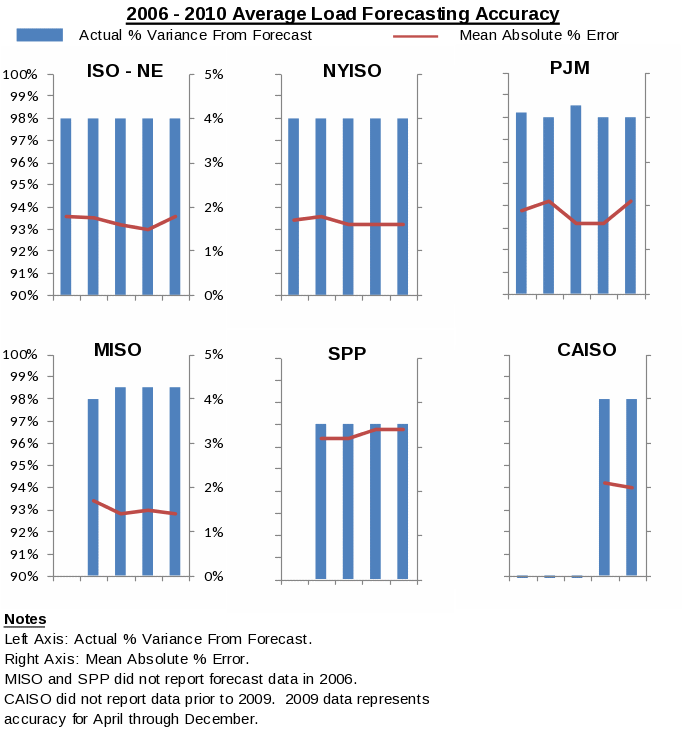
The percentage variance of actual peak load compared to day-ahead forecasted peak load measures the effectiveness of the load forecasting function. Since load forecasting provides the basis for resource commitment, this metric impacts the incurrence of resource costs. The more accurate an ISO, RTO or utility is in forecasting load, the greater the likelihood that it can commit sufficient resources in a cost-effective manner that avoids over-commitment of resources, inefficient commitment of short lead-time resources or under-utilization of available resources.
Day-ahead load forecasting by ISOs, RTOs and utilities is typically highly accurate, as shown by the forecast accuracy data on the following charts. While a day-ahead forecast metric is designed to ensure that it does not measure the ability to forecast long-term weather variability that is beyond the control of ISOs, RTOs and utilities, nonetheless, weather still played a role in forecast results. For example, Progress Energy Florida notes that significant weather shifts from AM to PM hours influenced its forecast results. Progress Energy Florida also explains that it forecasts higher to account for potential load volatility.5
The data submitted indicates that all ISOs and RTOs and three of the five utilities outside ISO and RTO markets use the same metric to measure load forecast accuracy. For these entities, the load forecast accuracy metric is measuring the same activity and has the same meaning. On this basis, we therefore conclude that the proposed load forecasting metric is a suitable common metric.
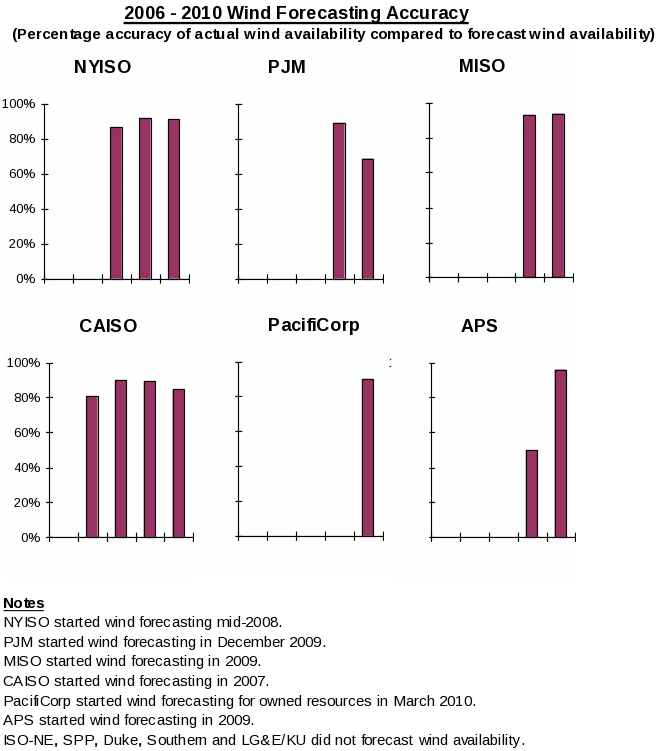
This metric measures the percentage accuracy of actual wind availability compared to day-ahead forecasted wind availability. Improving the accuracy of the wind forecast facilitates the timely commitment and dispatch of sufficient supplemental, non-wind resources.
During the 2006–2010 period, forecasting wind availability was a new activity for ISOs, RTOs and utilities, as shown by the lack of data for the early years of the analysis period in the charts below and in the discussion of improvements in forecasting techniques in the reports.6 Several transmission providers did not forecast wind availability because they had no or few wind resources interconnected to their transmission systems during the analysis period.
The entities forecasting wind availability used the common definition detailed above, comparing actual wind availability to day-ahead forecasted wind availability. The data submitted and discussion of the data by the ISOs, RTOs and utilities indicates that the wind forecast accuracy metric is measuring the same activity and has the same meaning across the entities forecasting wind availability, and therefore is a suitable common metric.
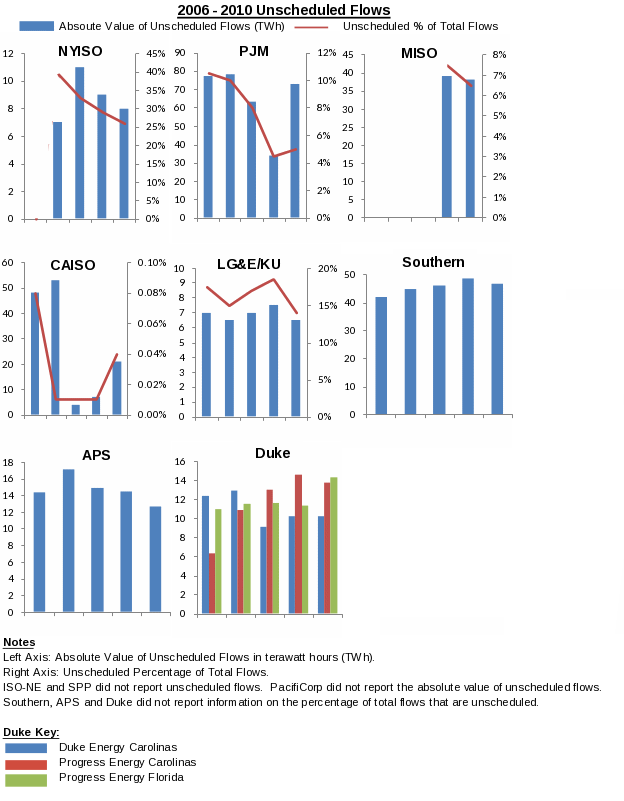
Unscheduled flows are defined as the difference between scheduled flows and actual flows on a particular interconnection between two Balancing Authorities and the difference between scheduled and actual flows on a contract path, either between Balancing Authorities or within Balancing Authorities. The two components of unscheduled flows are inadvertent energy, defined as the difference between actual and scheduled interchange for all interties, and parallel flow (or loop flow), defined as the difference between scheduled and actual flows on a contract path. Parallel flows are a function of the interconnection’s operating configuration, line resistance, and physics. This metric measures the difference between net actual interchange (actual measured power flow in real time) and the net scheduled interchange in megawatt hours, as reported in FERC Form No. 714, “Annual Electric Balancing Authority Area and Planning Area Report.” When unscheduled flows exceed system operating limits, curtailments could occur and efficient scheduling of the grid could be hindered. Accordingly, unscheduled flows provide information relevant to operational planning that is part of a comprehensive reliability assessment for an ISO, RTO or utility.
Unscheduled flows and their percentage of total flows vary significantly among the reporting entities, as shown on the charts below. The fact that certain of the reporting entities, such as NYISO, are in regions with more significant parallel flows7 than other regions would be an explanation for this variation. It should be noted that ISO-NE did not report unscheduled flows and explained that its system does not experience parallel flows because of its radial interconnection with the Eastern Interconnection.8
Unscheduled flows are based on a FERC Form No. 714 definition applicable to the entire electric industry and, therefore, this metric measures the same activities and has the same meaning across all entities; accordingly, it is a suitable common metric.
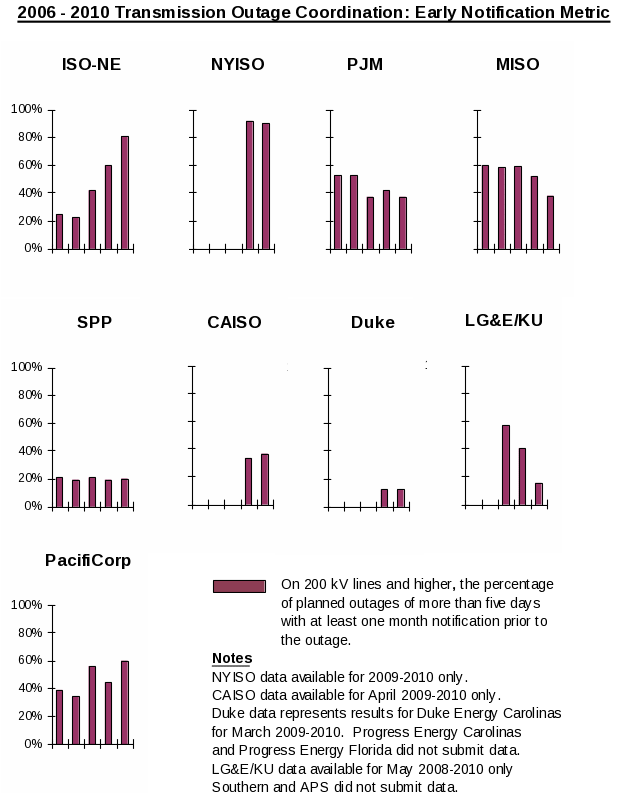
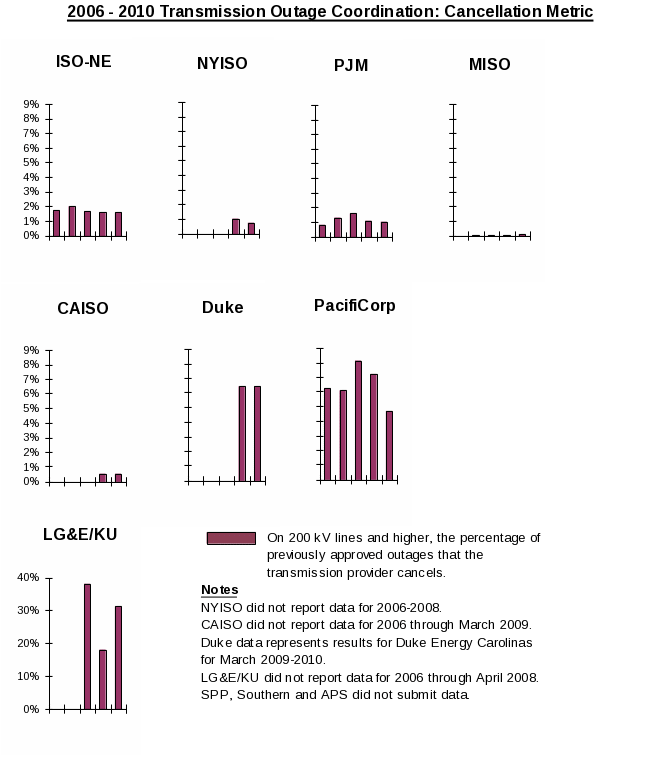
Commission Staff has defined the common metrics for effective transmission outage coordination as follows: (1) early notification of planned outages of five days or longer on major transmission lines (200 kV and above) – i.e., notification at least one month prior to the outage commencement date; and (2) cancellations of outages due to conflicting planned outages as well as forced outages that could cause reliability issues and additional congestion costs. All metrics are measured as a percentage of all outages. Effective transmission outage coordination will result in early notification of outages, and therefore will be indicated in the metrics as a low percentage of short notice outages. Effective transmission outage coordination ensures that outages do not threaten system reliability and that additional, and potentially more expensive, resources do not need to be committed.
The charts below show a range of results for the metric measuring early notification of planned outages on major transmission lines. These results require interpretation. Whereas the one-month notification requirement before planned outages is a metric that has been used by some ISOs and RTOs, such as PJM,9 for certain outage durations, other ISOs, RTOs and utilities do not have a one-month notification standard. For example, LG&E/KU coordinate their outage notifications with the Tennessee Valley Authority system, which uses a seven-day notice requirement.10 The chart for the second metric, cancellations of planned outages, shows low levels for all entities, with the exception of LG&E/KU.
The data submitted and discussion of the data by the ISOs, RTOs and utilities indicate that the transmission coordination metrics measure the same activities and have the same meaning across all entities, and therefore are suitable common metrics.
This metric tracks the effectiveness of a transmission provider’s planning process in facilitating development of the transmission system. Measures of transmission planning performance are as follows: (1) the number of transmission facilities approved to be constructed for reliability purposes; (2) the percentage of approved construction projects completed and on schedule; and (3) measures of the performance of the planning study process in completing reliability and economic studies. This information measures the ability of each ISO’s, RTO’s or utility’s expansion planning process to identify reliability and economic needs in advance.
With respect to the first metric, the number of transmission facilities approved to be constructed for reliability purposes, Commission Staff did not consider it appropriate to measure ISO and RTO performance based on construction spending and construction project completion information since ISOs and RTOs do not construct transmission facilities. Instead, a project approval measure was considered an appropriate common metric since all entities approve transmission projects – ISOs and RTOs in their reliability planning processes and utilities in their own transmission planning, which is undertaken typically as part of regional power pool planning processes.
Data submitted on transmission project approvals is shown on the chart below.
Transmission Projects Approved For Construction
Entity |
2006 |
2007 |
2008 |
2009 |
2010 |
CAISO |
48 |
45 |
50 |
49 |
48 |
ISO-NE |
149 |
147 |
245 |
200 |
185 |
NYISO |
10 |
20 |
35 |
47 |
40 |
MISO |
450 |
100 |
540 |
355 |
235 |
PJM |
250 |
280 |
355 |
420 |
455 |
SPP |
10 |
140 |
210 |
185 |
No Data |
APS |
0 |
1 |
2 |
2 |
1 |
Duke |
157 |
176 |
217 |
222 |
192 |
LG&E/KU |
9 |
14 |
9 |
21 |
18 |
PacifiCorp |
9 |
14 |
35 |
26 |
14 |
Southern |
16 |
28 |
35 |
25 |
39 |
Note
Bold italics indicate projects completed.
The data submitted and discussion of the project approval metric by the ISOs, RTOs and utilities indicates that this metric measures the same activity and has the same meaning across all types of entities, and therefore is a suitable common metric. While Duke and Southern submitted data on the number of projects completed, the other utilities outside ISO and RTO markets reported the number of projects approved, thereby indicating that this metric can be a common metric for all ISOs, RTOs and utilities outside ISO and RTO markets.
Commission Staff intends the second metric, the percentage of approved projects completed, to track progress in completing projects. The metric on the chart below shows the percentage of projects approved in each year that were completed as of December 31, 2010. Only the ISOs and RTOs provided this information. Utilities outside ISO and RTO markets did not use this measure, and instead tracked their performance based on the percentage of projects that were on schedule each year. On this measure, Duke, Southern and APS reported 100 percent of transmission projects on schedule, PacifiCorp reported 90 percent on schedule for most years, and LG&E/KU reported, respectively, between 50 percent and 80 percent of transmission projects on schedule.
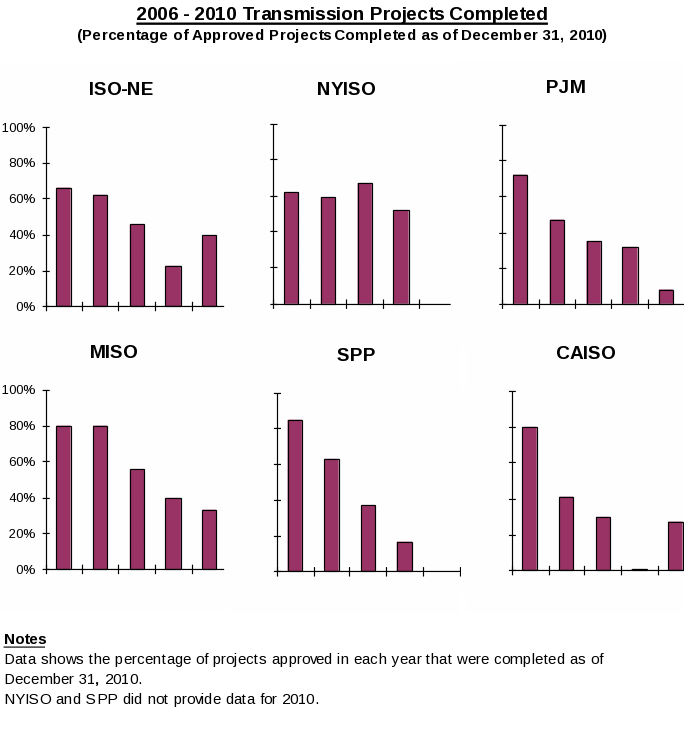
Inasmuch as utilities outside ISO and RTO markets are tracking information on project completion, it is expected that they could provide the same information provided by the ISOs and RTOs and, therefore, this metric would be suitable as a common metric.
With respect to measures of the planning study process, all reporting entities conduct annual reliability studies as part of their regional expansion planning processes. Such assessments typically encompass sensitivity analyses based on stakeholder requests. Southern indicated that it performed 191 reliability studies in addition to its annual reliability analysis, and that it evaluated 30 sensitivity analyses.11 PacifiCorp and LG&E/KU did not receive any requests for additional reliability studies.
As for economic studies, ISOs, RTOs and utilities provided the following specific study information:
ISO-NE completed five economic studies over the 2006–2010 period.
MISO completed four economic studies in 2009 and 2010.
NYISO initiated a biennial economic planning process in 2009.
Duke Energy Carolinas and Progress Energy Carolinas evaluated 10 economic assessment sensitivities over the 2006–2010 period.
Progress Energy Florida received no requests.
LG&E/KU completed five economic studies annually as part of its expansion planning process.
APS completed three economic studies over the 2006–2010 period.
PacifiCorp completed one economic study over the 2006–2010 period.
The data submitted and discussion of the data by the ISOs, RTOs and utilities indicates that the planning study metrics measure the same activities and have the same meaning across all entities, and therefore are suitable common metrics.
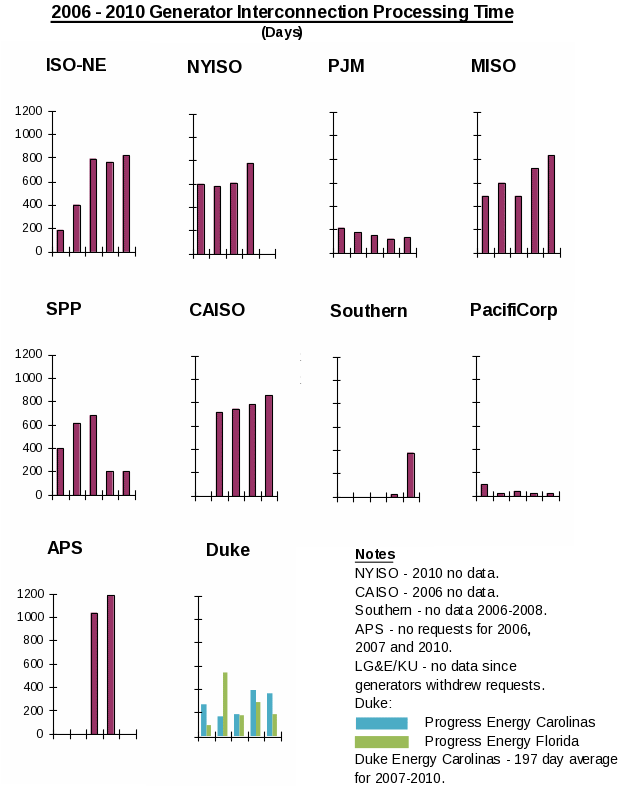
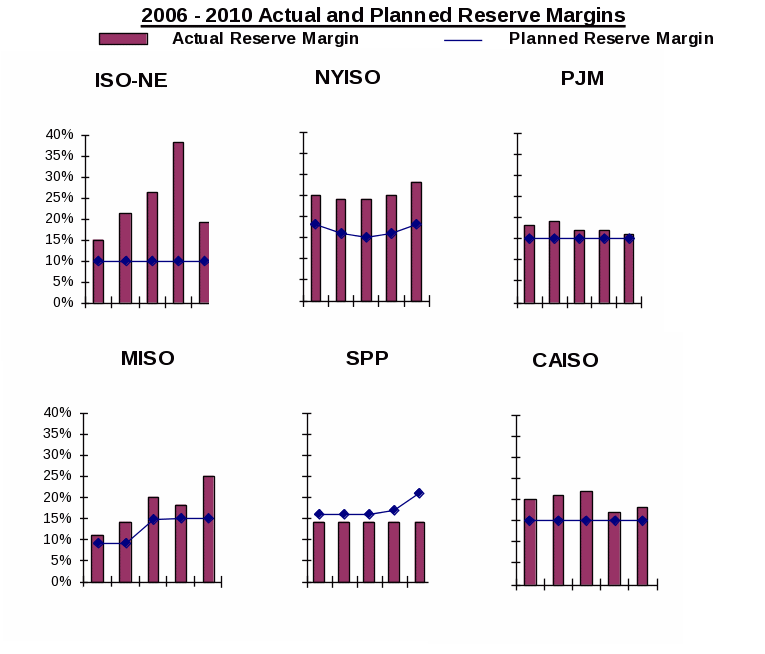
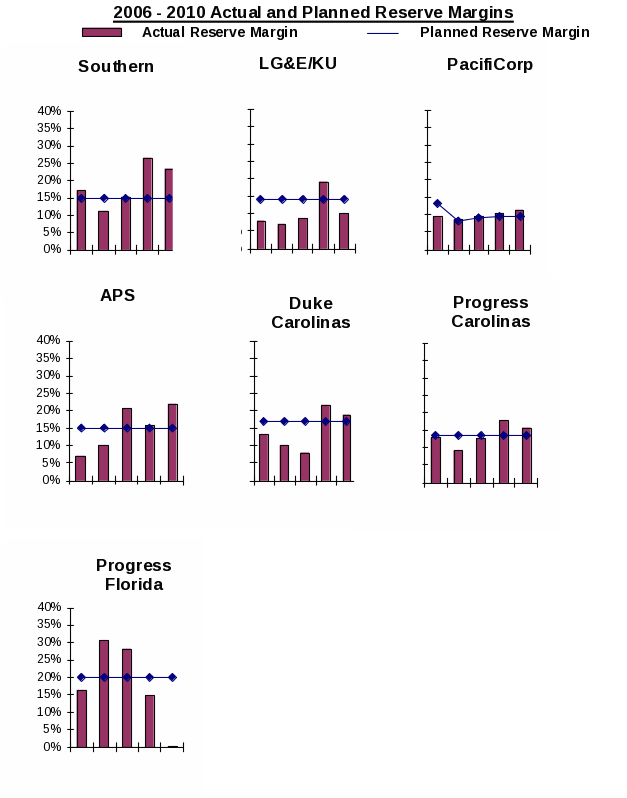
Two metrics are employed to measure the effectiveness of long-term reliability planning for resources. The first metric, processing time for generation interconnection requests, measures the effectiveness of processes in achieving timely interconnection of new resources. The second metric compares the actual reserve margin to the planned reserve margin to measure the extent to which ISO, RTO and utility generation resource planning processes are ensuring long-term resource adequacy and reliability.
The results of the first metric, the time required to process generator interconnection requests, show that ISO-NE and MISO experienced significant increases – a four-fold increase for ISO-NE and a doubling for MISO – in the time required to process generator interconnection requests. ISO-NE and MISO cited several factors as explanations for the processing time increases, including:
wind manufacturers have been slow to provide accurate models needed for study completion;
dependence of later-queued projects on earlier-queued projects;
tariff requirements allowing customers to waive or combine phases of the interconnection process;
requests to not proceed by resource developers; and
increasing complexity and congestion impact of interconnection requests.12
The processing time for generator interconnection requests metric should be evaluated primarily in terms of the trends for each respondent. Each ISO, RTO or utility interconnects generators under widely different operating conditions. Some entities, such as ISO-NE and MISO, were required to process hundreds of new requests each year as new resources were developed in response to renewable energy programs. Others, such as LG&E/KU and Southern, had few requests each year and therefore the time-required data reflects the time required to process fewer applications. Also, inasmuch as processing time can include time during which the developer chooses not to interconnect,13 this metric is not entirely within the control of ISOs, RTOs or utilities.
The second metric, actual versus planned reserve margins, shows a wide range of results, ranging from resources in excess of planning requirements on a consistent basis (ISO-NE) to actual reserve margins both above and below the planned reserve margin (Southern, Duke, LG&E/KU, and APS). Actual reserve margins in SPP were consistently below planned margins.
The data submitted and discussion of the data by ISOs, RTOs and utilities indicates that the long-term reliability resource planning metrics measure the same activities and have the same meaning across all entities and, therefore, are suitable common metrics.
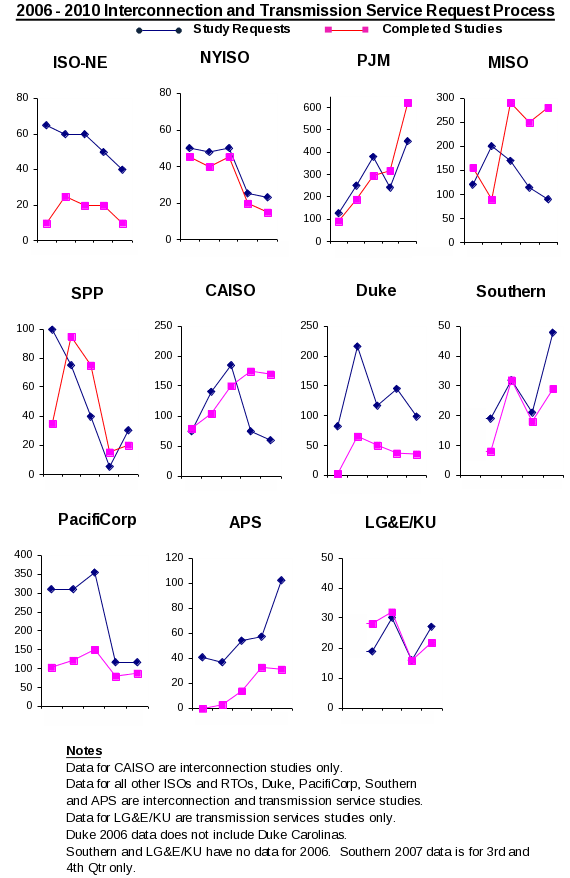
These metrics track the progress that ISOs, RTOs and utilities have made in completing their reliability reviews (feasibility, system impact and facility studies) of interconnection and transmission service requests in a timely and efficient manner. The metrics track the number of study requests, the time required to complete the reliability reviews – including the age of incomplete studies – and the costs of completing each of the three types of studies.
With respect to the first metric on the number of study requests and completed studies, the data provided by the ISOs and RTOs shows a wide range of study requests in the accompanying charts – from 250 for SPP to 1445 for PJM over the 2006 – 2010 period. Data for utilities in regions outside ISO and RTO markets likewise show a wide range of study requests – ranging from 139 for Southern to 1211 for PacifiCorp over the 2006 - 2010 period.14 In light of the significant differences in interconnection and transmission development among the ISOs, RTOs and utilities, this metric should be evaluated primarily in terms of the trends for each respondent over time.
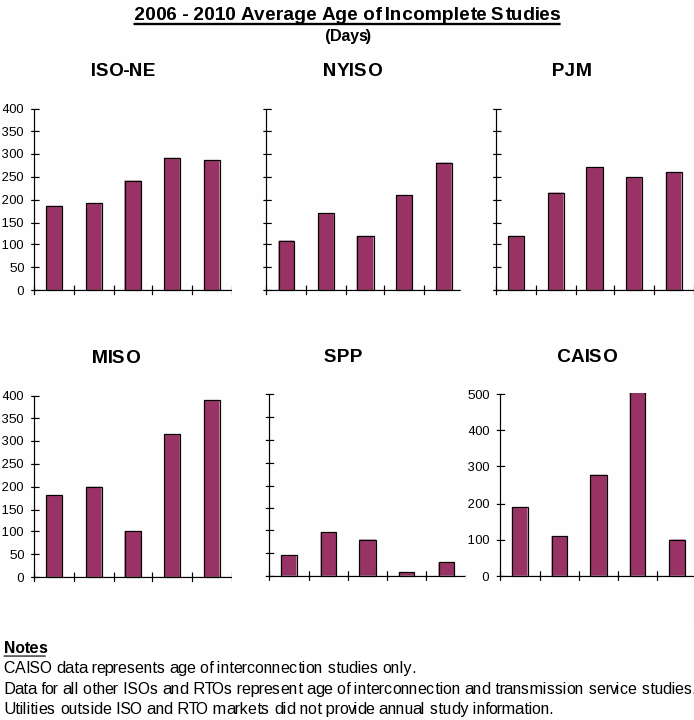
The second metric on the average age of incomplete studies metric provides a measure of the efficiency of the study process for interconnections and transmission service requests. The annual data on the age of incomplete studies shown on the charts below is for ISOs and RTOs only. Utilities outside ISO and RTO markets did not provide annual information on studies. Duke indicated that, as of January 1, 2011, the average age for incomplete interconnection studies was 108 days and 58 days for transmission service requests. Southern indicated that, as of January 1, 2011, the average age for incomplete interconnection studies was 14 days and 23 days for transmission service requests. LG&E/KU and PacifiCorp indicated that no studies were incomplete. APS indicated that, as of January 1, 2011, the average age for incomplete interconnection studies was 119 days.
The table below compares the costs of studies. The range of costs shown depicts the lowest and highest average costs reported over the 2006–2010 period.
2006 – 2010 Range of Average Costs of Studies
Entity |
Feasibility Study Costs |
System Impact Study Costs |
Facility Impact Study Costs |
ISO-NE |
$62,824 - $94,960 |
$83,370 - $121,363 |
$4,479 - $146,685 |
NYISO |
$24,217 - $45,805 |
$38,990 - $58,337 |
$113,090 - $125,119 |
PJM |
$3,514 - $4,538 |
$10,263 - $14,406 |
$28,635 - $66,648 |
SPP |
$2,491 - $6,495 |
$14,050 - $17,694 |
$7,290 - $16,960 |
APS |
$13,983 - $17,512 |
$37,127 - $43,662 |
$29,890 - $47,059 |
Duke |
$2,775 - $14,376 |
$371 - $43,601 |
$1,078 |
LG&E/KU |
No data |
$2,925 - $4,237 |
$2,636 - $3,256 |
Southern |
No data |
$5,688 - $10,683 |
$5,329 - $6,912 |
Notes
▪ Duke costs do not include Duke Energy Carolinas. Total study costs for Duke Energy Carolinas ranged from $31,084 to $70,483.
▪ LG&E/KU and Southern data based on transmission service study costs only.
▪ MISO reported average annual total costs (feasibility, system impact and facility impact studies) that ranged between approximately $90,000 to $175,000.
▪ PacifiCorp only reported total (aggregate) annual costs.
▪ CAISO did not provide data.
The data submitted and discussion of the data by ISOs, RTOs and utilities indicates that the interconnection and transmission process metrics measure the same activities and have the same meaning across all entities, and therefore are suitable common metrics.
Special Protection Systems15 are automatic protection systems designed to detect abnormal or predetermined system conditions and take corrective actions, such as changing demand, generation, or system configurations in order to maintain system stability, acceptable voltage levels, or power flows. These metrics measure the number of Special Protection Systems, as well as the performance of such Special Protection Systems, based on the definition of Special Protection Systems used by the reporting entity’s Regional Entity. These performance metrics measure both the frequency with which the region relies on these systems and their effectiveness, as measured by successful activations and the number of unintended activations.
The table below compares the number of special protection systems used by ISOs, RTOs and utilities in 2010.
Entity |
Special Protection Systems |
CAISO |
65 |
ISO-NE |
9 |
NYISO |
12 |
MISO |
50 |
PJM |
45 |
SPP |
5 |
APS |
6 |
Duke |
2 |
LG&E/KU |
0 |
PacifiCorp |
8 |
Southern |
5 |
Note
Duke data represents Progress Energy Florida information. Duke Energy Carolinas and Progress Energy Carolinas did not have Special Protection Systems.
With respect to the performance of Special Protection Systems, the ISOs, RTOs and utilities provided the following information for 2010:
ISO-NE had one misoperation in which a Special Protection System did not perform as designed.
PacifiCorp had four unintended activations of Special Protection Systems.
MISO, PJM, SPP, Progress Energy Florida, Southern and APS had no unintended activations or misoperations.
CAISO, NYISO, LG&E/KU, Duke Energy Carolinas and Progress Energy Carolinas did not provide performance information.
The data submitted and discussion of the data by ISOs, RTOs and utilities indicate that the Special Protection System metrics measure the same activities and have the same meaning across all entities and, therefore, are suitable common metrics.
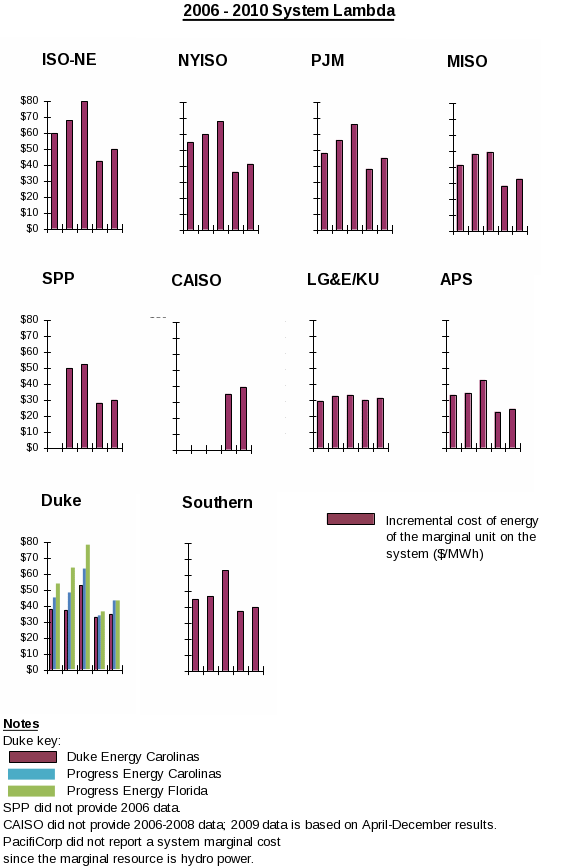
System lambda is the incremental cost of energy of the marginal unit assuming no system constraints. This metric tracks the trend in marginal fuel costs and is an important metric because fuel costs represent the largest component of wholesale energy costs. The system lambda metric does not apply to utilities where the marginal price is typically set by hydro units. Also, system lambda data is based on information contained in FERC Form No. 714.
The data on the accompanying charts shows a range of incremental costs, reflecting differences among regions in the costs of fuels used by the marginal unit for ISOs, RTOs and utilities. The data submitted and discussion of the data by ISOs, RTOs and utilities indicate that the system lambda metric has the same meaning across all entities and, therefore, is a suitable common metric.
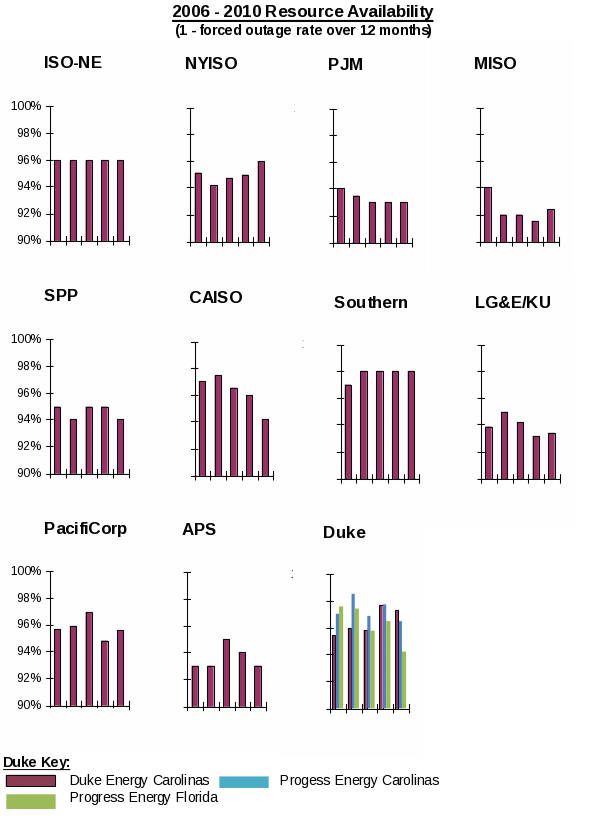
This metric measures the percentage of time that system resources are available after accounting for unplanned outages, as measured by the system forced outage rate. Resource availability is calculated as one minus the forced outage rate.16 Resource availability is a measure of efficiency and cost management. Higher generator availability can result in the commitment of fewer potentially higher cost peak generators (or the importation of potentially higher cost peak supplies), thereby resulting in reduced costs.
Resource availability for ISOs, RTOs and utilities ranged between 98 percent and 92 percent, as shown on the charts below. The data submitted and discussion of the data by the ISOs, RTOs and utilities indicates that the resource availability metric has the same meaning across all entities, and therefore is a suitable common metric.
This metric is defined as the percentage mix of fuel types installed and available (capacity fuel diversity) and produced (generation fuel diversity). Fuel diversity provides an indication of the capability of ISOs, RTOs and utilities to integrate fuels with different characteristics, such as lower costs or lower environmental impacts, and how this capability compares to the fuel mix of energy consumed.
With respect to the first metric, the diversity of resources as measured as a percentage of capacity, the capacity of ISOs, RTOs and utilities is predominantly comprised of coal, natural gas and nuclear power resources. The exception is the significant hydro and renewable capacity in CAISO and PacifiCorp (between 15 and 27 percent of total capacity). It should also be noted that ISO-NE and NYISO have meaningful capacity contributions (between 13 and 16 percent) from hydro and renewable resources. The second metric, which measures the diversity of resources used in providing energy, shows a greater reliance on coal, natural gas and nuclear power resources for meeting the daily energy needs in ISO and RTO markets and in utilities outside ISO and RTO markets. For example, coal provided nearly all the energy generated for LG&E/KU load. MISO, Southern, and PacifiCorp also relied heavily on coal resources for energy requirements.
The data submitted and discussion of the data by the ISOs, RTOs and utilities indicates that the fuel diversity metrics have the same meaning across all entities, and therefore are suitable common metrics.
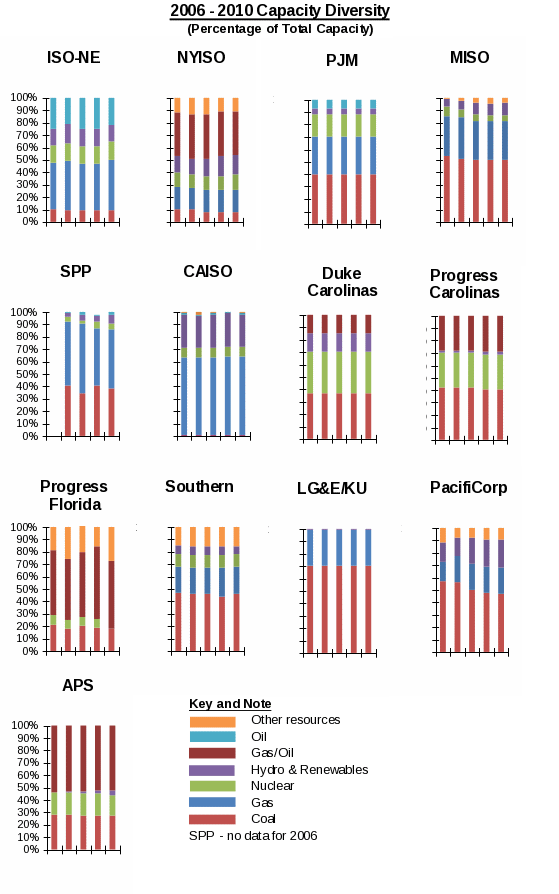
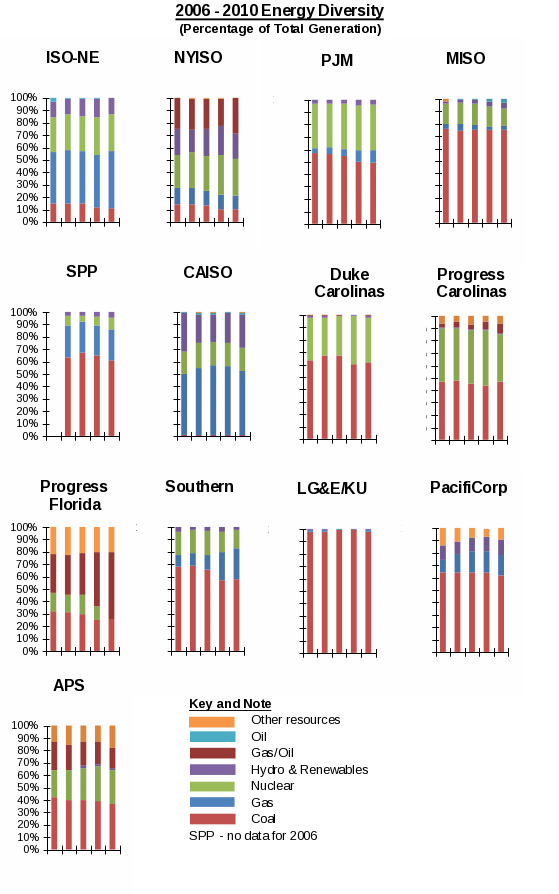
A number of performance metrics were developed that are not on the list of common metrics because they are not applicable to the entire industry. For example, metrics were developed that measure the performance of ISO and RTO markets. Since regions outside ISO and RTO markets by definition do not have energy, ancillary services or capacity markets, such measures are not universally applicable and, therefore, are not suitable common metrics. Similarly, metrics for utilities in regions outside ISO and RTO markets measure certain aspects of transmission provider performance that are not relevant to ISOs and RTOs. For example, metrics were developed for utilities in regions outside ISO and RTO markets that evaluate the extent to which transmission service is open-access and non-discriminatory. These metrics appropriately apply to utilities in regions outside ISO and RTO markets that have an incentive to discriminate among users of their transmission services in their role as transmission providers for transmission service on transmission facilities that they own. However, they are not relevant to ISOs and RTOs, since ISOs and RTOs are independent entities that do not own transmission facilities and, therefore, they do not have an incentive to discriminate among users of their transmission service.
Other metrics specific to ISOs and RTOs are evaluated first, followed by other metrics specific to utilities in regions outside ISO and RTO markets.
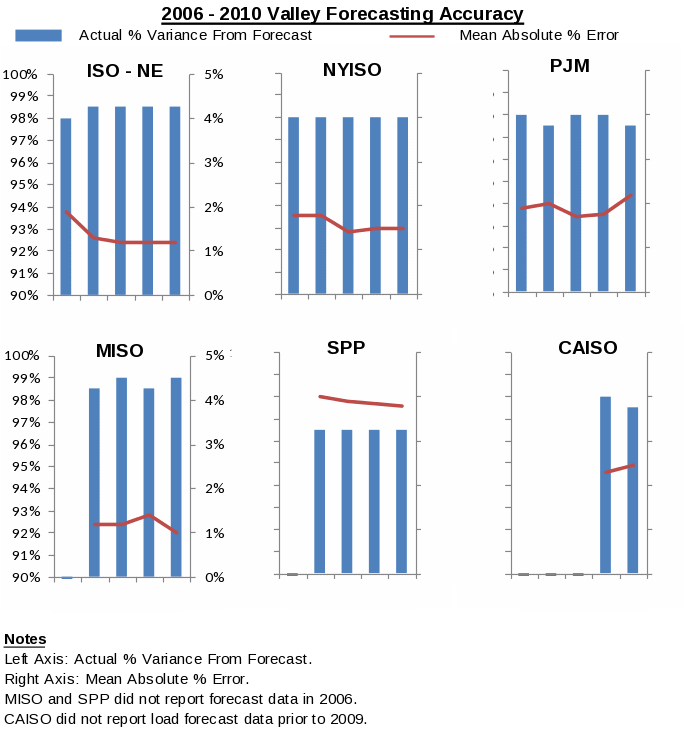
In addition to the common load forecasting accuracy metrics discussed above, ISO and RTO average year and valley (off-peak) forecasting accuracy performance was also evaluated. Also, load forecasting accuracy was measured using a mean absolute percentage error metric. This information is illustrated in the charts below.
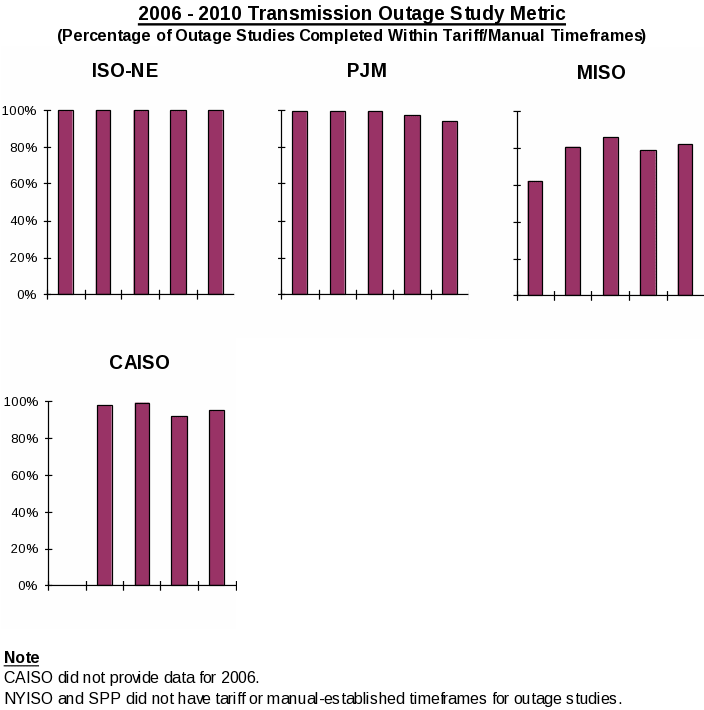
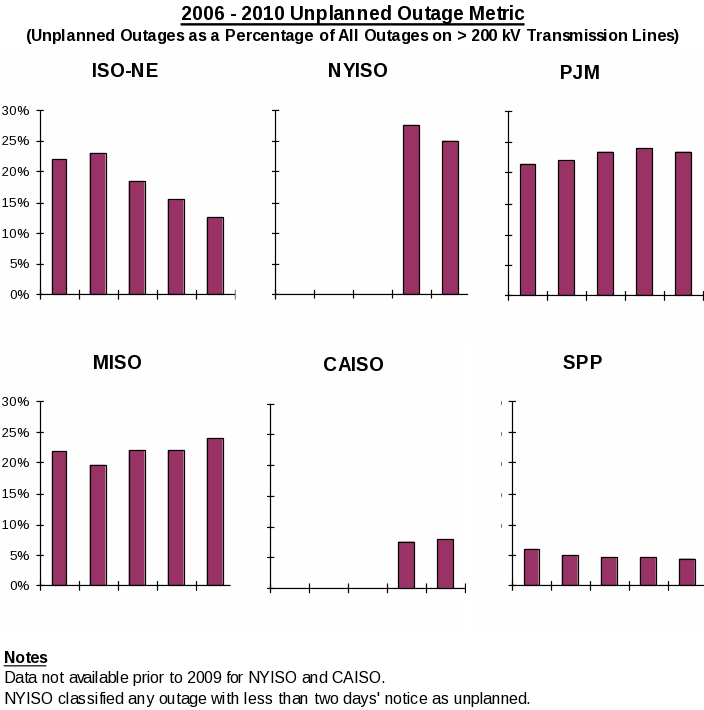
In addition to the common transmission outage metrics discussed above, ISO and RTO performance was also evaluated according to the following metrics: (1) percentage of planned outages studied within prescribed tariff and business manual timeframes; and (2) percentage of unplanned outages compared to all outages on transmission facilities greater than 200 kV. ISO and RTO performance data is presented on the charts below.
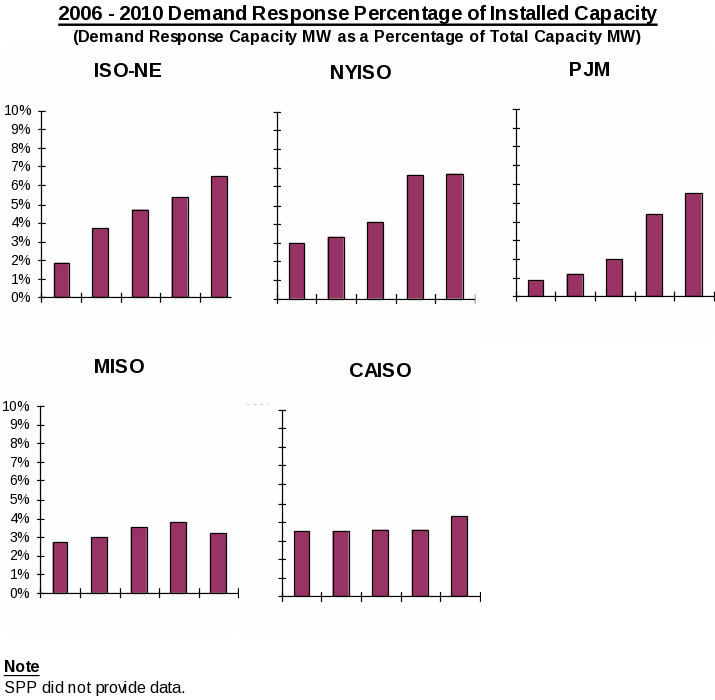
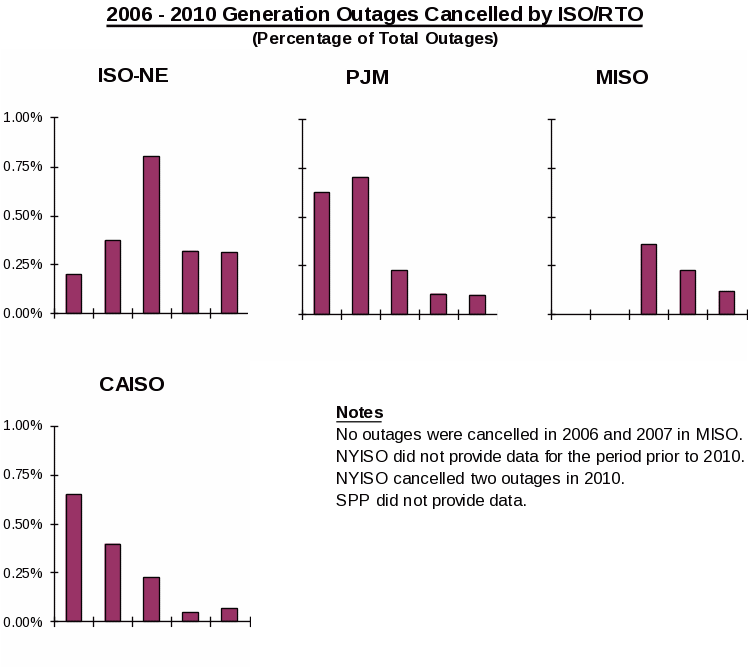
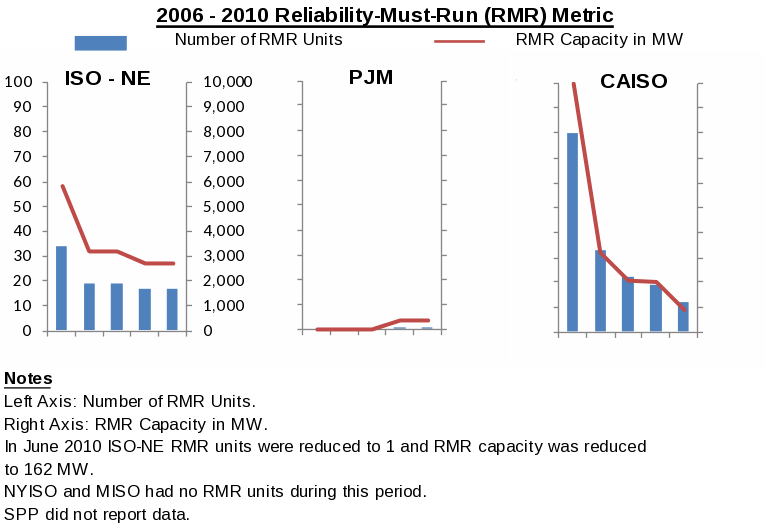
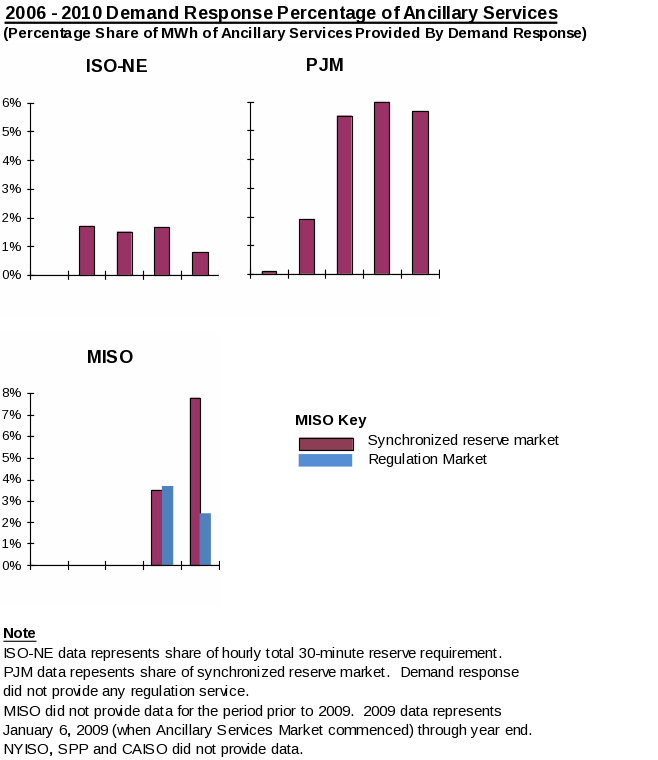
In addition to the common long-term reliability planning for resource metrics discussed above, ISO and RTO performance was also evaluated according to the following metrics: (1) demand response megawatts as a percentage of total capacity; (2) percentage of generation outages cancelled by ISOs/RTOs; (3) number and capacity of generation reliability-must run contracts; and (4) demand response megawatts as a percentage of total ancillary services. The demand response metrics provide an indication of the role played by demand response resources in maintaining short-term and long-term reliability in ISOs and RTOs. The generation outage cancellation metric provides an indication of the effectiveness of ISOs and RTOs in administering generation outage schedules. A low cancellation percentage indicates that generation owners were allowed to complete nearly all the maintenance they had planned without incurring rescheduling costs or delays. The reliability-must-run metric provides a measure of the degree to which an ISO or RTO must depend on critical facilities to maintain reliability and the flexibility of an ISO or RTO system to respond to emergencies and other contingencies. ISO and RTO performance data is presented on the charts below.
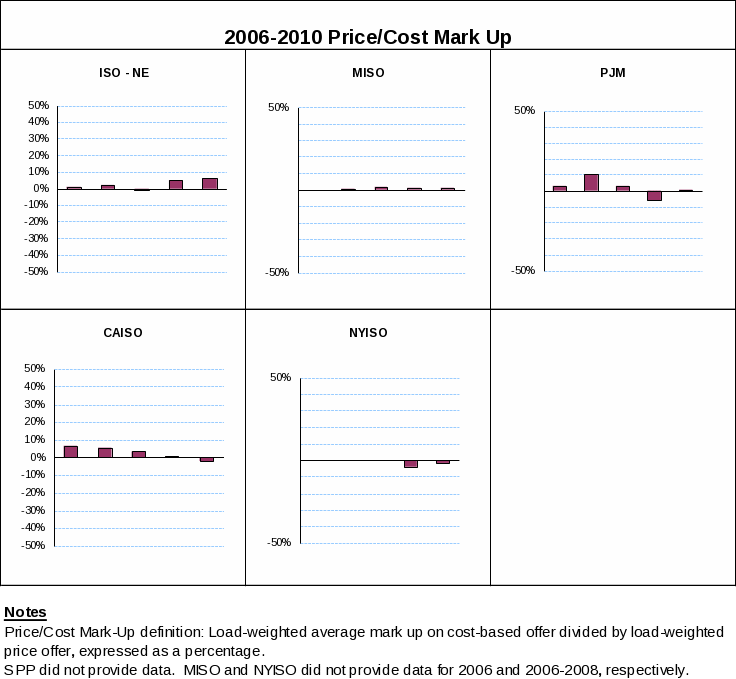
The price-cost mark-up metric compares the system marginal price to the system marginal cost, assuming no system constraints.1 The ratio between the marginal price and marginal cost indicates the degree of competition and efficiency in ISO and RTO markets. ISO and RTO markets are more competitive the closer prices are to marginal costs. This metric is measured as the percentage mark-up for each year.
The results in the chart below show that system marginal costs and system marginal prices are nearly identical in all ISO and RTO markets, indicating efficient and competitive conditions in these markets.
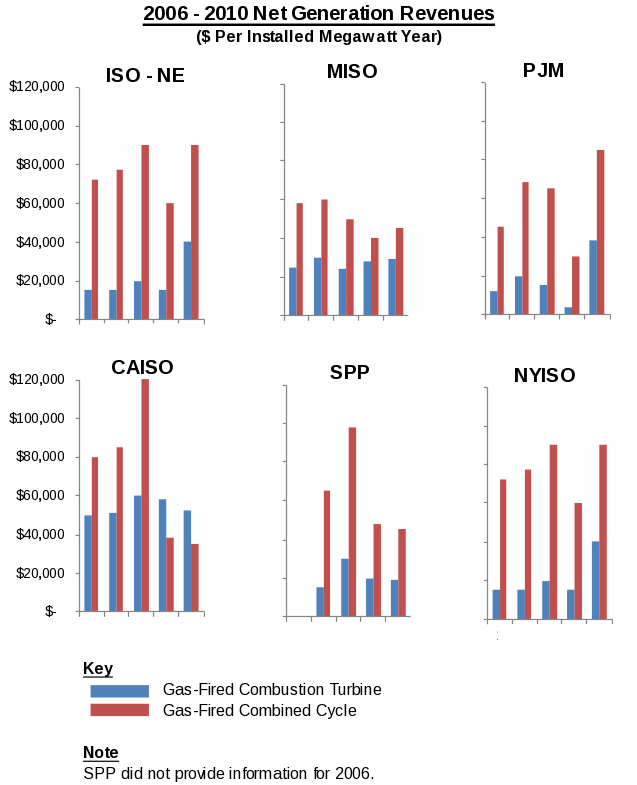
Generator net revenue measures the revenue that a new generator would earn above its variable production costs if it were to operate only when its variable production costs were less than the energy price. This metric can be an indicator of whether generator net revenues are sufficient to ensure new investment, if needed, and are consistent with competitive markets. This metric is measured on an annual basis and comes from analysis conducted by each entity’s market monitor.
The data in the accompanying charts reflect the estimated generator revenues per megawatt year for a new combustion turbine unit fueled by natural gas and for a new entrant combined-cycle unit fueled by natural gas. Several of the ISO and RTO reports indicate that revenues are below the levels needed for new investment.2
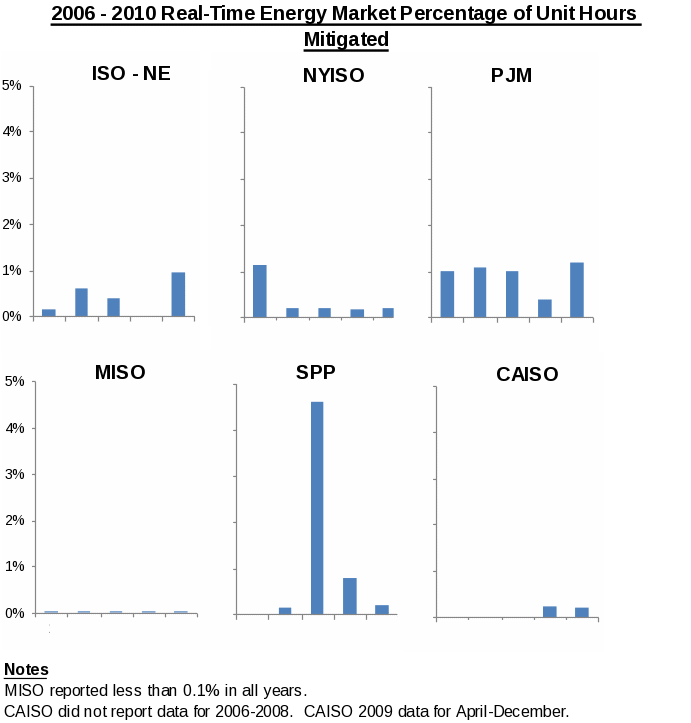
This metric provides an indication of the magnitude of mitigation occurring in ISO and RTO markets, as measured by the percentage of unit hours that prices were set at the mitigated price on an annual basis. The accompanying chart shows a low percentage of mitigated hours for all ISOs and RTOs, again indicating competitive conditions across these markets.
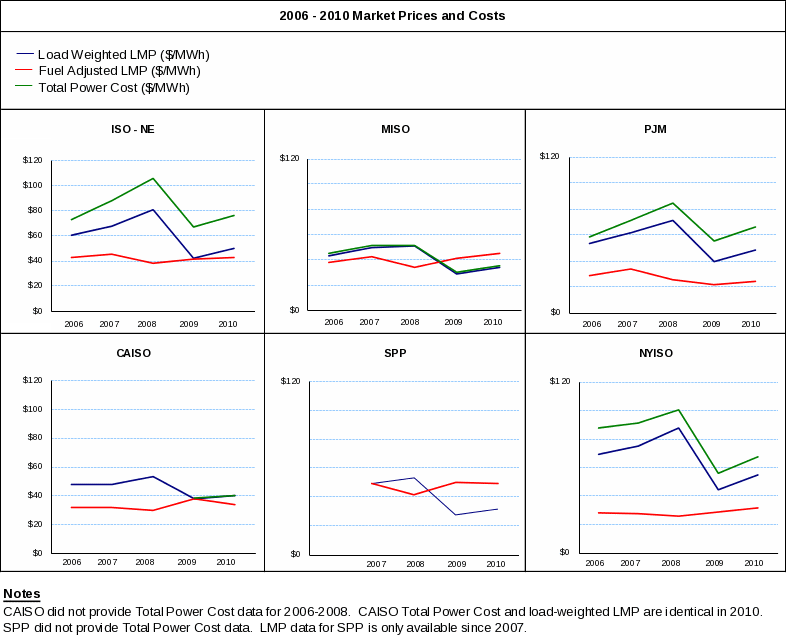
The four market pricing metrics measure the customer cost impact of ISO and RTO markets. The first measure, the load-weighted locational marginal price (LMP) metric, measures the cost to load of energy purchased in ISO and RTO markets. The second metric, components of total power costs, breaks out each element of all costs paid by load, thereby providing a comprehensive assessment of all ISO and RTO market costs.3 The third measure, the load-weighted, fuel-adjusted locational marginal price, is derived by holding fuel costs constant over a defined time period to show the trend of non-fuel customer costs over this period. This metric isolates the customer cost impact of cost elements such as transmission costs, congestion and losses, thereby providing a measure of the effectiveness of ISO and RTO market management. This metric also reflects the impact of load growth, investments in resources and the retirement of uneconomic facilities, and therefore it measures factors that are not entirely within the control of ISOs and RTOs. The fourth metric measures the impact of demand response on market prices, including impacts associated with voluntary curtailments by demand response during heat waves and other emergency conditions. All four metrics are measured on an annual basis.
The first three metrics on market pricing and costs are summarized on a single chart below. The purple and green lines in the chart, the energy cost and total power cost metrics, closely follow fuel price trends. As detailed in the ISO and RTO performance reports, the nation-wide increase in fuel costs in 2008 and the decrease in 2009 were closely tracked in wholesale energy prices. More relevant to an assessment of ISO or RTO performance is the red line in the chart, the market price adjusted for fuel costs. This metric, when compared to unadjusted market prices, shows the impact of security constrained economic dispatch, incentives for improved generator availability, investment in more efficient generating units, and other factors on prices. Therefore, this metric provides a measure of the efficiency of ISO and RTO markets, and how that efficiency provides a benefit to consumers in their cost of energy. It should be noted that each ISO or RTO uses a different base year for its fuel adjustments and different fuel mixes and, therefore, direct comparisons between ISOs and RTOs are not meaningful.
With regard to the fourth metric, the impact of demand response on prices, ISOs and RTOs provided the following information:
MISO indicated that clearing prices declined by $100 - $200 per megawatt-hour during hours in which demand response participated in the August 1, 2006 emergency event.4
ISO-NE estimated that its demand response programs reduced average real-time LMPs between $0.04 (April-June 2009) and $1.72 (June-September 2010) per megawatt-hour over the 2008-2010 period.5
NYISO calculated that demand response reduced locational marginal prices between $0.04 (2007) and $2.05 (2008) per megawatt-hour.6
PJM estimated that voluntary curtailments through its demand response program reduced wholesale energy prices by approximately $12 per megawatt-hour in the summer of 2010 and by more than $300 per megawatt-hour during August 2006.7
Convergence of day-ahead and real-time energy prices provides an indication of the efficiency of ISO and RTO markets. Since the large majority of energy settlements and generator commitments occur in the day-ahead market, day-ahead price convergence with the real-time market ensures efficient day-ahead commitments that reflect real-time operating needs. Energy market price convergence is measured by the absolute value and percentage of the annual difference between real-time energy market prices and day-ahead market prices. Prices in ISO-NE, MISO and PJM showed a difference of less than two percent between day-ahead and real-time prices. NYISO reported a difference of between four and one percent. In CAISO, day-ahead and real-time prices had a difference of between eight and nine percent in 20098 and 2010. SPP did not report convergence information since it did not operate a day-ahead market.9
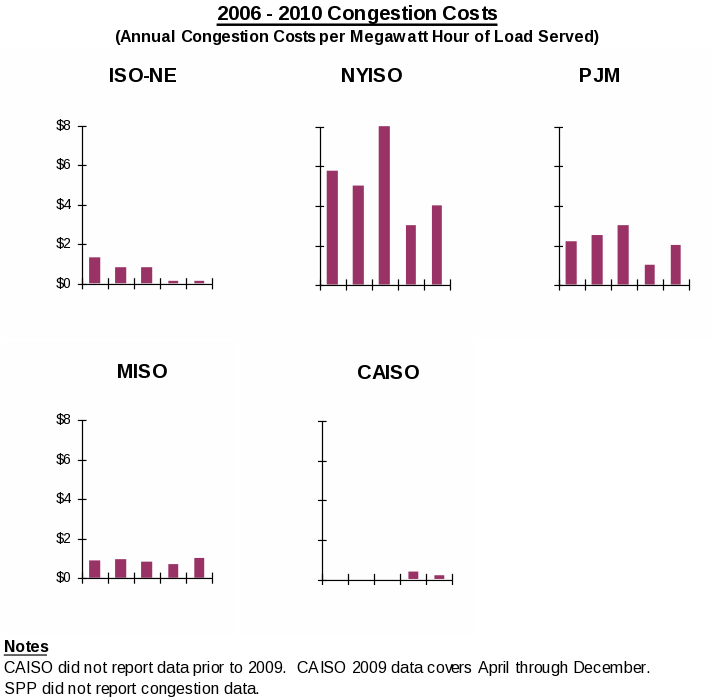
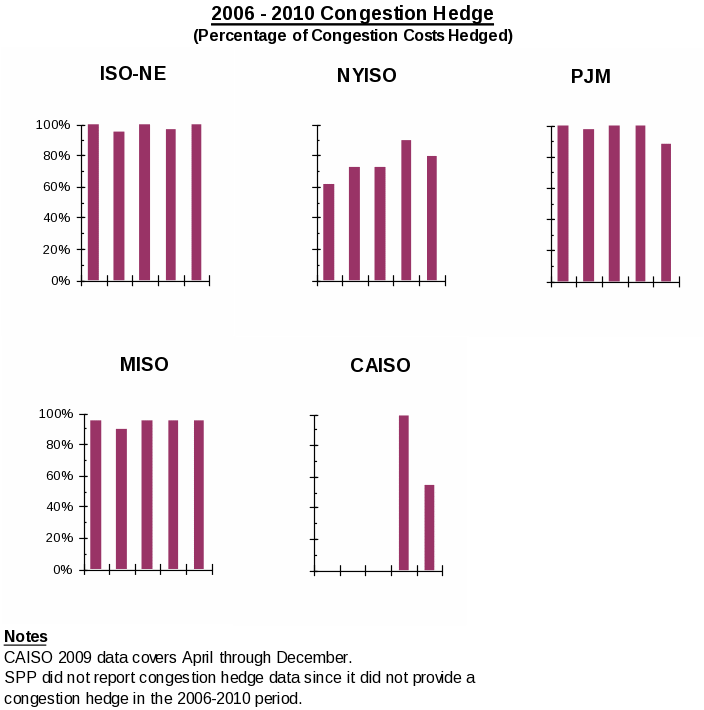
Congestion represents the cost to customers of paying for more expensive energy because physical transmission line limits do not allow full delivery of least-cost energy. The first congestion management metric, annual congestion costs divided by the megawatt hours of load served, tracks congestion cost trends relative to load growth, thereby providing an indication of the efficiency of the overall ISO or RTO system as well as the effectiveness of ISO or RTO efforts to manage congestion costs through transmission expansion planning and other efficiency measures. This metric is also influenced by other factors, such as load trends, and therefore it is not entirely within the control of the ISO or RTO. The second metric, congestion revenues paid divided by congestion charges expressed as a percentage, tracks the ability of market participants to hedge these congestion costs, and thereby manage their costs. These metrics are shown on the charts below.
In addition to the generator outage metric, discussed above in the common metrics, ISOs and RTOs tracked demand resource availability. Demand resource availability measures the availability of demand response when called on to perform and when tested for its capability to meet capacity requirements. PJM reported that demand response performed at 121 percent of capacity values when called on in 2006, and 118 percent in 2009 and 99 percent in 2010 when tested. Demand resources provided a cumulative load reduction in 2010 of 4,652 megawatts. NYISO reported that demand response was called on for five events in 2006 and two events in 2010. During the 2006 events in NYISO, demand response provided between 314 and 865 megawatts per hour. During the 2010 events in NYISO, demand response provided between 387 and 409 megawatts per hour. ISO-NE estimated availability of 966 megawatts for on-peak demand resources based on events from August 1, 2006 through August 25, 2009. MISO reported that it did not call on its load modifying resources during this period. CAISO and SPP did not report on this metric.
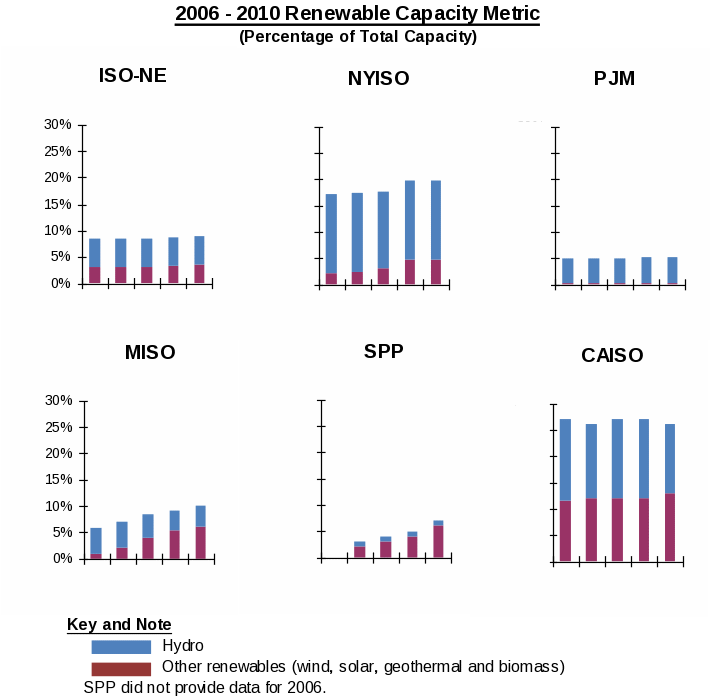
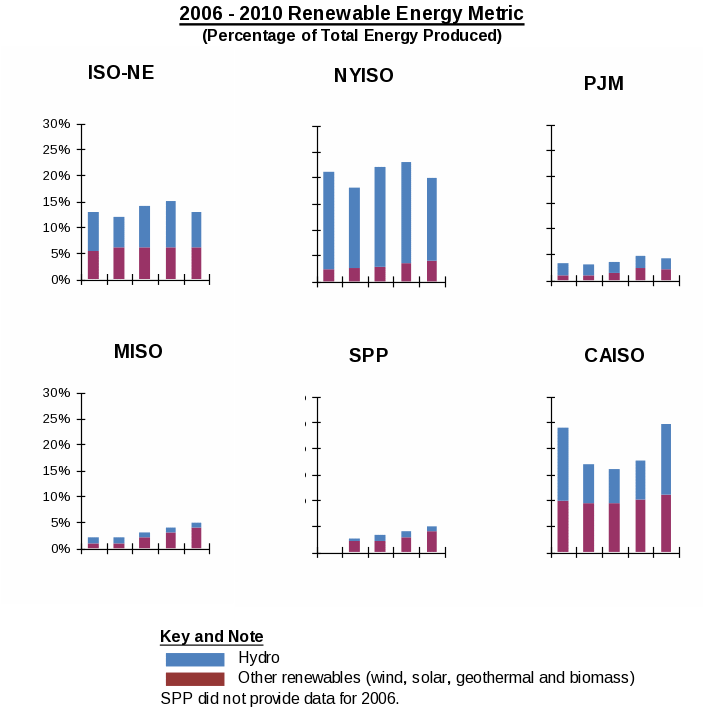
Renewable resource10 penetration in ISO and RTO markets is measured as the renewable share of total capacity and the renewable share of total energy. The renewables metrics indicate the diversity of an ISO or RTO resource mix to meet demand and capacity requirements. The renewable diversity profiles of the ISOs and RTOs are shown on the charts below.
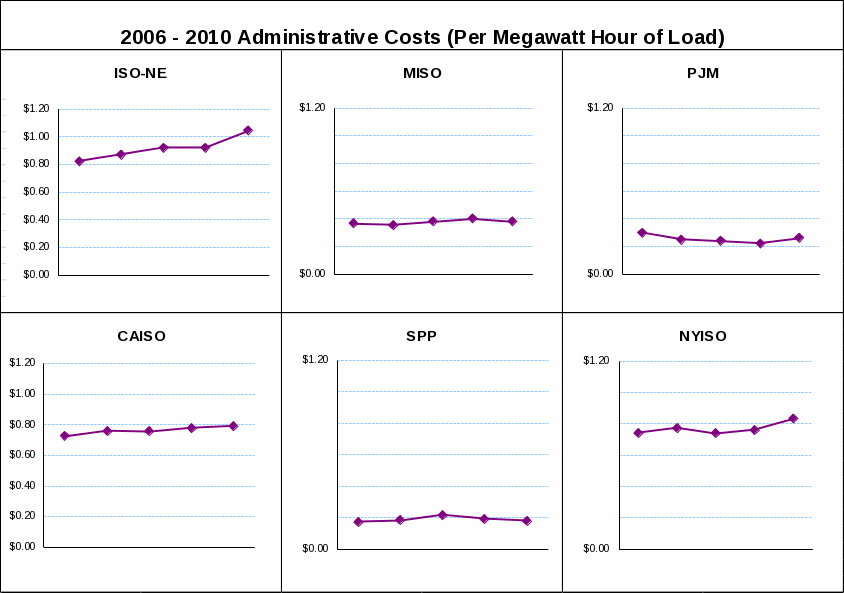
Administrative cost metrics measure the ability of ISOs and RTOs to manage the growth rate of administrative costs commensurate with the growth rate of system load (administrative charges cents per megawatt-hour of load served metric) and to keep costs within budgeted levels (actual versus budgeted administrative charges metric). The components of ISO and RTO administrative costs are capital costs – capital charges, debt service, interest expense and depreciation expense – and operating and maintenance costs net of miscellaneous income. By managing administrative costs, ISOs and RTOs can reduce customer costs.
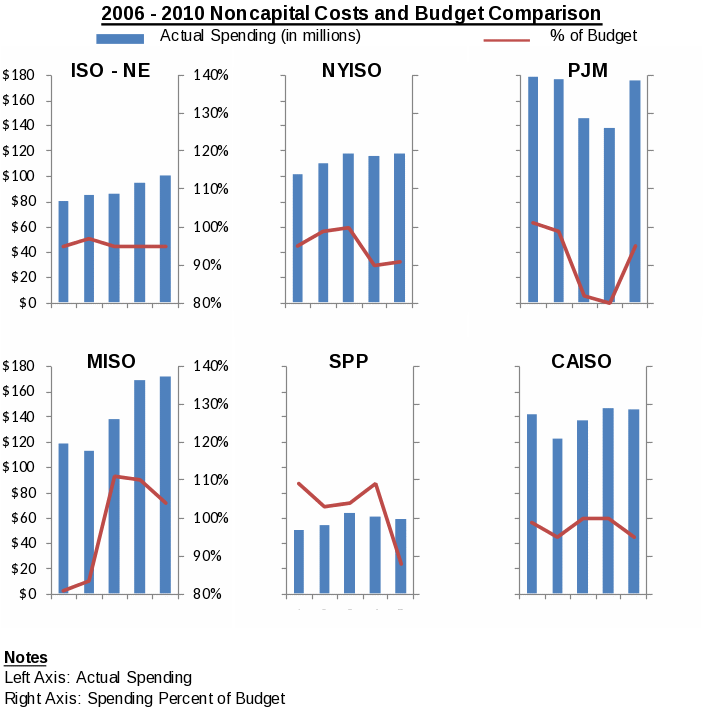
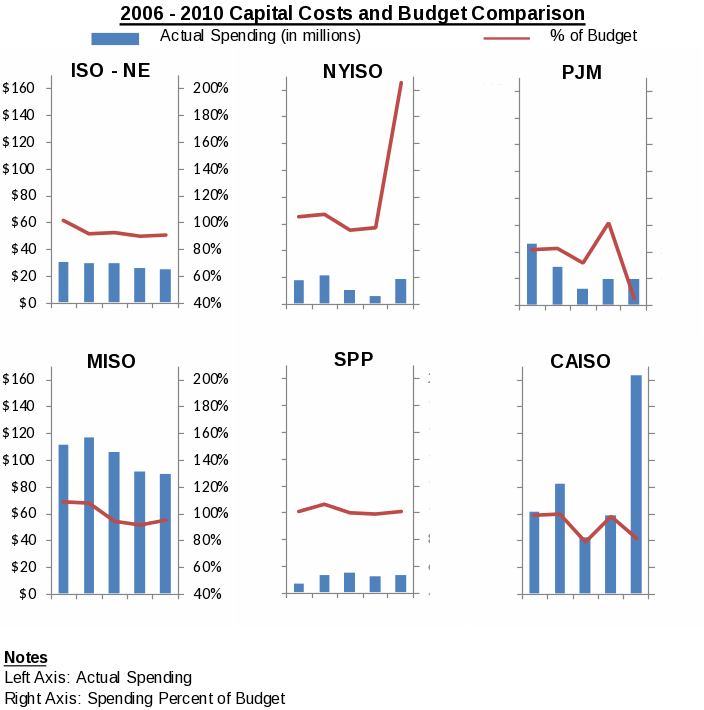
The pertinent analysis of the data shown on the accompanying chart is the trend in costs over the 2006–2010 for each ISO or RTO. Direct comparisons between the ISOs and RTOs are not meaningful. While administrative costs vary widely across the ISOs and RTOs, from 20 cents per megawatt-hour for SPP up to over $1 dollar per megawatt-hour for ISO-NE, these cost differences are primarily attributable to the differences in the responsibilities of the various ISOs and RTOs. For example, during the 2006–2010 period, eastern ISOs and RTOs managed day-two energy and reserve markets as well as capacity markets, thereby increasing their administrative costs, compared to an RTO such as SPP that only managed a day-one energy market and did not manage a capacity market. With respect to the second metric, which compares actual costs to budgeted amounts, this comparison is shown for noncapital (operations and maintenance costs) and capital costs (capital charges, debt service, interest expense and depreciation expense) on the charts below.
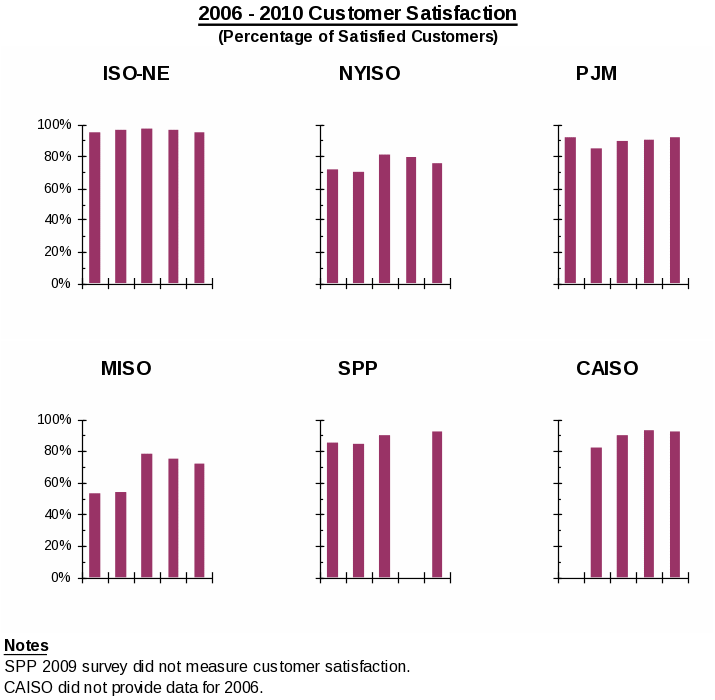
The percentage of satisfied members metric, based on an independent assessment of customer satisfaction, provides an indication of the extent to which ISOs and RTOs provide value to their customers. The independent assessments of customer satisfaction are based on surveys undertaken by independent, third-party entities. These surveys analyze customer perspectives on a wide range of ISO and RTO activities. Results of the customer satisfaction surveys are shown on the charts below.
This metric indicates the accuracy and integrity of the ISO and RTO billing processes, based on audits conducted according to the Statement on Auditing Standards No. 70 (SAS 70) guidelines set by the American Institute of Certified Public Accountants. The audits describe the controls, the results of testing of the ISO and RTO controls, whether the controls were designed to achieve the control objectives, the auditor’s opinions on the audit and whether the controls that were tested operated with sufficient effectiveness to provide reasonable assurance that the control objectives were achieved.
There are two types of SAS 70 audits: Type 1 audits, which assess the adequacy of the control design, and Type 2 audits, which review both the adequacy of the control design and whether the controls are being followed. An unqualified opinion indicates that the independent auditor found the control objectives for each of the areas covered by the audit to be adequately designed and operated for the audit period. A qualified opinion means the independent auditor found the design and/or the operation of one or more of the control objectives inadequate. In this case, specific inadequate control objective(s) are identified and the remaining control objectives covered by the audit are deemed adequate. Audit results are shown in the table below.
2006 – 2010 Billing Control Audits
ISO/RTO |
2006 |
2007 |
2008 |
2009 |
2010 |
CAISO |
Unqualified (Type 2) |
Qualified (Type 2) |
Qualified (Type 2) |
Unqualified (Type 1 and Type 2) |
Unqualified (Type 2) |
ISO-NE |
Unqualified (Type 2) |
Unqualified (Type 2) |
Unqualified (Type 2) |
Unqualified (Type 2) |
Unqualified (Type 2) |
NYISO |
Unqualified (Type 2) |
Unqualified (Type 2) |
Unqualified (Type 2) |
Unqualified (Type 2) |
Unqualified (Type 2) |
MISO |
Unqualified (Type 2) |
Qualified (Type 2) |
Unqualified (Type 2) |
Unqualified (Type 2) |
Unqualified (Type 2) |
PJM |
Unqualified (Type 2) |
Unqualified (Type 2) |
Unqualified (Type 2) |
Unqualified (Type 2) |
Unqualified (Type 2) |
SPP |
Qualified (Type 2) |
Qualified (Type 2) |
Qualified (Type 2) |
Qualified (Type 2) |
Unqualified (Type 2) |
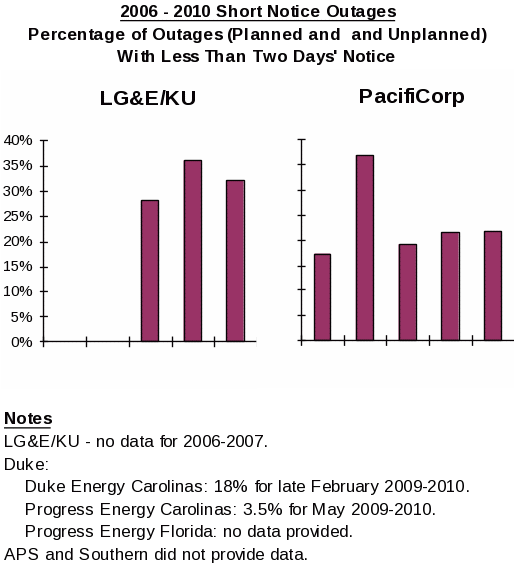
In addition to the common metrics for transmission outages discussed above, utilities outside of ISO and RTO markets measure the performance of their outage coordination in terms of the percentage of outages, planned and unplanned, with less than two days’ notice. A low percentage of short-notice outages indicates effective transmission coordination. Data on this metric is provided on the charts below.
As part of the performance metrics for long-term reliability transmission planning, utilities outside of ISO and RTO markets provided information on the dollar amount of facilities approved to be constructed for reliability purposes and discussions of their stakeholder processes. With regard to the dollar amount metric, the utilities submitted the following information.
Transmission Capital Investment ($Millions)
Entity |
2006 |
2007 |
2008 |
2009 |
2010 |
Duke |
$264 |
$286 |
$399 |
$404 |
$401 |
Southern |
$514 |
$447 |
$375 |
$334 |
$500 |
Net Cost of Approved Reliability Projects ($Millions)
Entity |
2006 |
2007 |
2008 |
2009 |
2010 |
PacifiCorp |
$1 |
$6 |
$50 |
$102 |
$133 |
APS reported an estimated cost of $639 million over the 2006-2010 period for projects that had been granted Certificates of Environmental Compatibility by the Arizona Corporation Commission. LG&E/KU did not provide data.
With regard to the stakeholder process, the purpose of this evaluation is to provide insights into the efficacy of each transmission provider’s planning process. Highlights from the discussions include the following:
Subsidiaries of Duke participate in the North Carolina Transmission Planning Collaborative, the Florida Reliability Coordinating Council, Inc. Regional Transmission Planning Process and various SERC Reliability Corporation groups associated with reliability assessments. Stakeholders have the opportunity to propose alternatives to projects included in the expansion plans as well as sensitivity analyses. Stakeholders in these processes include transmission-dependent utilities, public service commission staff, federal and state regulatory representatives and non-governmental organizations.
Southern participates in the SERC transmission planning process. In this process, stakeholders (transmission owners/operators, transmission service customers, cooperatives, municipals, power marketers, generator owners/developers, ISOs/RTOs, and demand response resources) establish and participate in a regional planning stakeholder group. Additional stakeholders in the process may include transmission-dependent utilities, public service commission staff, federal and state regulatory representatives and non-governmental organizations. The purpose of the regional planning stakeholder proceedings is to solicit stakeholder feedback and represent multiple stakeholder groups in focused interactions and dialogue with project sponsors.
LG&E/KU coordinates transmission planning with a Stakeholder Planning Committee. Membership in the Stakeholder Planning Committee is open to all interested parties and is comprised of transmission customers, load-serving entities and municipal organizations.
PacifiCorp participates in the regional planning process of the Northern Tier Transmission Group. PacifiCorp’s description of its transmission planning process outlines a process for stakeholders to provide input and bring forth those transmission needs driven by public policy requirements and commits PacifiCorp to participate in a regional transmission planning process. Stakeholders in this planning process include network customers (Bonneville Power Administration, Deseret Generation and Transmission Cooperative, Utah Municipal Power Agency, and Utah Associated Municipal Power Systems), generation developers, state public utility commissioners, and public interest groups.
APS participates in regional planning organizations and the WestConnect organization. APS is also a member of WECC and Southwest Area Transmission Planning group. APS provides an opportunity for other entities to participate in future planned projects through the annual planning process. These entities include FERC-jurisdictional and non-jurisdictional utilities, state utility regulatory bodies, generator developers, transmission line project developers, consumer advocates, and individual customers.
The interconnection and transmission service request metric measures the number of transmission access or transmission service denials. The purpose of this metric is to provide information on the magnitude and reasons for transmission service denials and whether additional infrastructure investment is needed to avoid transmission service denials. Results are shown on the table below.
2006 – 2010 Transmission Service Requests Denied
Entity |
2006 |
2007 |
2008 |
2009 |
2010 |
APS |
6 |
6 |
0 |
3 |
1 |
Duke |
3 |
9 |
12 |
28 |
26 |
LG&E/KU |
1208 |
985 |
704 |
237 |
1574 |
PacifiCorp |
2 |
0 |
1 |
2 |
0 |
Southern |
6 |
19 |
13 |
1 |
0 |
Notes
Duke, Southern and APS count refused requests only. LG&E/KU denials were due to insufficient flowgate capacity. PacifiCorp denials were due to incomplete applications.
These metrics require the following discussions: (1) a comprehensive explanation of the nature of utility demand response programs implemented to manage load and to comply with state requirements; and (2) a discussion of programs to facilitate the integration of renewable resources and to mitigate any issues and uncertainty associated with scheduling renewable resources.
Each responding utility had several demand response programs in operation during the 2006–2010 period. Highlights of the demand response discussions are as follows:
PacifiCorp’s demand response programs11 provided a maximum curtailment capability of 738 megawatts.
LG&E/KU demand response programs provided 180 megawatts of curtailment capability.
APS demand response programs reduced summer peak loads by over 100 megawatts.
Duke and Southern discussed their demand response programs and provided links to these programs on their respective corporate websites.
Utility programs to integrate renewable resources include the following:
PacifiCorp used automatic generation control on its resources to facilitate the integration of renewable resources and it participated in the joint initiative that developed tools such as the intra-hour transaction accelerator platform and dynamic scheduling system to assist in the integration of renewable resources.
APS required its generation to follow ramping events of wind generators and anticipates adding gas-fired peak generators to compensate for the intermittency of multiple types of renewable energy generation.
Congestion represents the cost to customers of paying for more expensive energy because physical transmission line limits do not allow full delivery of least-cost energy. Entities responding to this metric were required to provide a congestion analysis consistent with Order No. 890.12 In Order No. 890, the Commission adopted a planning principle requiring transmission providers to prepare studies identifying “significant and recurring” congestion and to post such studies on their Open Access Same-Time Information Systems (OASIS). The Commission explained that these studies should analyze and report on the following items: (1) location and magnitude of the congestion; (2) possible remedies for the elimination of the congestion, in whole or in part; (3) associated costs of congestion; and (4) costs associated with relieving congestion through system enhancements (or other means).13
All responding utilities cited information provided in their tariff descriptions of their transmission planning processes and some of them provided explanations of their programs to address congestion issues, including planning processes, stakeholder processes and studies undertaken in their regions to minimize congestion, as follows:
PacifiCorp discussed the congestion analysis done by the WECC Transmission Expansion Planning Policy Committee and the role played by PacifiCorp’s Energy Gateway Project in alleviating congestion.14
LG&E/KU explained that the primary causes of congestion on its system are non-firm transfers and generating unit commitments. LG&E/KU also described the components of its planning process.15
Duke and Southern explained how their transmission planning processes are designed to minimize congestion and the role of congestion studies in regional planning processes.16
This metric measures interrupted load megawatt hours as a percentage of megawatt hours of load served. Duke, Southern and APS reported zero interruptions over the 2006–2010 period. LG&E/KU and PacifiCorp did not have information on interruptions. PacifiCorp, however, reported system availability between 99.9108 percent and 99.9532 percent for the 2006–2010 period based on Form OE-417 data.
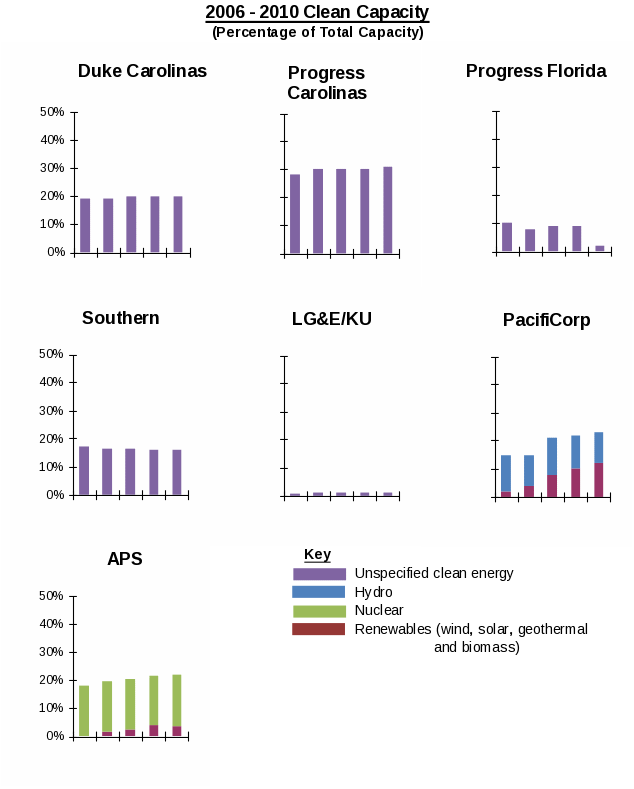
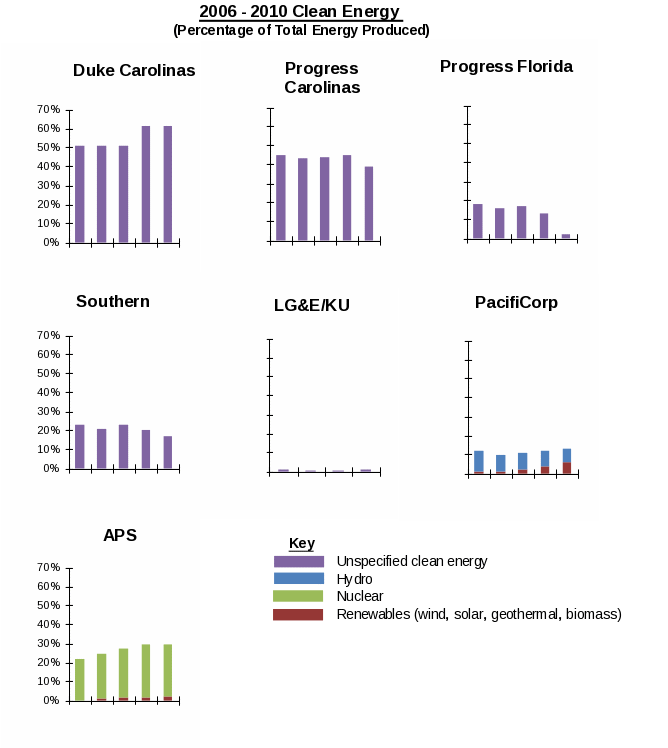
The clean energy17 metrics track the megawatt capacity of clean energy, by resource type, as a percentage of total capacity, and the megawatt-hours of clean energy, by resource type, as a percentage of total energy. This information is provided on the accompanying charts.
In the Commission Staff Report on performance metrics in regions outside ISOs and RTOs, Commission Staff proposed that utilities provide a price metric on their wholesale power sales based on a single, average price for energy and capacity, in addition to reporting peak and off-peak prices. Commission Staff requested that participating utilities discuss their perspectives on a wholesale price metric.18 Several of the utilities (APS, Duke, Southern) responded that a single, annualized average price metric would not provide useful performance information and PacifiCorp noted that the averaging of data may mask pertinent information. PacifiCorp also questions whether the Commission’s proposal to obtain and collect data concerning wholesale prices is intended to measure the health of wholesale markets, or intended to identify instances of bad behavior by market participants. Southern and APS disagreed with the premise that a single price metric, applicable to all wholesale market models, can be developed. APS stated that a single, annualized price will not be useful without a detailed and time-consuming analysis of individual transaction data. Duke indicated that the challenges of comparing wholesale market prices in the Southeast with organized ISO/RTO market prices preclude the ability to construct a meaningful common metric.19
We continue to believe that a price metric for utilities outside RTO regions would provide a basis for comparing cost trends between RTOs and areas outside RTOs. In response to PacifiCorp regarding the intended purpose of a price metric, we emphasize that such a metric would be useful in measuring the health of wholesale markets. As discussed in the Commission Staff Report, information on a price metric would be useful in assessing the performance of utilities in pricing their products competitively. We encourage participating utilities to develop price metrics that are meaningful. For example, price metrics could be developed for comparable products, such as peak, off-peak and year-round capacity and energy and these product prices could then be volume-weighted into an average price. Accordingly, we repeat our request for data, even if the information is not directly comparable to RTOs.
Appendix A
Common Metrics
Performance Metric |
Specific Metric(s) |
||
Reliability |
|||
A. |
NERC Reliability Standards Compliance |
1. References to which NERC standards are applicable 2. Number of violations self-reported and made public by NERC/FERC 3. Number of violations identified and made public as NERC audit findings 4. Total number of violations made public by NERC/FERC 5. Severity level of each violation made public by NERC/FERC 6. Compliance with operating reserve standards 7. Unserved energy (or load shedding) caused by violations. Additional detail will be provided on (1) number of events; (2) duration of the events; (3) whether the events occurred during on/off-peak hours; (4) additional information on equipment types affected and kV of lines affected; and (5) number of events (and severity and duration of events) resulting in load shedding based on the utilization of TPL-002 Footnote b criteria.
Utilities outside ISO and RTO regions should limit reporting to the same eight functional areas used by the ISOs and RTOs:
|
|
Performance Metric |
Specific Metric(s) |
||
B. |
Dispatch Reliability |
1. Balancing Authority ACE Limit (BAAL) or CPS1 and CPS2
2. Energy Management System (EMS) availability |
|
C. |
Load Forecast Accuracy |
Actual peak load as a percentage variance from forecasted peak load
|
|
D. |
Wind Forecasting Accuracy
|
Actual wind availability compared to forecasted wind availability |
|
E. |
Unscheduled Flows |
Difference between net actual interchange (actual measured power flow in real time) and the net scheduled interchange in megawatt hours
|
|
F. |
Transmission Outage Coordination |
1. Percentage of ≥ 200 kV planned outages of 5 days or more for which ISO, RTO or utility notified customers at least 1 month prior to the outage commencement date.
2. Percentage of ≥ 200kV outages cancelled by utility after being approved previously.
|
|
G. |
Long-Term Reliability Planning – Transmission |
2. Percentage of approved construction projects on schedule and completed
3. Performance of planning process related to: a. Completion of reliability studies b. Completion of economic studies
|
|
Performance Metric |
Specific Metric(s) |
||
H. |
Long-Term Reliability Planning – Resources |
1. Processing time for generation interconnection requests
2. Actual reserve margins compared with planned reserve margins
|
|
I. |
Interconnection and Transmission Process Metrics |
1. Number of requests 2. Number of studies completed
3. Average age of incomplete studies
4. Average time for completed studies
5. Total cost and types of studies completed (e.g., feasibility study, system impact study and facility study)
|
|
J. |
Special Protection Systems |
1. Number of special protection systems 2. Percentage of special protection systems that responded as designed when activated
3. Number of unintended activations
|
|
Performance Metric |
Specific Metric(s) |
|
System Operations Measures |
||
A. |
System Lambda |
System Lambda (on marginal unit)
|
B. |
Resource Availability |
1 - System forced outage rate as measured over 12 months |
C. |
Fuel Diversity |
Fuel diversity in terms of energy produced and installed capacity |
Appendix B
List of Participants
List of Participants In The Metrics Initiative
Allegheny Power and Allegheny Energy Supply Company, LLC
American Public Power Association
American Wind Energy Association
Arizona Public Service Company
California Department of Water Resources State Water Project
California Independent System Operator Corporation
California Public Utilities Commission
City of Redding, City of Santa Clara and M-S-R Public Power Agency
COMPETE Coalition
Consumer Commenters20
DC Energy, LLC
Delaware Municipal Electric Corporation, Inc.
Dominion Resources Services, Inc.
Duke Energy Corporation
Edison Electric Institute
Eastern Massachusetts Consumer-Owned Systems21
Electric Power Supply Association
Electricity Consumers Resource Council
Federal Trade Commission
FirstEnergy Service Company
Internal Market Monitor of ISO New England Inc.
ISO/RTO Council
Independent Power Producers of New York, Inc.
Indicated New York Transmission Owners22
International Transmission Company
Kentucky Utilities Company
Louisville Gas and Electric Company
Maine Public Utilities Commission
Maryland Public Service Commission
Attorney General of the Commonwealth of Massachusetts
MidAmerican Energy Company
Midcontinent Independent System Operator, Inc.
Midwest ISO Transmission Owners23
Missouri Public Service Commission
Multiple Transmission-Dependent Public Power Systems24
National Association of Regulatory Utility Commissioners
National Association of State Utility Consumer Advocates
National Grid USA
National Rural Electric Cooperative Association
New England Conference of Public Utility Commissioners
ISO New England Inc.
New England Power Generators Association, Inc.
New England Power Pool Participants Committee
New England States Committee on Electricity
New Jersey Department of the Public Advocate, Division of Rate Counsel
New Hampshire Public Utilities Commission
New York Independent System Operator, Inc.
New York State Public Service Commission
Northwest & Intermountain Power Producers Coalition
Public Utilities Commission of Ohio
Office of the Ohio Consumers’ Counsel
Old Dominion Electric Cooperative
Organization of MISO States
Pacific Gas and Electric Company
PacifiCorp
Pennsylvania Public Utility Commission
Pepco Holdings, Inc.
PJM Interconnection, L.L.C.
PJM Power Providers Group
Public Systems25
Retail Energy Supply Association
Southern Company
Southern California Edison Company
Southwest Power Pool, Inc.
Steel Producers Association26
Transmission Agency of Northern California
Transmission Access Policy Study Group
Tyrone J. Christy, Vice Chairman, Pennsylvania Public Utility Commission
United Illuminating Company
Viridity Energy, Inc.
Westar Energy, Inc.
1 Throughout this report, staff uses the term “utilities” to mean utilities in regions outside ISO and RTO markets.
2 The final common metrics are listed in Appendix A.
1 Participants in the Metrics Initiative are listed in Appendix B.
2 Performance Metrics For Independent System Operators and Regional Transmission Organizations, Docket No. AD10-5-000, at 5 (Apr. 2011); see also 2010 ISO/RTO Performance Metrics Commission Report, Docket No. AD10-5-000 (Oct. 21, 2010).
3 Performance Metrics In Regions Outside ISOs and RTOs Commission Staff Report, Docket No. AD12-8-000 (Oct. 15, 2012).
4 Although these reports were filed in one document, this Commission Staff report refers to each ISO’s or RTO’s separate section of that joint document (i.e., SPP Report at 323).
5 Duke Energy Corporation provided metrics information for the following subsidiaries: Duke Energy Carolinas, LLC (Duke Energy Carolinas), Carolina Power & Light Company d/b/a Progress Energy Carolinas, Inc. (Progress Energy Carolinas) and Florida Power Corporation, d/b/a Progress Energy Florida, Inc. (Progress Energy Florida).
6 PacifiCorp provided metrics information for the following subsidiaries: PacifiCorp-West (serving California, Oregon and Washington) and PacifiCorp-East (serving Idaho, Utah and Wyoming).
1 A full listing of the NERC Reliability Standards is provided at http://www.nerc.com/page.php?cid=2|20 (last visited Aug. 26, 2014).
2 These metrics are numbered 1 – 6 on the metrics table in Appendix A.
3 Control Performance Standard 1 is a statistical measure of Area Control Error variability. This standard measures Area Control Error in combination with the Interconnection’s frequency error. It is based on an equation derived from frequency-based statistical theory. Control Performance Standard 2 is a statistical measure of Area Control Error magnitude. The standard is designed to limit a control area’s unscheduled power flows.
4 SPP Report at 323.
5 Duke Report at 8.
6 See, e.g., ISO-NE Report at 80; APS Report at 8.
7 NYISO Report at 212-13. NYISO has undertaken a regional initiative to address Lake Erie loop flows.
8 ISO-NE Report at 81.
9 See PJM Report at 272.
10 LG&E/KU Report at 7-8.
11 Southern Report at 25.
12 ISO-NE Report at 90; MISO Report at 162.
13 This practice is referred to as “parking” in the industry.
14 LG&E/KU had 111 requests. However, these requests were only for system impact and facilities studies resulting from transmission service requests. See LG&E/KU Report at 13-14.
15 Special Protection Systems are also referred to as Special Protection Schemes, Remedial Action Schemes or System Integrity Protection Schemes.
16 Since resource availability is calculated as a percentage, the calculation is 100 percent minus the forced outage rate, expressed as a percentage.
1 The definition of the price-cost mark-up is the load-weighted average mark-up on the cost-based offer divided by the load-weighted price offer, expressed as a percentage.
2 See, e.g., CAISO Report at 50; MISO Report at 175; SPP Report at 337.
3 The cost break-down includes the following cost categories: ISO or RTO costs and regulatory fees, operating reserve costs, ancillary services costs, transmission costs, capacity costs, and energy costs.
4 MISO Report at 181.
5 ISO-NE Report at 114.
6 NYISO Report at 234.
7 PJM Report at 295.
8 Specifically, April 1, 2009 through December 31, 2009.
9 CAISO Report at 56; ISO-NE Report at 117-18; MISO Report at 183; NYISO Report at 238; PJM Report at 299-300; SPP Report at 344.
10 Renewable resources are defined as solar, wind, hydro, geothermal, and biomass resources.
11 These are irrigation load control, energy exchange load shaving, air conditioner direct load control, and industrial agreements.
12 Preventing Undue Discrimination and Preference in Transmission Service, Order No. 890, FERC Stats. & Regs. ¶ 31,241, order on reh’g, Order No. 890-A, FERC Stats. & Regs. ¶ 31,261 (2007), order on reh’g, Order No. 890-B, 123 FERC ¶ 61,299 (2008), order on reh’g, Order No. 890-C, 126 FERC ¶ 61,228, order on clarification, Order No. 890-D, 129 FERC ¶ 61,126 (2009).
13 Order No. 890, FERC Stats. & Regs. ¶ 31,241 at PP 529, 542.
14 PacifiCorp Report at 50-52.
15 LG&E/KU Report at 17-18.
16 Duke Report at 40-41; Southern Report at 32-33.
17 Clean energy is defined to include nuclear energy, solar, wind, hydro, geothermal, landfill, and biomass resources.
18 Performance Metrics In Regions Outside ISOs and RTOs Commission Staff Report, Docket No. AD12-8-000 at 14 (Oct. 15, 2012).
19 See APS Report at 28; Duke Report at 46-47; Southern Report at 13; PacifiCorp Report at 63.
20 AARP, American Forest & Paper Association, American Municipal Power, Inc., American Public Power Association, Blue Ridge Power Agency, Citizen Power, Citizens Utility Board, Coalition of Midwest Transmission Customers, Connecticut Office of Consumer Counsel, Electricity Consumers Resource Council, Illinois Attorney General, Industrial Energy Consumers of America, Kennebunk Light & Power District, Maryland Office of People’s Counsel, Modesto Irrigation District, Municipal Electric Utilities Association of New York, National Consumer Law Center, NEPOOL Industrial Customer Coalition, Northeast Public Power Association, New York Association of Public Power, Office of the People’s Counsel for the District of Columbia, Ohio Partners for Affordable Energy, Pennsylvania Office of Consumer Advocate, PJM Industrial Customer Coalition, Public Citizen, Public Power Association of New Jersey, Public Utility Law Project of New York, Inc., and Virginia Citizens Consumer Council.
21 Belmont Municipal Light Department, Braintree Electric Light Department, Hingham Municipal Lighting Plant, Reading Municipal Light Department, Taunton Municipal Lighting Plant, and Wellesley Municipal Lighting Plant.
22 Central Hudson Gas & Electric Corporation, Consolidated Edison Company of New York, Inc., Long Island Power Authority, New York Power Authority, New York State Electric & Gas Corporation, Orange and Rockland Utilities, Inc., and Rochester Gas and Electric Corporation.
23 Ameren Services Company, as agent for Union Electric Company d/b/a AmerenUE, Central Illinois Public Service Company d/b/a AmerenCIPS, Central Illinois Light Co. d/b/a AmerenCILCO, and Illinois Power Company d/b/a AmerenIP; American Transmission Company LLC; City of Columbia Water and Light Department (Columbia, MO); City Water, Light & Power (Springfield, IL); Duke Energy Corporation for Duke Energy Ohio, Inc., Duke Energy Indiana, Inc., and Duke Energy Kentucky, Inc.; Great River Energy; Hoosier Energy Rural Electric Cooperative, Inc.; Indiana Municipal Power Agency; Indianapolis Power & Light Company; International Transmission Company d/b/a ITCTransmission; ITC Midwest LLC; Michigan Electric Transmission Company, LLC; Michigan Public Power Agency; MidAmerican Energy Company; Minnesota Power (and its subsidiary Superior Water, L&P); Montana-Dakota Utilities Co.; Northern Indiana Public Service Company; Northern States Power Company, a Minnesota corporation, and Northern States Power Company, a Wisconsin corporation, subsidiaries of Xcel Energy Inc.; Northwestern Wisconsin Electric Company; Otter Tail Power Company; Southern Illinois Power Cooperative; Southern Indiana Gas & Electric Company (d/b/a Vectren Energy Delivery of Indiana); Southern Minnesota Municipal Power Agency; Wabash Valley Power Association, Inc.; and Wolverine Power Supply Cooperative, Inc.
24 Public Works Commission of the City of Fayetteville, North Carolina, Lafayette Utilities System, and City of Orangeburg, South Carolina.
25 Connecticut Municipal Electric Energy Cooperative, Massachusetts Municipal Wholesale Electric Company and New Hampshire Electric Cooperative, Inc.
26 Steel Dynamics and Nucor Steel.
| File Type | application/vnd.openxmlformats-officedocument.wordprocessingml.document |
| File Modified | 0000-00-00 |
| File Created | 2021-01-26 |
© 2026 OMB.report | Privacy Policy
