CES Confidence Interval Chart Survey
Department of Labor Generic Solution for Outreach Activities
1225-0059 CES Confidence Interval Customer Satisfaction Survey Charts
CES Confidence Interval Chart Survey
OMB: 1225-0059
Attachment 1 – Charts to be compared


Attachment 2 – Draft Survey Questionnaire
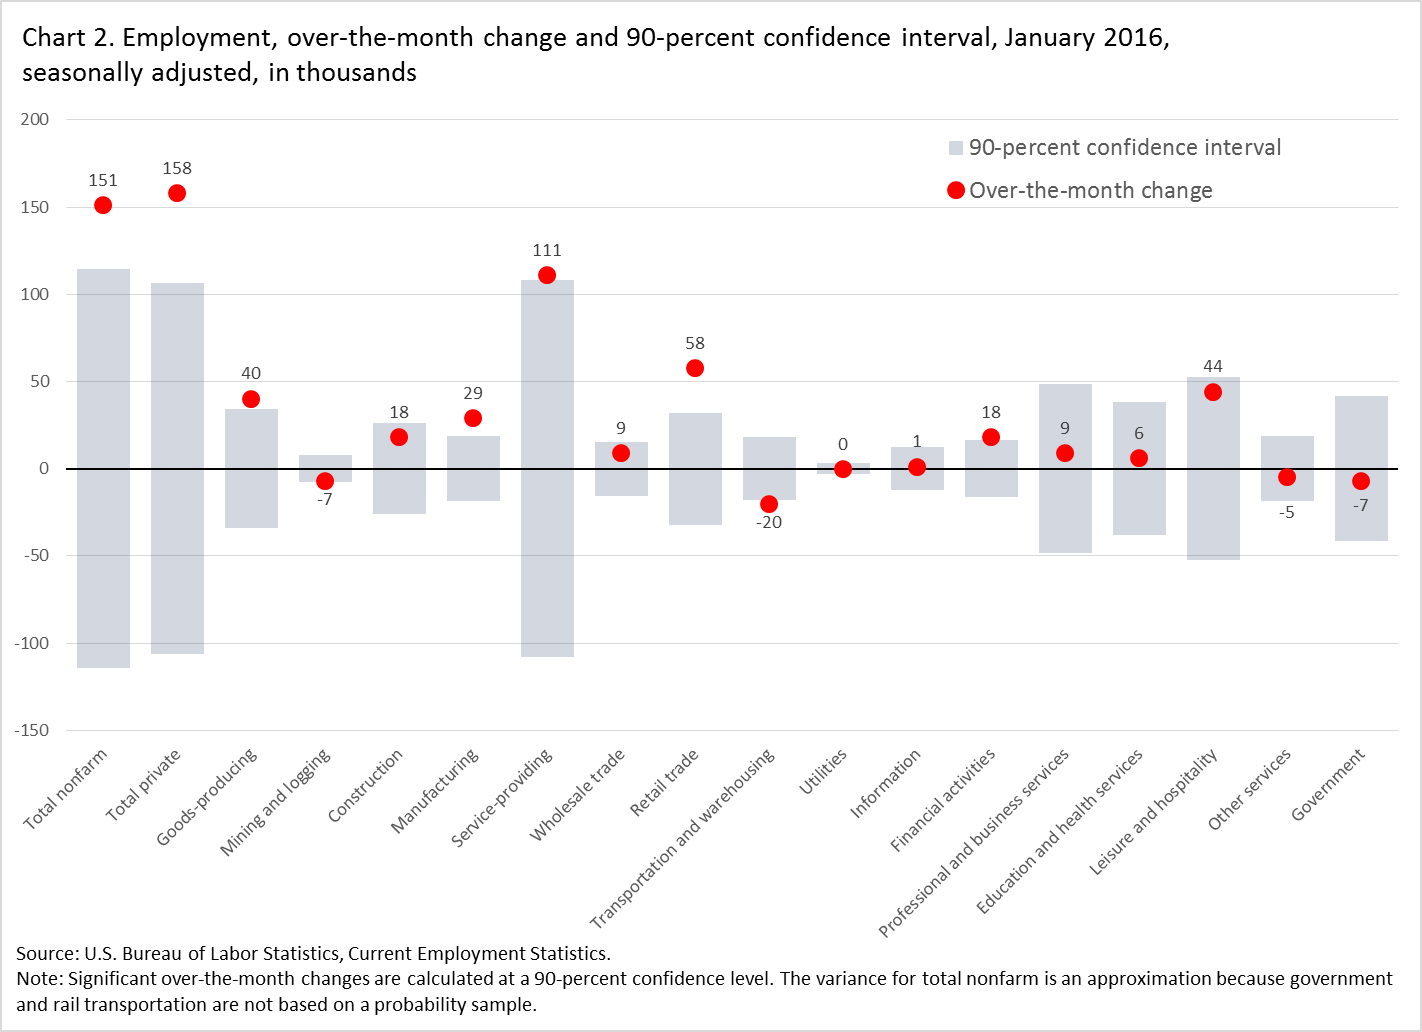
The Bureau of Labor Statistics (BLS) would like your opinions about two different graphical approaches for showing month-to-month changes in employment for major industries, using a 90 percent confidence interval.
Your participation in this survey is voluntary. We estimate that it will take you 5 minutes to complete
this survey. We are collecting this information under OMB Number 1225-0059. Without this currently approved
number, we could not conduct this survey. (Expiration: April 30, 2018).
We appreciate your time and help. Thank you!
This survey is being administered by SurveyMonkey.com and resides on a server outside of the BLS
domain. Since the BLS cannot guarantee the protection of survey responses, we advise against
including any sensitive or personal information.
Which chart do you prefer? (must choose 1)
Chart 1. (optional box for why/why not preferred)
Chart 2. (optional box for why/why not preferred)
Is a chart of this type useful to you? (must choose 1)
Yes (if yes, How is it useful?) (mark all that apply)
Can easily see how the variability of estimates differs among supersectors
Can compare net changes in employment in supersectors more easily than in a table
Can identify statistically significant changes more quickly
Can see big picture of the economy
Can share these charts with others to improve communication
Other – please explain
No (optional box for why not)
Which of the following best describes how you use BLS data? (must choose 1)
Basic user: Occasionally accesses the BLS website to obtain economic statistics. Uses BLS news releases and data tables as is.
Intermediate user: Accesses the BLS website to obtain economic statistics, as well as data tables or charts for other uses. Occasionally uses data-retrieval tools such as the one-screen data search.
Super user: Accesses a wide range of BLS statistics. Comfortable using a range of BLS data tables and charts and often uses data-retrieval tools such as one-screen or multi-screen data search.
Are there any other methods of displaying this data that you would suggest? (must choose 1)
Yes – please explain
No
Would you like to see this chart updated monthly or annually? (must choose 1)
Monthly
Annually
No opinion
If we produce this type of chart, where would you look for it? (must choose 1; provide link to each example)
CES news release
CES highlights
CES tables and charts page
All of the above
I don’t know
| File Type | application/msword |
| File Title | SUPPORTING STATEMENT FOR |
| Author | kurz-karin |
| Last Modified By | McGee, Keisha L - OASAM OCIO CTR |
| File Modified | 2016-05-23 |
| File Created | 2016-05-23 |
© 2026 OMB.report | Privacy Policy