Appendix E Publishing paper
Appendix E EDSCLS Benchmarking Study 2016 Reporting Position Paper.docx
ED School Climate Surveys (EDSCLS) Benchmark Study 2017 Update
Appendix E Publishing paper
OMB: 1850-0923

Contents
2.Survey Administration Support Reporting Features 3
2.1.1 Total Number of Log-in Credentials Generated 3
2.1.2 Total Number of Unused Log-in Credentials 4
2.1.3 Total Number of Log-ins, Not Yet Submitted 4
2.1.4 Total Number of Survey Submissions 4
2.1.5 Survey Submission Rate 4
2.1.6 Case Disposition Detail 6
2.1.7 Case Disposition Detail Display 7
2.2 Survey Results Reporting Features 8
2.2.1 Item-Level Frequencies 8
2.2.6 Exporting of Reports ……..……………….……………………………………………………………………14
2.3 Scale Score Frequencies 13
2.3.1 Presentation of Scale Scores 13
2.3.4 Reporting of Schools and Districts 15
2.3.7 Reporting During the Pilot and Benchmark Phases……………………………………………...18
This document is one in a series of position papers that have been prepared as part of the development of the instruments and platform for the National Center for Education Statistics (NCES) School Climate Surveys (SCLS). In this paper, we detail the specifications for electronic reports that will be built into the SCLS platform to meet NCES’s goal of providing timely, user-friendly information to education agencies to assist in the collection and interpretation of school climate data.
This paper will serve as the foundation for the development of the SCLS reporting features. In the sections that follow, we present options and recommendations related to reporting features for both survey status reports and survey result reports.
The SCLS platform will be designed to provide real-time automated reports to assist education agencies in the survey administration process. These reports will provide education agencies with information regarding the status of all survey cases, including log-in status, survey submission status, and survey submission rate. These reports can be generated at the school, district, or state level, depending on the level of the education agency administering the survey.0
2.1 Survey Status Reports
Survey administrators can use the survey status reports throughout the field period to monitor the progress of the survey administration in real time. For example, a district-level administrator may monitor survey log-ins and submissions at the school level to identify schools in need of additional follow-up because of low levels of participation. A school administrator may note an unusually high number of cases in which respondents have logged in, but have not yet submitted the survey, and may follow up with staff to ensure that students are provided with adequate time to complete the survey. A survey administrator may review the submission rate for a school to determine whether to close the survey on schedule or to extend the data collection period. Furthermore, administrators who have manually created a crosswalk between student identifiers and student survey log-ins may use the detailed information on unused log-in credentials to ensure that all students are provided with the opportunity to complete the survey.
To meet these needs, the survey status reporting tool will provide real-time reports on the number of created log-in credentials, the number of log-ins, the number of submitted surveys, and the overall submission rate. Survey administrators will access the submission rate reporting tool through the survey administration dashboard described in the subtask 8 position paper on the functional design of the platform. Each feature of the reporting tool is described below in more detail.
2.1.1 Total Number of Log-in Credentials Generated
For each survey being administered (i.e., student, parent, instructional staff, or non-instructional staff), the number of log-in credentials that have been generated will be shown. Depending on the survey administration level, the total number of log-in credentials can be displayed at the school, district, or state level.
2.1.2 Total Number of Unused Log-in Credentials
Log-in credentials that have been assigned but not used to access the survey will be displayed in the survey status report. This will provide administrators with an estimate of the number of respondents who have not yet attempted to take the survey.
2.1.3 Total Number of Log-ins, Not Yet Submitted
Once a log-in credential is used to log in to a survey, the case will be assigned a disposition status of “logged in, not submitted.” This status will include cases typically considered “partial completes.” Cases assigned this status may include those where respondents have logged in to the survey but not yet consented to participate, where respondents have consented to participate but not yet responded to any survey items, and where respondents have responded to survey items, but have not yet viewed the final “thank you” screen and completed the survey. This number will provide survey administrators with a count of the number of respondents who have started, but not yet finalized the survey.
2.1.4 Total Number of Survey Submissions
Cases that are assigned a disposition status of “submitted” include those where a respondent has logged in to the survey, consented to participate, and responded to all survey items, thereby completing the survey. Submissions also include finalized cases that do not meet the SCLS definition of a completed interview, including those where a respondent has declined to participate at the consent page and those where a respondent viewed all survey items and proceeded to the “thank you” screen, but did not provide valid responses to a sufficient number of items to be classified as a completed interview. This number will provide survey administrators with a count of the number of respondents who have finalized their survey.
The sum of the total number of unused log-in credentials; the total number of log-ins, not yet submitted; and the total number of survey submissions will equal the total number of log-in credentials generated.
2.1.5 Survey Submission Rate
To provide survey administrators with an estimate of the percentage of respondents who have finalized the survey, the survey status tool will also compute and display a survey submission rate.0 The survey submission rate is calculated as
100 * (S / C),
where S = the total number of survey submissions and C = the total number of log-in credentials generated for the survey.
The survey submission rate is not the same as a response rate, because the numerator of the survey submission rate includes completed interviews, refusals, and interviews that were submitted without sufficient valid responses to be designated as completed. Furthermore, the denominator includes all log-in credentials that were generated, regardless of whether the credential was ever assigned to a respondent. However, the survey submission rate can provide administrators with a measure of the overall survey progress and help identify the need for additional follow-up or an extension of the survey period.0
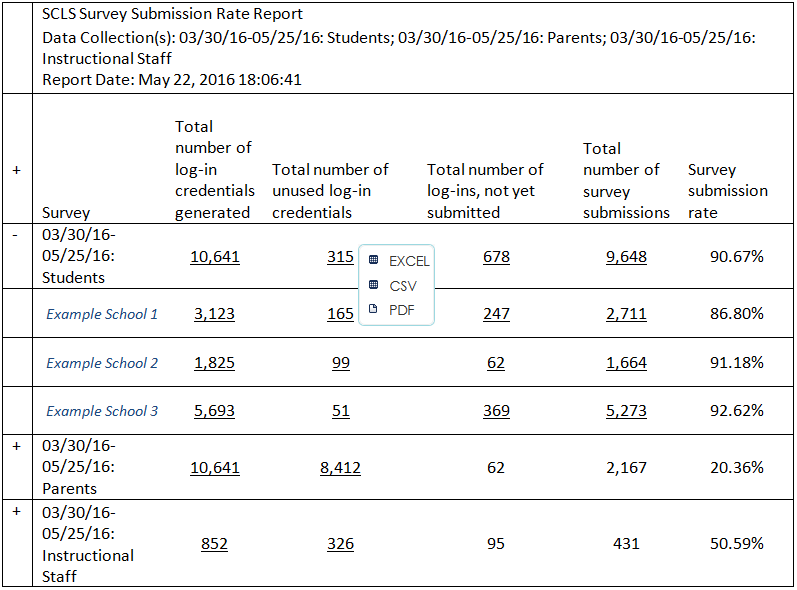
The survey status report will be displayed on screen as shown in figure 1, and administrators will have the option of exporting the report into the Microsoft Excel, CSV, or PDF formats.
Figure 1. SCLS survey submission report for single survey administration
|
SCLS Survey Submission Rate Report |
|
|
|
||
|
Data Collection(s): 03/30/16-05/25/16: Students |
|
|
|||
|
Report Date: May 22, 2016 18:06:41 |
|
|
|
||
|
|
|
|
|
|
|
+ |
Survey |
Total number of log-in credentials generated |
Total number of unused log-in credentials |
Total number of log-ins, not yet submitted |
Total number of survey submissions |
Survey submission rate |
+ |
SCLS Student Survey |
10,641 |
315 |
678 |
9,648 |
90.67 |
If an education agency is administering more than one survey, the information for each survey will be displayed separately, as shown in figure 2.
Figure 2. SCLS survey submission report for multiple simultaneous survey administrations
|
SCLS Survey Submission Rate Report |
|
|
|
||
|
Data Collection(s): 03/30/16-05/25/16: Students; 03/30/16-05/25/16: Parents; 03/30/16-05/25/16: Instructional Staff |
|||||
|
Report Date: May 22, 2016 18:06:41 |
|
|
|
||
|
|
|
|
|
|
|
+ |
Survey |
Total number of log-in credentials generated |
Total number of unused log-in credentials |
Total number of log-ins, not yet submitted |
Total number of survey submissions |
Survey submission rate |
+ |
03/30/16-05/25/16: Students |
10,641 |
315 |
678 |
9,648 |
90.67% |
+ |
03/30/16-05/25/16: Parents |
10,641 |
8,412 |
62 |
2,167 |
20.36% |
+ |
03/30/16-05/25/16: Instructional Staff |
852 |
326 |
95 |
431 |
50.59% |
For districts or states hosting the survey across schools, completion rate reports will be available for each school that participates in the survey (i.e., each school for which log-in credentials were produced). The school-level detail will be shown on screen by clicking on the display detail symbol (“+”). Figure 3 shows an example display for a survey with three participating schools. For each report, a display detail symbol (“+”) will be shown at the top left. Clicking on that symbol will display all associated detail.
Figure 3. SCLS survey submission report for multiple schools
|
SCLS Survey Submission Rate Report |
|
|
|
||
|
Data Collection(s): 03/30/16-05/25/16: Students; 03/30/16-05/25/16: Parents; 03/30/16-05/25/16: Instructional Staff |
|||||
|
Report Date: May 22, 2016 18:06:41 |
|
|
|
||
|
|
|
|
|
|
|
+ |
Survey |
Total number of log-in credentials generated |
Total number of unused log-in credentials |
Total number of log-ins, not yet submitted |
Total number of survey submissions |
Survey submission rate |
- |
03/30/16-05/25/16: Students |
10,641 |
315 |
678 |
9,648 |
90.67% |
|
Example School 1 |
3,123 |
165 |
247 |
2,711 |
86.80% |
|
Example School 2 |
1,825 |
99 |
62 |
1,664 |
91.18% |
|
Example School 3 |
5,693 |
51 |
369 |
5,273 |
92.62% |
+ |
03/30/16-05/25/16: Parents |
10,641 |
8,412 |
62 |
2,167 |
20.36% |
+ |
03/30/16-05/25/16: Instructional Staff |
852 |
326 |
95 |
431 |
50.59% |
2.1.6 Case Disposition Detail
While survey submission rates provide important information for survey administrators, follow- up strategies can benefit from accurate and up-to-date information about the status of each case. Providing education agencies with a means to determine which respondents have and have not logged in to the SCLS platform or submitted their survey can assist them in ensuring that each respondent has an opportunity to take the survey.
By clicking on the links built into the submission rate table (denoted with underlined text in figures 1, 2, and 3), a survey administrator can view a list of each log-in credential applicable to that status. For example, clicking on the number “315” in the table shown in figure 3 would prompt the SCLS platform to display a pop-up box (see figure 4) with options to export a list of all unused log-in credentials for the student survey.
Figure 4. SCLS case disposition report output options
If an education agency has manually created a link between log-in credentials and specific respondents, the case disposition reports can enable education agencies to identify those cases for which the respondent has not yet logged in to the survey (or in the case of students, cases where the respondent has logged in, but has not yet submitted the survey). Administrators can use this information to conduct targeted follow-up. For the student survey, the education agency may also use this information to make appropriate scheduling choices for computer resources.
2.1.7 Case Disposition Detail Display
Survey administrators may request reports for all log-in credentials for a survey or may request that the report be filtered to show selected dispositions.0 Figure 5 provides an example of a case disposition output report (i.e., the report that results from selecting an output option shown in figure 4) for all log-in credentials generated for a student survey, while figure 6 provides an example of a case disposition output report for all unused log-in credentials for a student survey.
Figure 5. SCLS case disposition report: All login credentials
SCLS Case Disposition Status Report – all login credentials Data Collection: 03/30/16-05/25/16: Students |
|
Report Date: May 22, 2016 18:06:41 |
|
|
|
Log-In credential |
Status |
Scklndckl |
Partial |
Asdklcncd |
Unused |
Slcdkmcds |
Unused |
Slkqqsdkj |
Unused |
Dklcndkm |
Complete |
Adckddvk |
Complete |
Sdlkvnvvm |
Partial |
Vvnkvvmk |
Complete |
Slvnlvknvk |
Complete |
Sdljdklnd |
Unused |
Figure 6. SCLS case disposition report: Unused login credentials
SCLS Case Disposition Status Report – unused login credentials Data Collection: 03/30/16-05/25/16: Students |
|
Report Date: May 22, 2016 18:06:41 |
|
|
|
Log-In credential |
Status |
Asdklcncd |
Unused |
Slcdkmcds |
Unused |
Slkqqsdkj |
Unused |
Sdljdklnd |
Unused |
2.2 Survey Results Reporting Features
The SCLS platform will have a built-in reporting dashboard that will allow education agencies to easily access survey results once a data collection is closed and data processing has been completed. These reports will provide simple graphical displays of data, evaluate and suppress results as needed to minimize disclosure risk, and be exportable into various formats for easy access and dissemination. In this section, we discuss the proposed item- and scale-level reports that will be available through the reporting dashboard.
2.2.1 Item-Level Frequencies
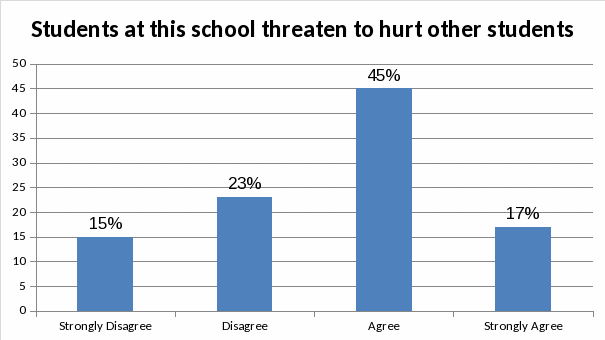
For each item in the SCLS surveys, means and frequency distributions will be displayed graphically. The graphical displays will include the item wording, response options, percentage of valid responses for each response option, and mean of the responses, displayed both numerically and using a vertical bar (see figures 7 and 8). The total number of valid responses (disclosure masked, as appropriate) may also be displayed. Frequency distributions will be available for each item with a sufficient number and variability of responses (see section 2.2.3 below on “suppression” for more information). To maximize clarity of presentation, on-screen reports will have graphs hidden by default, with a symbol (+) next to the item text to show the display. When the display graph symbol (“+”) is clicked, the graphical display for that item will appear below the item text, as in figure 8.0 When the graph is displayed, the “+” will be replaced with a new symbol, “-,” allowing the user to hide that graphical display again. Similar to the survey status reports, the survey result reports will have an option for the user to expand all graphs, by clicking on the “+” symbol at the top left of the report.
Figure 7. SCLS item-level report: Collapsed display
SCLS Item-Level Report |
|
|
|
|
|
|||||||||||
Data Collection: 03/30/16-05/25/16: Students |
|
|
|
|
|
|||||||||||
Report Date: May 22, 2016 18:06:41 |
|
|
|
|
|
|||||||||||
|
|
|
Percent |
|
|
|||||||||||
+ |
Item # |
Item |
Strongly
Agree |
Agree |
Disagree |
Strongly
Disagree |
Mean
Response |
|
||||||||
+ |
1 |
I worry about crime and violence at this school |
42 |
12 |
12 |
34 |
3.2 |
|||||||||
+ |
2 |
I feel safe at this school |
30 |
20 |
25 |
25 |
2.8 |
|||||||||
+ |
3 |
I sometimes stay home because I don’t feel safe at this school |
10 |
12 |
65 |
13 |
1.2 |
|||||||||
+ |
4 |
Students at this school carry guns or knives to school |
31 |
32 |
10 |
27 |
2.1 |
|||||||||
+ |
5 |
Students at this school belong to gangs |
20 |
20 |
20 |
40 |
1.3 |
|||||||||
+ |
6 |
Students at this school threaten to hurt other students |
15 |
23 |
45 |
17 |
1.2 |
|||||||||
Figure 8. SCLS item-level report: Expanded display
SCLS Item-Level Report |
|
|
|
|
|
||||||
Data Collection: 03/30/16-05/25/16: Students |
|
|
|
|
|
||||||
Report Date: May 22, 2016 18:06:41 |
|
|
|
|
|
||||||
|
|
|
Percent |
|
|||||||
+ |
Item # |
Item |
Strongly
Agree |
Agree |
Disagree |
Strongly
Disagree |
Mean
Response |
||||
+ |
1 |
I worry about crime and violence at this school |
42 |
12 |
12 |
34 |
3.2 |
||||
+ |
2 |
I feel safe at this school |
30 |
20 |
25 |
25 |
2.8 |
||||
+ |
3 |
I sometimes stay home because I don’t feel safe at this school |
10 |
12 |
65 |
13 |
1.2 |
||||
+ |
4 |
Students at this school carry guns or knives to school |
31 |
32 |
10 |
27 |
2.1 |
||||
+ |
5 |
Students at this school belong to gangs |
20 |
20 |
20 |
40 |
1.3 |
||||
- |
6 |
Students at this school threaten to hurt other students |
15 |
23 |
45 |
17 |
1.2 |
||||
|
|||||||||||
The graph shown above is one display option for item-level frequency distributions. Additional information, such as the number of respondents and the item-level response rate may be shown as well; however, the amount and type of information shown must lend itself to easy understanding and interpretation. Therefore, we recommend displaying only the frequency distributions. Examples of alternative options in which to display data and/or additional data points are presented below.
Figure 9 provides an alternative display option in which the item wording and frequency distribution of responses are displayed and the most popular response is indicated in bold. This option provides information simply and intuitively, although the display is tabular rather than graphical.
Figure 9. SCLS alternative item-level report: Option A

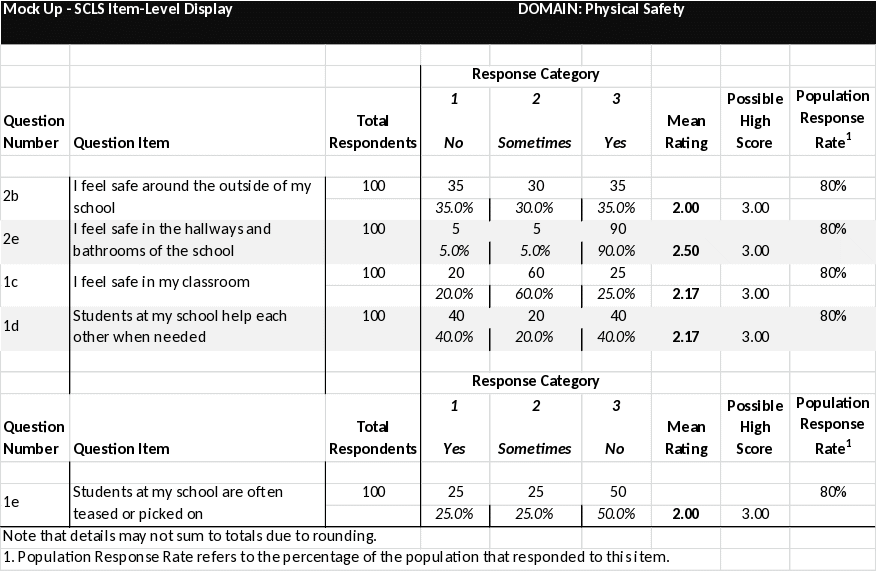
Figure 10 provides an alternative display option modeled after the New Jersey School Climate tool (http://www.nj.gov/education/students/safety/behavior/njscs/) that provides information on item wording, population size, response rate, number of responses in each category, and percentage responding in each category. While this option provides users with the most information, we recommend the format shown in figures 7 and 8 to ensure that the users of these reports can easily interpret the findings.
Figure 10. SCLS alternative item-level report: Option B
2.2.2 Ordering of Items
Clustering items by topical area will likely provide users with the quickest access to targeted information, regardless of the order of the items in the survey. We therefore recommend presenting items clustered by domain and subdomain and displayed within subdomains in survey order. For example, if survey items 1, 2, 3, 6, and 7 measure physical safety, the item-level frequency distribution reports may be displayed as shown in figure 11.
Figure 11. SCLS item-level report, displaying item clustering and order
Safety
+ Emotional Safety
- Physical Safety
SCLS Item-Level Report |
|
|
|
|
|||||||||||||
Data Collection: 03/30/16-05/25/16: Students |
|
|
|
|
|
||||||||||||
Report Date: May 22, 2016 18:06:41 |
|
|
|
|
|
||||||||||||
|
|
|
Percent |
|
|||||||||||||
+ |
Item # |
Item |
Strongly
Agree |
Agree |
Disagree |
Strongly
Disagree |
Mean
Response |
||||||||||
+ |
1 |
I worry about crime and violence at this school |
42 |
12 |
12 |
34 |
2.8 |
||||||||||
+ |
2 |
I feel safe at this school |
30 |
20 |
25 |
25 |
3.6 |
||||||||||
+ |
3 |
I sometimes stay home because I don’t feel safe at this school |
10 |
12 |
65 |
13 |
1.2 |
||||||||||
- |
6 |
Students at this school threaten to hurt other students |
15 |
23 |
45 |
17 |
1.2 |
||||||||||
|
|||||||||||||||||
+ |
7 |
Students at this school fight a lot |
10 |
15 |
23 |
52 |
1.1 |
||||||||||
2.2.3 Suppression
To protect the confidentiality of respondents, and to provide meaningful data, frequency distributions will not be shown for an item with fewer than 10 respondents. When the display graph symbol (“+”) for a suppressed item is clicked, “Item not shown due to disclosure risk” is displayed.
To protect respondent confidentiality, reporting by respondent subgroups (e.g., race/ethnicity, grade) will not be permitted for item-level frequency distributions. For district-level administrations, reporting by school will be available. This subgroup function will enable districts to examine results at the school level and states to examine results at the school and district levels when they host the associated data in the SCLS platform. A drop-down list will display all schools with associated data in the district’s data table,0 and users can select some or all schools. Similarly, for state-level administrations, two drop-down lists will appear: district and school. These lists will be nested so that a district must be selected first and only the schools within a selected district will be available in the school selection list.
While item-level frequency distribution results are important for examining the data in greater detail than scale scores will allow, the SCLS survey is designed to measure constructs, and users should be aware that interpretation of item-level results should be done in conjunction with scale-level results. Therefore, we recommend displaying the following text on screen within the item-level frequency distribution reports and as a footnote on each page of exported report files:
This report shows responses to each item in the survey. While individual survey items represent individual aspects of the overall concept that is being measured, the SCLS scales are designed to provide an overall measurement of the concept and should be the primary focus for understanding school climate.
The SCLS platform will allow users to export reports into the Excel, CSV, or PDF formats.
2.3 Scale Score Frequencies
For each construct in the SCLS surveys, scale score reports will be available for each respondent group immediately after the close of data collection. For each survey, individual subdomain scores of all completed surveys will be aggregated at the education agency level and graphically presented. Results will be reported for all completed surveys when there are at least 3 completed surveys in the subgroup.
2.3.1 Presentation of Scale Scores
Similar to the item-level frequency distributions, scale scores for each subdomain (and domain, where appropriate) will be presented using simple graphical displays. The use of theta scores to represent construct measurements can be thought of as similar to SAT scores, where the raw value is meaningful in its relation to a comparison point. The graphical presentation of these theta scores can show the average theta score and the comparison point (the national average from the benchmarking study) for a respondent group, as shown in the example in figure 12.
Figure 12. SCLS scale report: Continuum display
SCLS Scale Results Report Data Collection: 03/30/16-05/25/16: Students |

Simple bar graphs can also be used to show this information, as displayed in figure 13.
Figure 13. SCLS scale report: Bar display
SCLS Scale Results Report Data Collection: 03/30/16-05/25/16: Students SCLS Scale Score: Emotional Safety Report Date: May 22, 2016 18:06:41 |
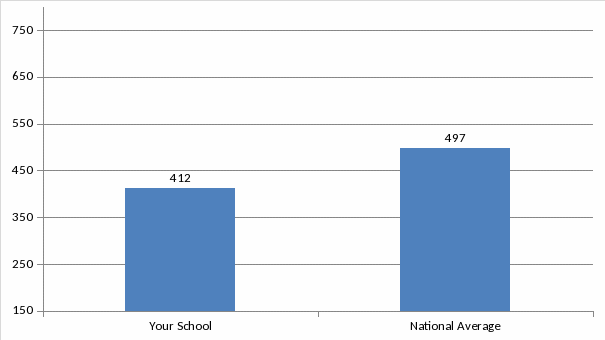
While the bar graph presented in figure 13 provides a simple display of the scores, it is necessary to include additional context, such as range and/or variability information that will help the user understand scores for a specific school in relation to the national average and distribution of scores. Cut points will not be calculated for the SCLS through psychometric analysis; however, by displaying tertile information from the national distribution, users will be able to determine how their score compares to the national distribution, as shown in figure 14.
Figure 14. SCLS scale report: Bar display with national information, exact score
SCLS Scale Results Report
Data Collection: 03/30/16-05/25/16: Students
SCLS Scale Score: Emotional Safety
Report Date: May 22, 2016 18:06:41
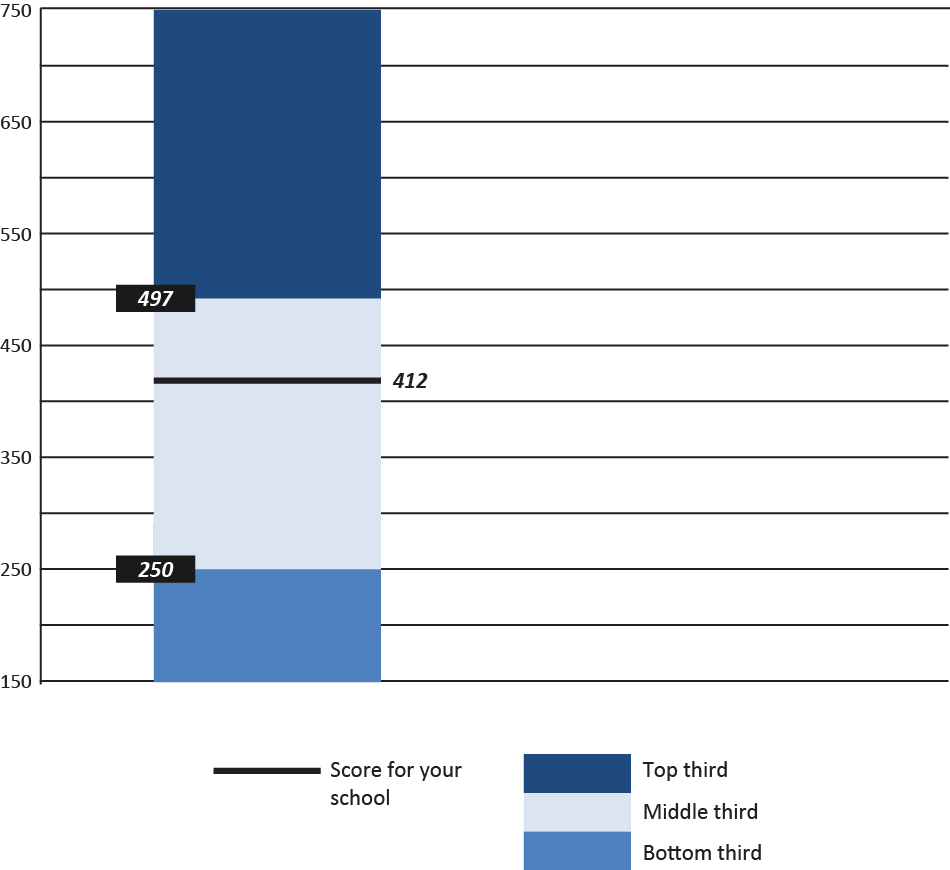
Note: Thirds are displayed to provide context for the distribution. The line shows the exact score of a school.
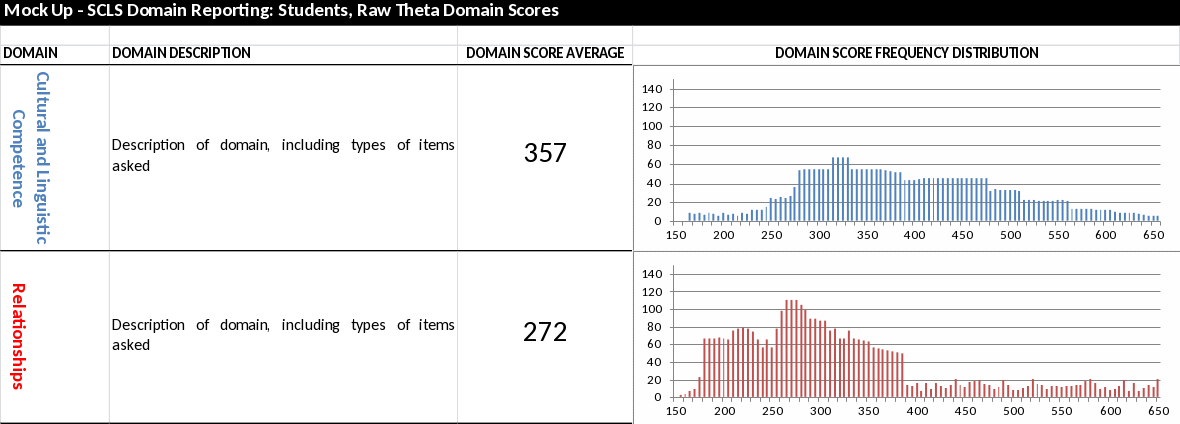
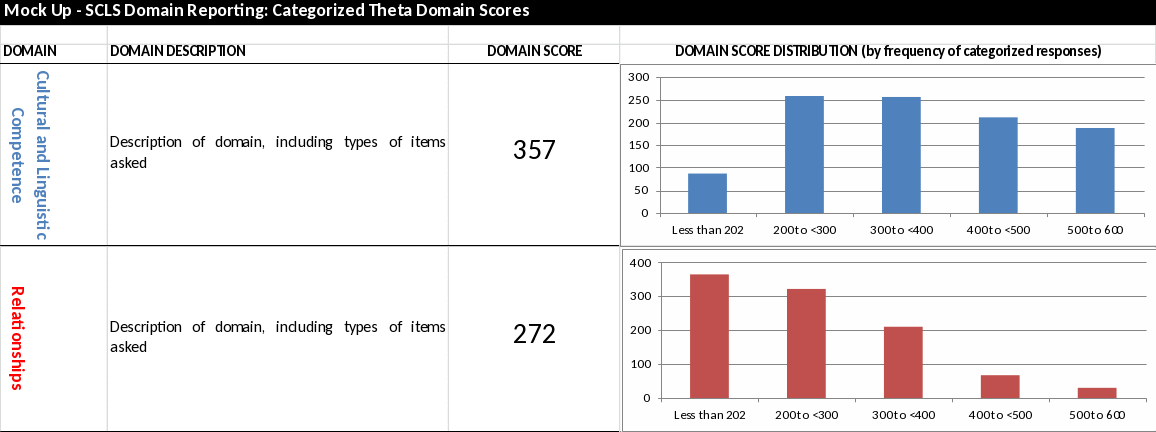
Additional display options include presenting theta score histograms or categorized frequencies and are shown in appendix A. To ensure that information is presented in a simple, user-friendly display with adequate information for interpretation, we recommend the graph shown in figure 14.
2.3.2 Suppression
In the event that there are very few respondents overall or in a subgroup (for example, if there is only one respondent of a certain race/ethnicity), reporting might result in indirect disclosure of a respondent’s identity. To minimize the risk of disclosure to respondents while providing as much usable information as possible, scale scores for any respondent group or subgroup with fewer than 3 respondents will be suppressed.0 For groups with 3 to fewer than 10 respondents, average scale scores (or ranges) will not be displayed. Instead, the national tertile in which the average is associated will be displayed as the result, as shown in figure 15.
Figure 15. SCLS scale report: Bar display with national information, ranges
SCLS Scale Results Report
Data Collection: 03/30/16-05/25/16: Students
SCLS Scale Score: Emotional Safety
Report Date: May 22, 2016 18:06:41
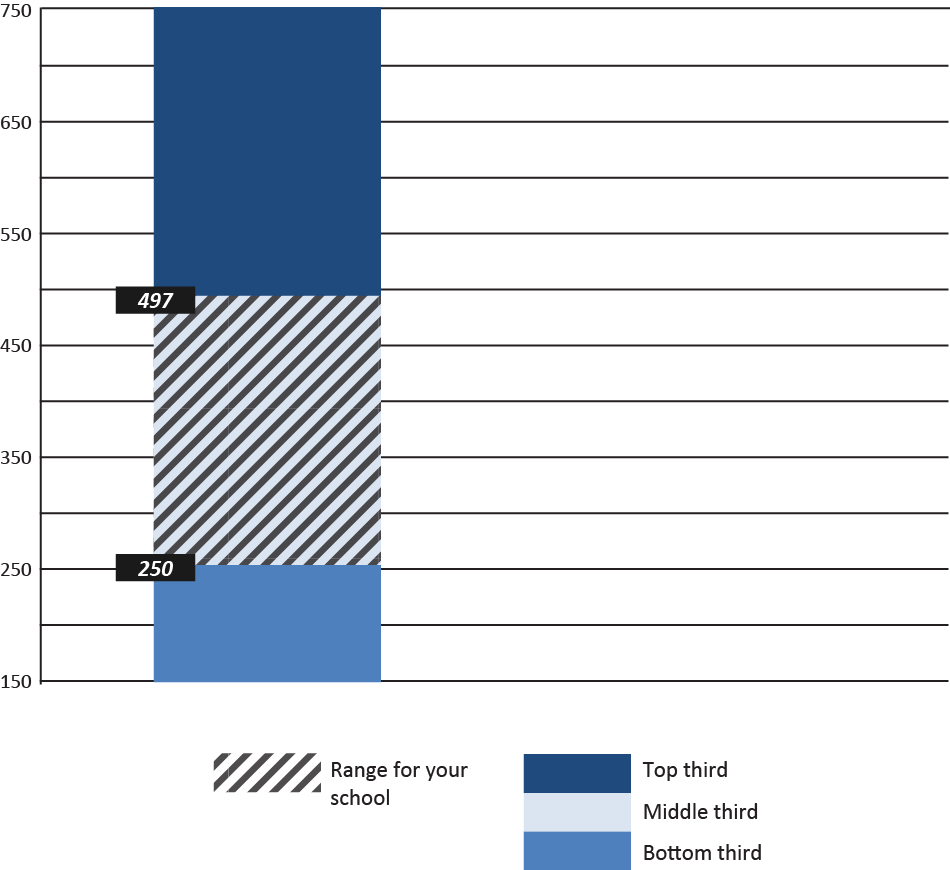
Note: Thirds are displayed to provide context for the distribution. Shading indicates that a schoo'sl score is in the range of that tertile.
2.3.3 Subgroup Reporting
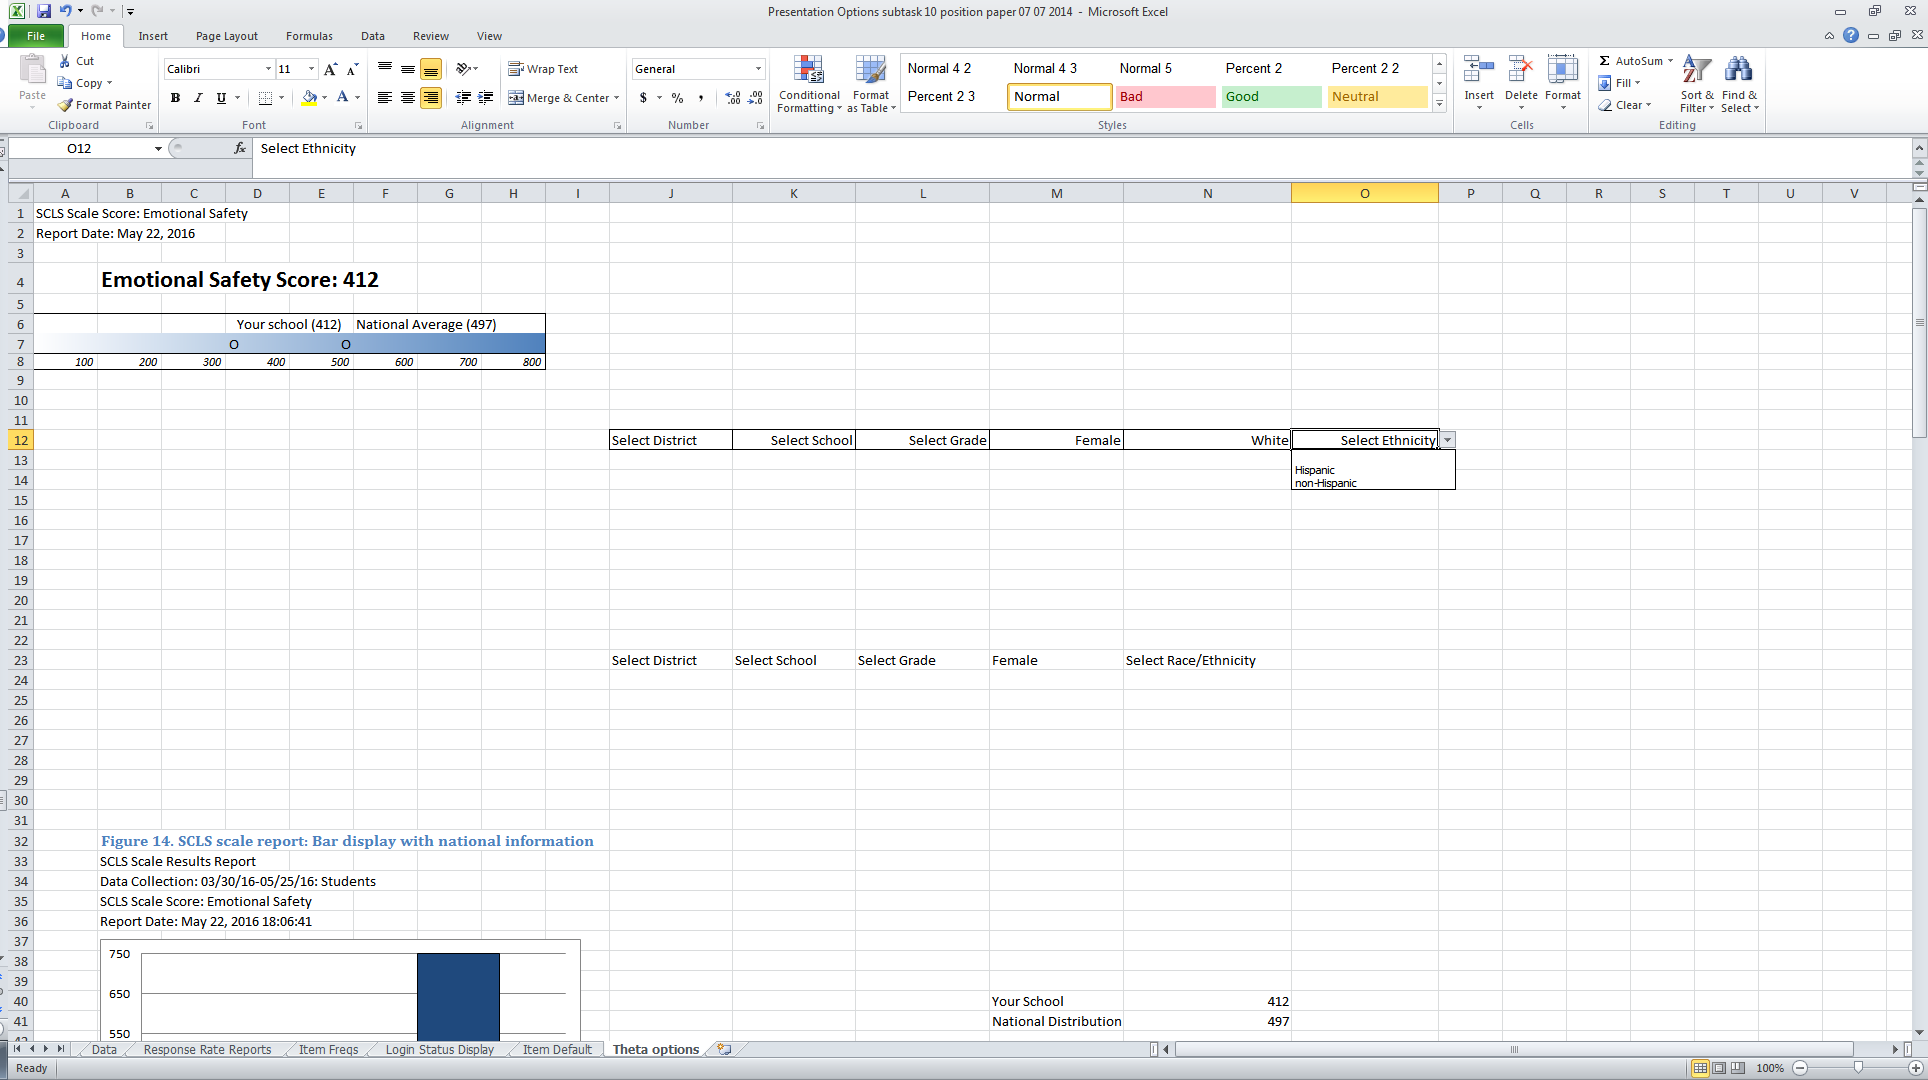
Users will have the option of displaying scale score results by selected subgroups. For the student surveys, the available subgroups will be grade, gender, and race/ethnicity.0 Reporting levels can be selected and modified by users from within the reporting dashboard using drop-down lists. A separate drop-down list for each demographic variable available for subgroup reporting will appear at the top of the reporting page (see figures 16 and 17), and users may choose any combination of subgroups.
Figure 16. SCLS drop-down lists: Example A
![]()
For example, a user who wants to produce a report for White Hispanic students would select the option for “White” from the race drop-down list and “Hispanic” from the ethnicity drop-down list, and a user who wants to produce a report for female White Hispanic students would select “Female” from the gender drop-down list in addition to the race and ethnicity options.
Figure 17. SCLS drop-down lists: Example B
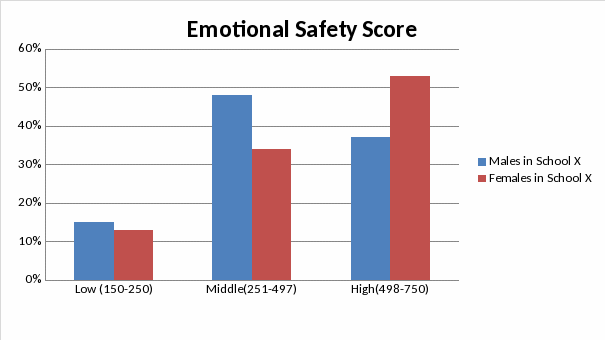
In order to present subgroup results in a meaningful and easily interpretable way (and without overwhelming the user with information), each category within the subgroup will be presented in a simple bar graph that shows the percentage of respondents in the category that fall into each tertile, based on the national distribution. Figure 18 provides an example of the distribution of male respondents based on tertiles from the national distribution.
Figure 18. SCLS scale report: Bar display with percentage of respondents in low, middle, and high national tertile groups, one category
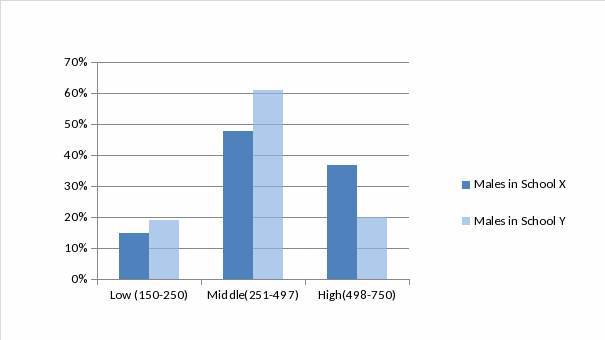
Users will also have the option of requesting subgroup reporting for multiple categories (as shown in figure 19), or for the same category/categories across schools (as shown in figure 20)
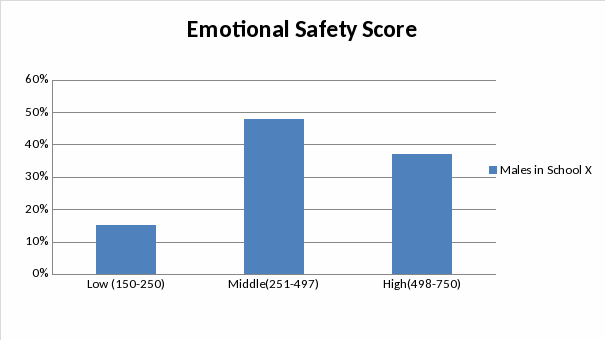
Figure 19. SCLS scale report: Bar display with percentage of respondents in low, middle, and high national tertile groups, two categories
SCLS Scale Results Report
Data Collection: 03/30/16-05/25/16: Students
SCLS Scale Score: Emotional Safety
Report Date: May 22, 2016 18:06:41
2.3.4 Suppression of Subgroup Reports
As with the overall scale scores, for any category with fewer than 3 respondents, results will not be shown and suppression text will appear below (or to the side of) the graph that reads “Results are not shown for <category name> due to disclosure risk.”. In the event that a category within a subgroup had between 3 and 9 respondents, the percentage distribution will not be shown, and additional suppression text will appear below (or to the side of) the graph that presents information about that groups placement in comparison to the national average (above or below). For example, if there are between 3 and 9 Asian students in a graph showing race/ethnicity results, the additional suppression text might read “The average scale for Asian students is above the national average. More detailed results are not presented due to disclosure risk.”.
2.3.5Reporting of Schools and Districts
As shown in figure 16, “district” and “school” will be available as categories for reporting, and all schools or districts that have associated data in the data table will be presented as reporting options in the drop-down list. For a single school that is hosting the SCLS, no school or district options will be presented.0 Similarly, for a single district, only school-level options will be available. This reporting function will enable districts to examine results at the school level and states to examine results at the school and district levels when they host the associated data in the SCLS platform. Multiple schools may also be chosen to produce comparison reports. Figure 20 provides an example of a comparison (subgroup) report for multiple schools
Figure 20. SCLS scale report: Bar display with percentage of respondents in low, middle, and high national tertile groups, two schools
SCLS Scale Results Report
Data Collection: 03/30/16-05/25/16: Students
SCLS Scale Score: Emotional Safety
2.3.6 Accompanying Text
Text to accompany the presentation of graphical scale score displays will vary depending on which display option is selected by the user. The accompanying text will provide a brief explanation of theta scores, guidance on interpreting values, and information on where to find national benchmark data for various subgroups.
2.3.7 Exporting of Reports
The SCLS platform will be built with the ability to export formatted reports into PDF, and to export aggregated survey results into Excel and CSV formats. In the case of exporting these reports and/or data, the wording for the pledge of confidentiality would be presented on the page before the export function is executed. If the survey data are not linked to external data through student IDs or other identifiers, only the following pledge of confidentiality text will be applicable: “I hereby certify that I have carefully read and will cooperate fully with the SCLS procedures on confidentiality. I will keep completely confidential all information arising from surveys concerning individual respondents to which I may gain access. I will not discuss, disclose, disseminate, or provide access to survey data and identifiers. I will devote my best efforts to ensure that there is compliance with the required procedures by personnel whom I supervise. I give my personal pledge that I shall abide by this assurance of confidentiality.” The text will be pre-filled in the system. There is a checkbox for the administrators to check and indicate that they read and agree to the pledge. If the survey data are linked or will be linked to external data, the system will provide an empty box for survey administrators to add any additional pledge of confidentiality language applicable to their state or their use of the data. No confidentiality agreement language will be required prior to exporting these reports, as the suppression rules described throughout this paper are sufficient for these reports to be released publically".
2.38 Reporting During the Pilot and Benchmark Studies
The SCLS scales will be developed based on data collected during the pilot study, while the national benchmarks will be determined during the benchmarking study. As such, limited reporting features will be available during these phases.
Pilot
During the pilot phase of the SCLS, no scale reporting will be available (administration reports and item-level reports will be available as described in this paper).0
Benchmarking
During the benchmarking study, administration and item-level reports will be displayed as described above. For scale score reports, results will be displayed as described above and shown in figures 14 and 15 with the exception that the distribution from the pilot study will be used in place of the national distribution for the comparison bar.
Appendix A. Alternative Scale Score Presentation Options
A-1. Alternative Scale Score Presentation Mock Up #1: Frequencies of Raw Theta Domain Scores
 A-2.
Alternative Scale Score Presentation Mock Up #2: Frequencies of
Categorized Theta Domain Scores
0 If a survey is being administered at the school level, administrators will only be able to see results for the school. A survey administrator at the district level will be able to view results for participating schools and the district. A state-level survey administrator will be able to view results for participating schools, districts, and the state.
0 Submission rates will not be calculated by respondent subgroups, as survey log-in and submission status will not be linked to survey data containing demographic information.
0 The survey administrator’s manual will provide additional information about how a submission rate differs from a response rate.
0 For education agencies wishing to link this information back to identifiable respondent information, guidance will be provided in supporting resources to efficiently create these linkages in Excel. Additionally, to minimize any concerns that respondents may have about confidentiality, the survey administrators manual will advise on best practices for communicating to respondents that information on log-in status is only available to education agencies for the parent and staff surveys.
0 When a user hovers the mouse over the “+” symbol, text will appear that reads “Click on the “+” to display result graphs”.
0 The SCLS platform will store data in a “data table” similar to an SQL table.
0 In place of the graph, the following text will be displayed: “Score not shown due to disclosure risk.”
0 Subgroups for the other respondent groups will be chosen in collaboration with NCES.
0 While the drop-down lists will be displayed, no choices will appear when clicked.
0 It will be possible to provide participating education agencies with scale scores at a later stage of scale development.
| File Type | application/vnd.openxmlformats-officedocument.wordprocessingml.document |
| Author | Neiman, Samantha |
| File Modified | 0000-00-00 |
| File Created | 2021-01-23 |
© 2026 OMB.report | Privacy Policy
