8-10 day probabalistic product survey
Day 8-10 Timeline Forecast Survey and Focus Groups
WPC_Survey_072017_final
Online survey
OMB: 0648-0757
WPC 8-10 Day Probabilistic Product Survey ECS, ECU, NNC
Dear Participant,
Thank you for logging into this survey. The survey is voluntary and any information you provide will be anonymous.
The purpose of this research is to understand the need for and interest in forecasts in the 8 to 10 day range and how best to show the probability of long range forecasts. By doing this research, we hope to learn how probabilistic forecasts can improve decision-making in the 8 to 10 day timeframe.
If you agree to take part in this survey, you will be asked questions that relate to how often you seek weather information and what decisions you make based on the weather forecast over one to two weeks. You will be asked your understanding and perceptions on ways to show forecasts of probabilities of temperature, precipitation, and winter weather. In addition, we will be collecting some demographic information. The amount of time it will take you to complete this survey is approximately 30 minutes.
This research is being conducted by an independent contractor, ECS Federal, LLC, on behalf of the National Weather Service. You do not have to take part in this research, and you can stop at any time. If you decide you are willing to take part in this study, please click here.
Thank you for taking the time to participate.
Notwithstanding any other provisions of the law, no person is required to respond to, nor shall any person be subjected to a penalty for failure to comply with, a collection of information subject to the requirements of the Paperwork Reduction Act, unless that collection of information displays a currently valid OMB Control Number.
If you have any questions, please contact Jennifer Sprague, National Weather Service, [email protected].
1. What is your age?
under 20
20-29
30-39
40-49
50-59
60-69
70+
2. What is your gender?
Male
Female
Other
3. What is your highest level of education?
High school (no diploma)
High school diploma or GED
Some college
Associates degree
Bachelor’s degree
Graduate/Professional degree
Prefer not to answer
4. Please enter your zipcode________
5. What best describes your employment?
Self-employed
Student
Unemployed
Government
Private
Non-profit
Education
Other
6. What is your relationship to the National Weather Service?
Member of the public/do not work for NWS
Employee at local WFO
Employee at a NWS Regional Office
Employee at a NWS National Center
Employee at a RFC or ROC
Collaborate with NWS
Other
7. How often do you seek weather information (on average)?
|
Several times a day |
Once a day |
Several times a week |
Once a week |
I rarely check the forecast |
For tomorrow |
|
|
|
|
|
For 2 to 4 days from now |
|
|
|
|
|
For 5 to 7 days from now |
|
|
|
|
|
For 8-10 days from mow |
|
|
|
|
|
8. Where do you get information about the weather? (Please check all that apply)
NOAA (National Weather Service) websites
Other weather websites
TV
Radio
Smartphone app(s)
Twitter
Facebook
Other (please specify) ____________________
9. To what extent would the following 8 to 10 day forecasts assist your decision making?
|
Very helpful |
Somewhat helpful |
Neither helpful nor unhelpful |
Somewhat unhelpful |
Very unhelpful |
8-10 day temperature forecast |
|
|
|
|
|
8-10 day precipitation forecast |
|
|
|
|
|
8-10 day winter weather forecast |
|
|
|
|
|
8-10 day heat index forecast |
|
|
|
|
|
10. What reasons would you be interested in the forecast 8 to 10 days out (select all that apply)?
General interest
Decisions related to a planned event or activity
Decisions related to travel plans
Decisions related to work
Decisions related to home maintenance
Resource management/planning (decisions related to managing reservoirs, forests, etc.)
Economic decision making/planning (decisions related to your business or purchasing decisions)
Preparedness actions (preparing for weather events/natural hazards)
I would not be interested in an 8 to 10 day forecast
Other
11. What type of forecast do you prefer?
A single, deterministic forecast. For example, “It will be 70°F on Tuesday.”
A range of possible forecasts. For example, “It could be between 60°F and 72°F on Tuesday.”
A probabilistic forecast such as “There is a 70% chance of reaching 65°F on Tuesday.”
A probabilistic forecast range such as, “There is a 60% chance of the temperature being 10°F above normal.”
12. How useful to you is a forecast that provides probabilities?
Very useful
Somewhat useful
Neither useful nor not useful
Somewhat not useful
Not useful at all
Specific product questions
Graphic 1:
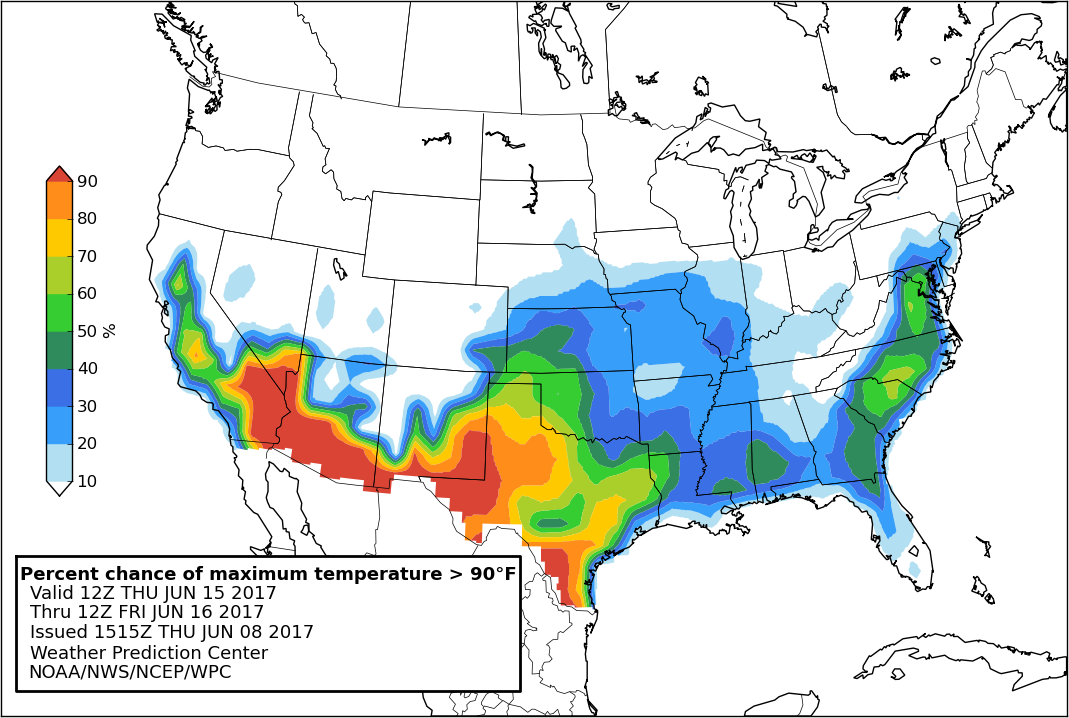
13. What do you think this product is showing?
The amount of confidence the forecasters have that it will be 90°F 8 days out
The probability that the maximum temperature will exceed 90°F 8 days out
The temperature will be 90°F 8 days out
The percentage of the day that the temperature will be 90°F 8 days out
I don’t know
14. How likely would you be to use this product?
Very likely
Somewhat likely
Neither likely nor unlikely
Somewhat unlikely
Very unlikely
15. Considering the product above, rate the following components:
|
Very negative |
Somewhat negative |
Neutral |
Somewhat positive |
Very positive |
Don’t know |
Information included |
|
|
|
|
|
|
Format |
|
|
|
|
|
|
Understandability |
|
|
|
|
|
|
Graphics |
|
|
|
|
|
|
Text |
|
|
|
|
|
|
Use of color |
|
|
|
|
|
|
Graphic 2:
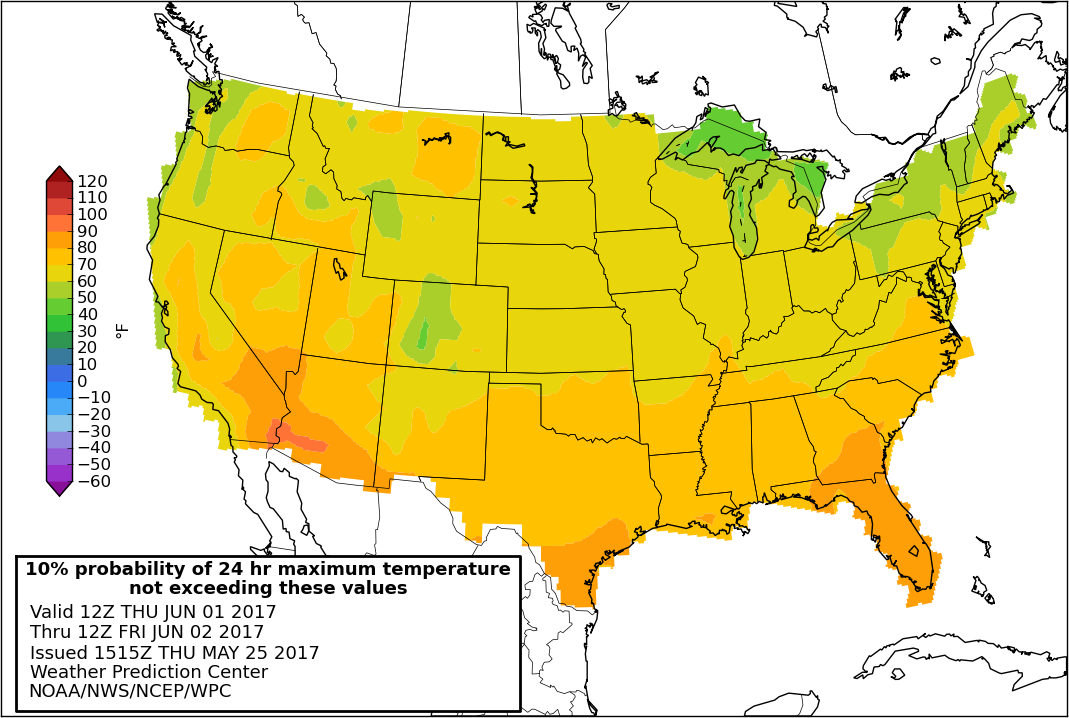
16. What do you think this product is showing?
The temperature values on the map are the forecast for 8 days out
There is a 10% chance the temperature will not exceed the levels shown on the map 8 days out
The forecasters are 90% certain it will exceed the temperatures shown on the map 8 days out
There is a 90% chance the temperatures will be cooler than the amounts shown on the map 8 days out
I don’t know
17. How likely would you be to use this product?
Very likely
Somewhat likely
Neither likely nor unlikely
Somewhat unlikely
Very unlikely
Considering the product above, rate the following components:
|
Very negative |
Somewhat negative |
Neutral |
Somewhat positive |
Very positive |
Don’t know |
Information included |
|
|
|
|
|
|
Format |
|
|
|
|
|
|
Understandability |
|
|
|
|
|
|
Graphics |
|
|
|
|
|
|
Text |
|
|
|
|
|
|
Use of color |
|
|
|
|
|
|
18. Of the two different types of products you just saw for temperature which do you prefer the most?
Percent chance (Graphic 1)
Chance of non-exceedance (Graphic 2)
19. Why?_________________
It makes more sense to me
The information is more useful
The graphic is easier to read and understand
Other_____________________________
Graphic 3:
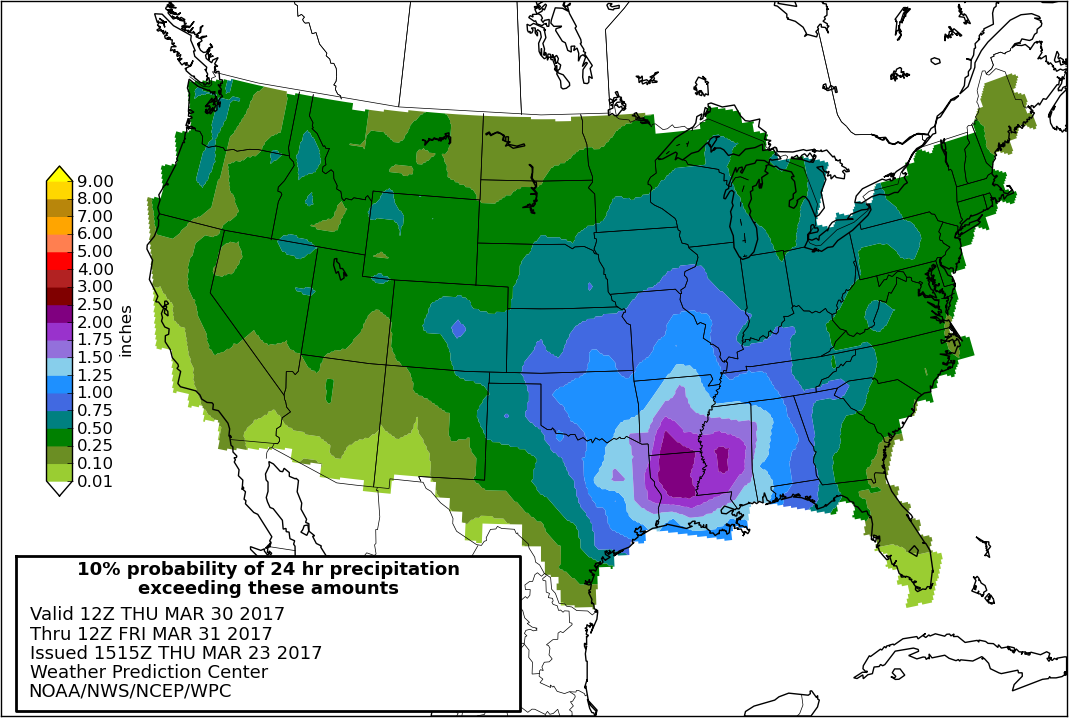
20. What do you think this product is showing?
There is a 10% chance that it will rain more than the amounts shown on the map 8 days out
There is a 90% chance it will rain more than the amounts shown on the map 8 days out
The precipitation values on the map are the forecasted total amounts 8 days out
The forecasters are 90% certain it will rain the amounts shown on the map 8 days out
I don’t know
21. How likely would you be to use this product?
Very likely
Somewhat likely
Neither likely nor unlikely
Somewhat unlikely
Very unlikely
22. Considering the product above, rate the following components:
|
Very negative |
Somewhat negative |
Neutral |
Somewhat positive |
Very positive |
Don’t know |
Information included |
|
|
|
|
|
|
Format |
|
|
|
|
|
|
Understandability |
|
|
|
|
|
|
Graphics |
|
|
|
|
|
|
Text |
|
|
|
|
|
|
Use of color |
|
|
|
|
|
|
Graphic 4:
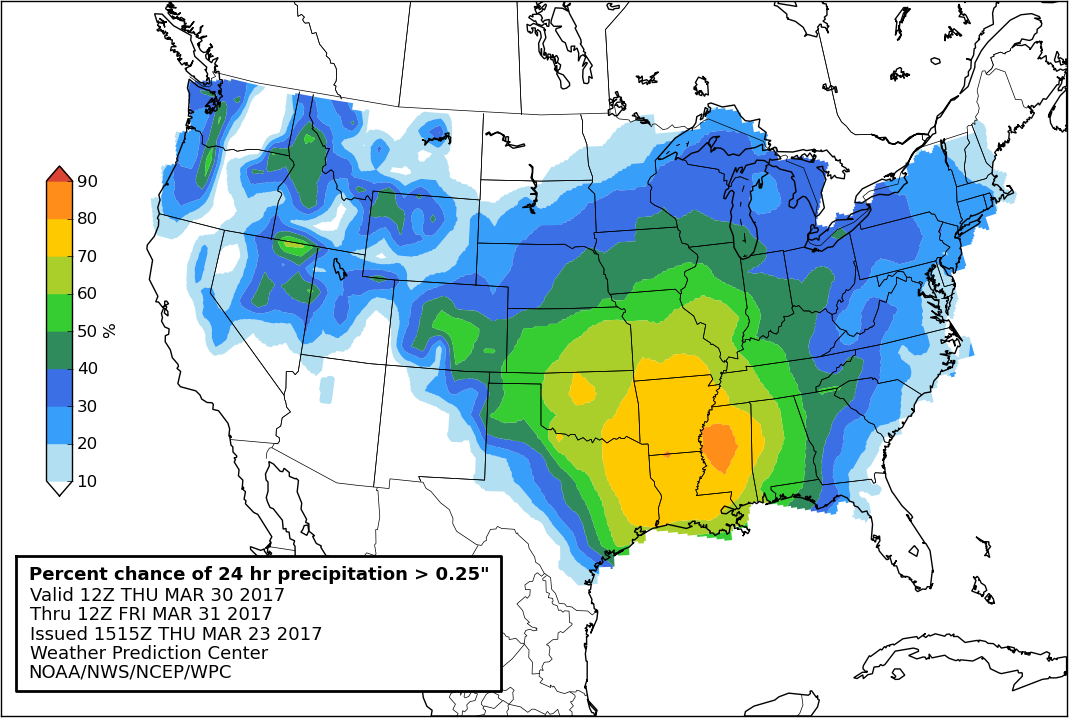
23. What do you think this product is showing?
The amount of confidence the forecasters have that there will be 0.25” of precipitation 8 days out
The percentage of the day that it will be raining 8 days out
The probability that the precipitation will exceed 0.25” 8 days out
The precipitation will be 0.25” 8 days out
I don’t know
24. How likely would you be to use this product?
Very likely
Somewhat likely
Neither likely nor unlikely
Somewhat unlikely
Very unlikely
25. Considering the product above, rate the following components:
|
Very negative |
Somewhat negative |
Neutral |
Somewhat positive |
Very positive |
Don’t know |
Information included |
|
|
|
|
|
|
Format |
|
|
|
|
|
|
Understandability |
|
|
|
|
|
|
Graphics |
|
|
|
|
|
|
Text |
|
|
|
|
|
|
Use of color |
|
|
|
|
|
|
26. Of the two different types of products you just saw for precipitation which do you prefer the most?
Chance of exceedance (Graphic 3)
Percent chance (Graphic 4)
27. Why?_________________
It makes more sense to me
The information is more useful
The graphic is easier to read and understand
Other_____________________________
Graphic 5:
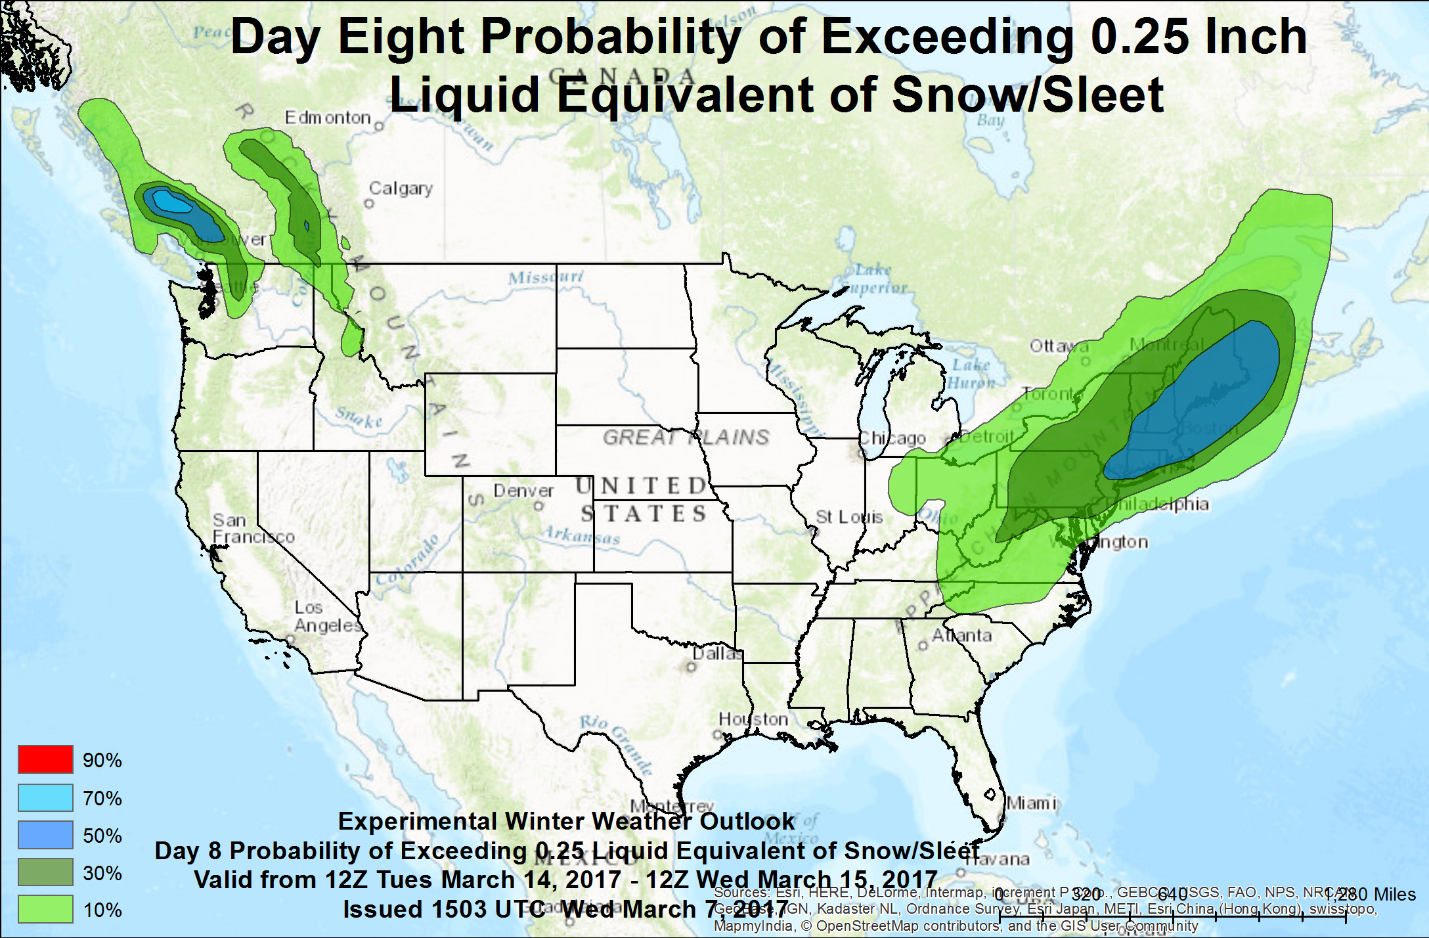
28. What do you think this product is showing?
The probability that the amount of snow or sleet, when melted, will exceed 0.25” 8 days from today
There will be 0.25” of liquid equivalent of snow 8 days from today
The percentage of the day it will snow 8 days from today
The amount of certainty the forecasters have that there will be 0.25” liquid equivalent of snow 8 days from today
I don’t know
29. How likely would you be to use this product?
Very likely
Somewhat likely
Neither likely nor unlikely
Somewhat unlikely
Very unlikely
30. Considering the product above, rate the following components:
|
Very negative |
Somewhat negative |
Neutral |
Somewhat positive |
Very positive |
Don’t know |
Information included |
|
|
|
|
|
|
Format |
|
|
|
|
|
|
Understandability |
|
|
|
|
|
|
Graphics |
|
|
|
|
|
|
Text |
|
|
|
|
|
|
Use of color |
|
|
|
|
|
|
Graphic 6:
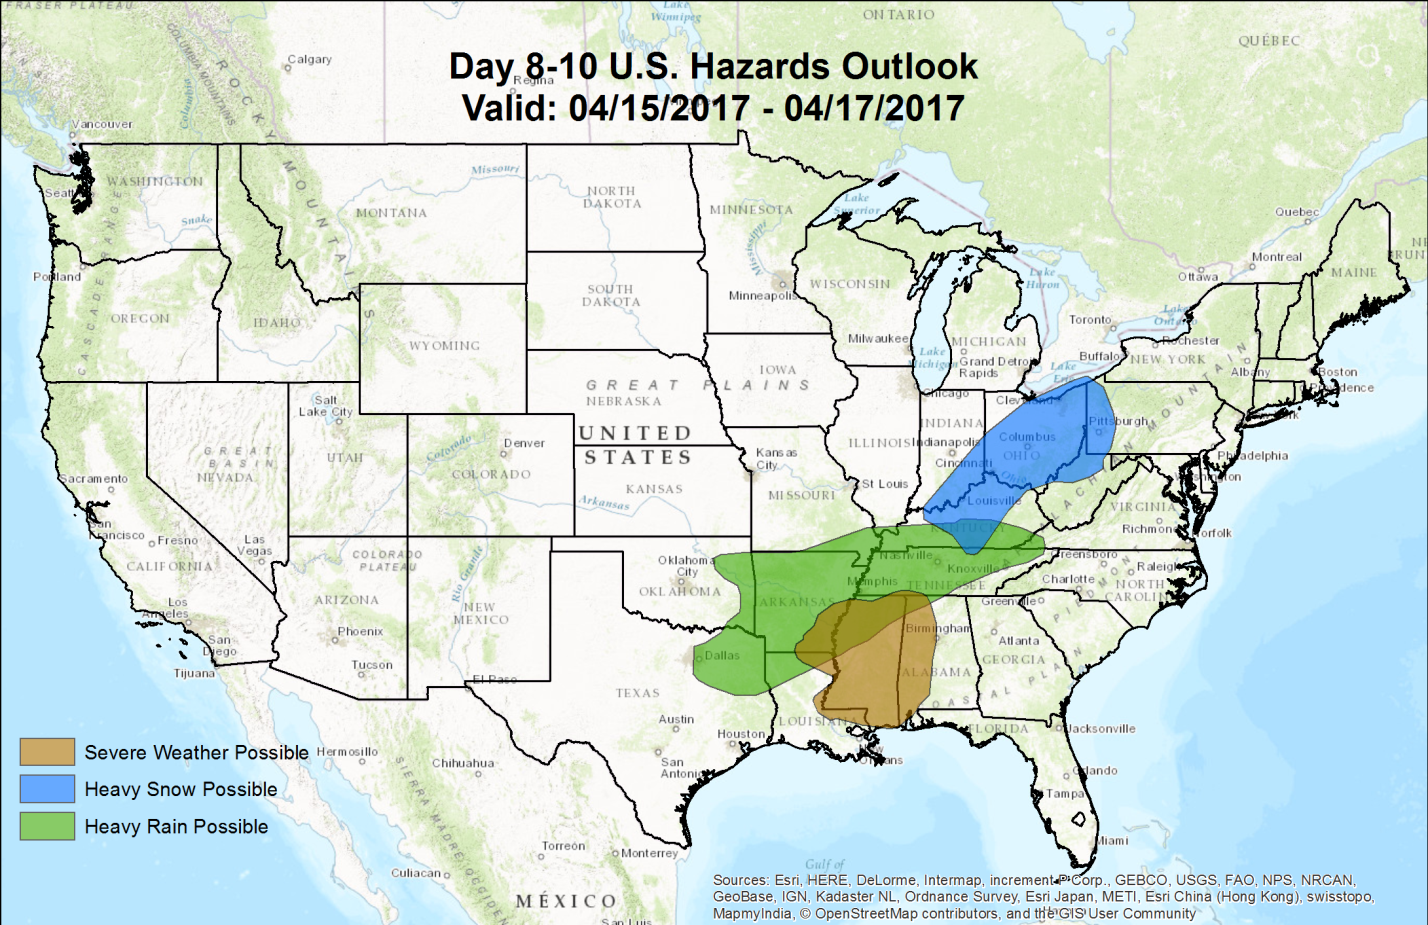
31. This Hazards Outlook for 8 to 10 days out helps you make informed decisions.
Strongly agree
Somewhat agree
Neutral
Somewhat disagree
Strongly disagree
32. The products you saw showed temperature, precipitation, hazards, and winter weather. How interested would you be in using a similar probability product for 8 to 10 days out that showed the following:
Heat index
Very interested
Somewhat interested
Neither interested nor uninterested
Somewhat uninterested
Very uninterested
Wind Chill
Very interested
Somewhat interested
Neither interested nor uninterested
Somewhat uninterested
Very uninterested
33. Is there any other type of weather information you would prefer in the 8 to 10 day forecast range?
____________________________________________
34. How would you prefer to receive an 8 to 10 day probability forecast?
Through social media
From local emergency manager
Emailed a link
Sign up for getting them based on a threshold I set
Seek them out on the Weather Prediction Center’s website
35. Do you have any additional comments about 8 to 10 day probabilistic Weather Prediction Center products?
_______________________________________________________________________
| File Type | application/vnd.openxmlformats-officedocument.wordprocessingml.document |
| Author | kalese |
| File Modified | 0000-00-00 |
| File Created | 2021-01-22 |
© 2026 OMB.report | Privacy Policy