BAS GUPS Respondent Guide
BASRespondentGuide_Digital_GUPS.docx
The Boundary and Annexation Survey (BAS) & Boundary Validation Program (BVP)
BAS GUPS Respondent Guide
OMB: 0607-0151
Boundary and Annexation Survey (BAS) Respondent Guide: GUPS
Instructions for Using the Geographic Update Partnership Software (GUPS)
R evised
as of February 26, 2018
U.S. Department of
Commerce
Economic and Statistics
Administration
U.S. CENSUS BUREAU
census.gov

This page intentionally left blank.
Table of Contents
A. The Boundary and Annexation Survey viii
B. What’s New for the BAS? viii
C. Key Dates for BAS Respondents viii
F. Respondent Guide Organization ix
Section 1: Process and Workflow 1
1.1 Receiving the GUPS Application and Shapefiles 1
1.2.1 GUPS Help 2
Section 2: Reviewing BAS Data 3
2.3 Reviewing Legal Boundaries 3
2.4 Requirements for Legal Boundary Changes 4
2.5 Reviewing Linear Features 6
2.6 Reviewing Area Landmarks and Hydrographic Areas 6
2.7 Reviewing Point Landmarks 9
Section 3: Quality Control and File Submission 11
3.2 Submitting Files Through SWIM 11
3.3 Submitting Files on DVD 12
Section 4: Requirements and installation 13
Section 5: Using GUPS (Basics and Map Management) 19
5.1 How to Access BAS Shapefiles 19
5.3 Download Shapefiles from the BAS Web site to Your Hard Drive 32
5.4 Download Shapefiles from the Census Bureau ftp2 Site 34
5.5.1 GUPS Main Page 37
5.5.2 Table of Contents and Map View 39
5.5.3 Managing the Map View from Within the Table of Contents 40
5.7 How to Import User-Provided Data into GUPS 65
5.7.1 The Add Data Toolbar 65
5.7.2 How to Upload User-Provided Data Layers 66
5.7.3 How to Import a Shared ZIP Shapefile 68
Section 6: Making BAS Updates in GUPS 71
6.1 How to Update Legal Boundaries 71
6.1.1 Recording an Annexation 71
6.1.2 Recording a Deannexation 78
6.1.3 Adding a New Legal Entity (New Incorporation) 83
6.1.4 Deleting an Entity (Disincorporation) 92
6.1.5 Making a Boundary Update on a County Line 95
6.1.6 Making a Legal Boundary Change for a Consolidated City 103
6.1.7 Making a Boundary Correction (Add Area/Remove Area) 103
6.1.8 Adding a Geographic Corridor 106
6.1.9 Add a Geographic Offset 114
6.2 How to Update Linear Features 115
6.3 How to Update Area Landmarks and Hydrographic Areas 121
6.3.1 Adding a New Area Landmark/Hydrographic Area 121
6.3.2 Deleting an Area Landmark/Hydrographic Area 125
6.3.3 Adding Area to an Area Landmark or Hydrographic Area 128
6.3.4 Removing Area from an Area Landmark/Hydrographic Area 130
6.4 How to Update Point Landmarks 133
6.5 How to Use GUPS Review and Validation Tools 137
6.6 Export a Printable Map 151
6.7 How to Export ZIP Files to Share/Submit 154
Section 7: Submitting Your Files to the Census Bureau Through SWIM 160
Appendix A. BAS Contact Information and Resources A-1
Appendix C. MTFCC Descriptions C-1
Appendix D. Standard Street Type Abbreviations D-1
E.3 Restoring Default Label Display Settings E-6
E.4 Using the Table of Contents Toolbar to Manage Layers E-7
E.5 Preset Views in the Manage Layer Visibility Table of Contents E-8
Appendix F. MAF/TIGER Feature Classification F-1
LIST OF TABLES
Table 1: Available Change Types by Entity Type 3
Table 2: Acceptable MTFCCs for New Area Landmarks / Hydrographic Areas 6
Table 3: Restricted Point Landmark MTFCCs 7
Table 4: GUPS Hardware and Software Requirements 12
Table 5: Install the GUPS Application 13
Table 6: Start a New Project Using Shapefiles from the BAS Web site 18
Table 7: Download Shapefiles from the BAS Web site to a Hard Drive 30
Table 8: Download Shapefiles from ftp2 Site to a Hard Drive (State Users) 32
Table 9: GUPS Main Page Elements 35
Table 10: Menu Tabs and Their Functions 40
Table 11: Adjust Snapping Tolerances 44
Table 12: Standard Toolbar Buttons 46
Table 13: Identify a Feature on the Map 47
Table 14: Select/Deselect Features on the Map 49
Table 15: Select Features by Querying the Attribute Table 52
Table 16: View Layer Attributes Using the Attributes Table 54
Table 17: Measure Distances, Area, and Angles on a Map 55
Table 18: Bookmark Locations on a Map 57
Table 19: BAS Toolbar Buttons 58
Table 20: Status Bar Elements 60
Table 21: Add Data Toolbar Buttons 60
Table 22: Load Shapefiles/Geodatabase Layers 61
Table 23: Load Data from a Web Mapping Service 62
Table 24: Add Imagery Files 63
Table 25: Import a ZIP File Shared by Another User 63
Table 26: Record an Annexation 65
Table 27: Recording a Deannexation 71
Table 28: Adding a New Legal Entity 76
Table 29: Record a Disincorporation 83
Table 30: Record an Annexation in an Adjacent County 86
Table 31: Making a Boundary Correction 94
Table 32: Adding a Geographic Corridor 97
Table 33: Adding a Linear Feature 104
Table 34: Deleting a Linear Feature 106
Table 35: Restoring a Deleted Linear Feature 107
Table 36: Changing the Attributes of a Linear Feature 108
Table 37: Creating a New Area Landmark/Hydrographic Area 111
Table 38: Deleting an Area Landmark/Hydrographic Area 114
Table 39: Adding Area to an Area Landmark/Hydrographic Area 117
Table 40: Removing Area from an Area Landmark/Hydrographic Area 119
Table 41: Adding a Point Landmark 122
Table 42: Deleting a Point Landmark 123
Table 43: Changing the Attributes of a Point Landmark 124
Table 44: Using the Geography Review Tool 125
Table 45: Reviewing Change Polygons 130
Table 46: Export a Printable Map 138
Table 47: Exporting Files to Share with Another User 141
Table 48: Exporting Files for Submission to the Census Bureau 143
Table 49: Transmitting Files to the Census Bureau Using SWIM 146
Table 50: Reset Layer Symbology E-1
Table 51: Change Default Labeling E-3
Table 52: Restoring Default Labeling E-5
Table 53: Table of Contents Layers Toolbar Buttons E-6
Table 54: MAF/TIGER Feature Classification F-1
Table 55: State Shapefiles Names G-1
Table 56: County Shapefiles Names G-2
Table 57: Edges Shapefile (PVS_18_v2_edges) H-1
Table 58: Address Ranges Attribute File (PVS_18_v2_addr) H-2
Table 59: Census Block Shapefile (PVS_18_v2_tabblock2010) H-3
Table 60: Census Tract Shapefile (PVS_18_v2_curtracts) H-4
Table 61: American Indian Areas Shapefile (PVS_18_v2_aial) H-5
Table 62: County and Equivalent Areas Shapefile (PVS_18_v2_county) H-6
Table 63: County Subdivisions Shapefile (PVS_18_v2_mcd) H-7
Table 64: Incorporated Place Shapefile (PVS_18_v2_place) H-8
LIST OF FIGURES
Figure 2. GUPS Main Page Layout 35
Figure 3. Close Table of Contents 37
Figure 4. Restore the Table of Contents 38
Figure 5. Managing Layer Visibility 38
Figure 6. Menu and Toolbars 39
Figure 7. Manage Layer Toolbar 39
Figure 12. Add Data Toolbar 60
Figure 13. Annexed Area Corridor and Unincorporated Area B-2
Figure 14. Incorporated Area and Unincorporated Area B-2
Figure 15. Participant Responses B-2
Figure 16. A Cadastral (Parcel-Based) Boundary Map B-3
Figure 17. How a Boundary Should be Represented When Sent to the Census Bureau B-3
Figure 18. Place Boundary – Front Lot Line B-4
Figure 19. Place Boundary – Rear Lot Line B-4
Figure 20. Table of Contents Layers Toolbar E-6
Introduction
The U.S. Census Bureau (Census Bureau) conducts an annual survey called the Boundary and Annexation Survey (BAS) to collect information about selected legally defined geographic areas, such as counties (and equivalent areas), incorporated places, minor civil divisions (MCDs), federally recognized American Indian Areas (AIAs), including reservations, off-reservation trust lands and tribal subdivisions, Hawaiian Homelands, and Alaska Native Regional Corporations (ANRC). The BAS also provides an opportunity for participants to review the names and geographic relationships for these areas. Title 13, U.S.C., Section 6, authorizes this survey.
The Census Bureau uses the boundary information collected during the BAS to tabulate data for the decennial and economic censuses, and to support the Population Estimates Program (PEP) and the American Community Survey (ACS). Maintaining correct boundaries and boundary-to-feature relationships through the BAS helps ensure that the Census Bureau assigns the appropriate population to each governmental unit (GU).
In compliance with the Office of Management and Budget Circular A-16, the BAS supports the Census Bureau’s spatial data steward responsibilities for the Federal Geographic Data Committee (FGDC) and the Geospatial One-Stop by updating the inventory and boundaries of GUs.
In addition, the BAS is the source of up-to-date information on changes to the boundaries, codes and names of incorporated places, MCDs, counties (and equivalent areas), Hawaiian Homelands, ANRC, and federally recognized AIAs, which include reservations and off-reservation trust lands used by the U.S. Geological Survey’s (USGS), the National Map, and the Geographic Names Information System (GNIS).
Please visit the BAS program Web site at <https://www.census.gov/programs-surveys/bas.html>.
For more information on the BAS, please view the “Introduction to BAS” video series on the Census Bureau’s BAS Web site at <https://www.census.gov/programs-surveys/bas/library/videos/bas-intro.html>
The Geographic Partnership Support Desk (GPSD) is now fully functional and available to assist with any questions respondents may have regarding BAS.
Redistricting data contacts participating in the Voting District Project (VTDP) may submit boundary updates for reconciliation with BAS contacts.
January 1—All boundary changes must be legally in effect on or before this date to be reported in the current survey year.
March 1—BAS submission date deadline for boundary updates to be reflected in the ACS and PEP published data. Boundary submissions received by this date are also reflected in next year’s BAS materials.
May 31—BAS boundary updates submitted by this date will be reflected in next year’s BAS materials.
The Census Bureau has established a number of agreements with states for reporting boundary changes. Please visit the BAS State Agreements webpage within the BAS program Web site at <https://www.census.gov/programs-surveys/bas/information/state-agreements.html> or call (800) 972-5651 for information regarding state agreements.
Note: The Census Bureau can only establish BAS state agreements for states that require local governments to report boundary changes to a state agency.
If the Census Bureau discovers that an area of land is in dispute
between two or more jurisdictions, the Census Bureau will not make
any boundary corrections until the parties come to a written
agreement, or there is a documented final court decision regarding
the dispute.
If you have questions concerning this, please
contact the Census Bureau Legal Office at
301-763-9844.
For disputes involving tribal areas, the Census Bureau must defer to the Office of the Solicitor at the Department of the Interior for a legal opinion. Often complicated land issues require an extended period of time for resolution, and in those cases, the Census Bureau will retain the current boundary in the database until a legal opinion is issued by the Solicitor’s office.
This guide has been created for those who choose to participate in the survey using GUPS. Those using their own GIS should consult the Boundary and Annexation Survey Respondent Guide: Digital available on the BAS Web site: <https://www.census.gov/programs-surveys/bas/information/response-methods.Digital_BAS.html>. Those using paper maps should consult the Boundary and Annexation Survey Respondent Guide: Paper. This guide is equipped with shortcuts to subjects that respondents may want to jump to directly. To move directly to one of these sections, click on the linked text.
This guide contains two parts:
Part 1: Provides an overview of BAS. It specifies the:
BAS Process and Workflow;
Receiving the GUPS Application and Shapefiles;
GUPS Help;
BAS Help;
Reviewing BAS Data (Information specific to the review and update of each type of
geographic entity);Boundary Corrections (Including Legal Boundary Changes and Reviewing Legal Boundaries);
Reviewing Linear Features (Including Reviewing Area Landmarks and Hydrographic Areas);
Reviewing Point Landmarks;
Validating Updates; and
Submitting Files Through SWIM and Submitting Files on DVD.
Part 2: Describes GUPS and gives step-by-step instructions (Action/Result in table format) for how to:
How To Use GUPS application;
Requirements and installation;
How to Access BAS Shapefiles; Download Shapefiles from the BAS Web site to Your Hard Drive; and Download Shapefiles from the Census Bureau ftp2 Site;
How to Import User-Provided Data into GUPS;
How to Import a Shared ZIP Shapefile;
How to Update Legal Boundaries;
How to Update Linear Features;
How to Use GUPS Review and Validation Tools;
Export a Printable Map; and
How to Export ZIP Files to Share/Submit.
Note: In all the Action/Result tables, the action is ususally a command or action you need to perform and the Result(s) of the action will be shown in italics. For example: if you click GUPS icon on your desktop, the software should begin to run automatically.
Figure 1 below illustrates the three phases of the work to be completed for the BAS. The first section in the diagram includes initial steps. The second section indicates the types of geographic data that should be reviewed and updated. The final section lists the final steps to validate and submit changes.
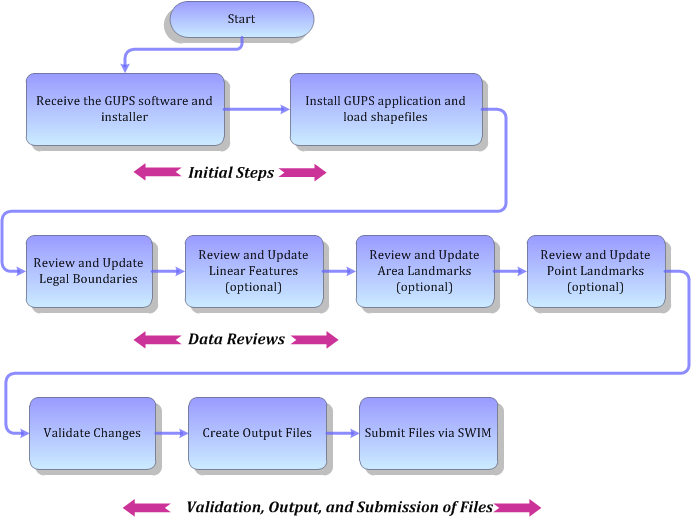
Sections 1, 2, and 3 of this guide are organized around the topical areas in the diagram and provide needed program information and procedures, as well as relevant deadlines.
See Appendix A: BAS Contact Information and Resources for a list of contacts and helpful program links.
GUPS is available for installation two ways. GUPS software is available for download directly from the BAS Web site <https://www.census.gov/programs-surveys/bas/technical-documentation/gups-instructions.html>. You can also request to receive GUPS software on DVD, which will be shipped to you in a package containing the GUPS DVD, respondent guide, and a read me text file.
Once you have installed GUPS on your computer, the BAS shapefiles can be imported from the BAS Web site directly to the GUPS application. Instructions on how to load data into GUPS appears in Section 5.2. If you do not have Internet access, you may request shapefiles on DVD. To request a data DVD, call 1‑800-796-3748 or email [email protected].
Part 2: How To Use GUPS of this guide contains directions for how to use the tools available within the GUPS application, as well as step-by-step instructions for how to carry out specific shapefile updates (e.g., annexations and deannexations, adding and deleting features and landmarks, etc.).
Embedded within the GUPS application (under the Help tab menu) are other resources, including a short training video on how to submit a ZIP file through SWIM. Additional videos will be provided on the BAS Web site as they become available. In addition, a Section 508-compliant version of this guide is available there. The Help menu provides a link to both.
For supplemental information on functions within the GUPS that are specific to QGIS, a QGIS user’s manual can be found at <http://docs.qgis.org/2.8/en/docs/user_manual/index.html>. The QGIS manual offers particularly helpful information on several activities that are touched on in this guide, but not described in detail, including working with user-provided data layers, creating search expressions for attribute tables, and creating customized coordinate systems. For questions concerning technical problems with the GUPS application, user support is available via telephone (1-800-972-5651) and email [email protected].
BAS participants may find the Boundary and Annexation Survey Respondent Guide: Digital helpful. Although designed for experienced GIS users, it provides important information on geocoding, topological relationships, and spatial accuracy relevant to Census shapefiles. This guide can be downloaded at: <https://www.census.gov/programs-surveys/bas.html>.
The Census Bureau has also created a number of other BAS-related videos, including a helpful one on the subject of topology and why topology is important to the BAS. To view these videos, go to: <https://www.census.gov/programs-surveys/bas/library/videos.html>.
The Census Bureau requests that you review and update all legal entities and boundaries within your jurisdiction, including the new incorporation or disincorporation of legal entities, legal boundary changes, and boundary corrections. You may also update linear features and landmarks, including area landmarks, hydrographic areas, and point landmarks, although review of these is optional.
To help conduct your review, the GUPS application will allow you to import and overlay your own geospatial data layers with the Census Bureau shapefiles. You can import image files from web mapping services, geodatabases, and also other file types. Steps to import the most common types of user-provided data are provided in Section 5.7 How to Import User-Provided Data into GUPS.
A boundary correction is the adjustment of a boundary to correct an error in how the Census Bureau depicts an existing boundary. Boundary corrections should follow the general shape of the existing boundary. Legal documentation is not required when submitting a boundary correction to the Census Bureau.
Legal boundary changes are the result of legal actions (e.g., annexations), and documenting such changes is the primary goal of the BAS. AIA Legal documentation (e.g., statute, federal court decision, trust deed) must accompany all AIA legal boundary changes, while legal boundary change submissions from incorporated places, MCDs, and counties must provide an authorization number, such as a resolution or ordinance number.
When reviewing legal boundaries, please examine the Census Bureau shapefiles for all legal entities in your jurisdiction. These includes:
Incorporated places;
Minor Civil Divisions (MCDs) such as towns, boroughs, and townships;
Counties (and county equivalents); and
Consolidated cities.
The Table 1 shows the specific changes allowed for each legal entity type.
Table 1: Available Change Types by Entity Type
Entity Type |
Available Change Types |
Incorporated Place |
|
Minor Civil Division (MCD) |
|
County |
|
Consolidated City |
|
Boundary Changes to Legal Entities
For a boundary change to an existing legal entity (or the new incorporation or disincorporation of a legal entity) to be processed as a legal change, you must provide the legal documentation number (e.g., law or ordinance number), effective date, and authorization type. You are not required to submit paperwork documenting the change.
Note: Although additional documentation is not required, we do strongly encourage you to attach supporting paperwork to your submission (you may do this directly in GUPS). The paperwork will expedite our ability to reconcile and process any legal updates.
Boundary Changes to Legal Entities in Georgia and Indiana
Georgia: Any legal boundary change made to an incorporated place in the state of Georgia must include: (1) the effective date, and (2) the acreage of the new entity. In addition, before entering the change, you must ensure that all annexation/deannexation information has been reported to the Department of Community Affairs (DCA). The DCA provides the Census Bureau a list of the entities that reported boundary changes each year. Any legal boundary changes to incorporated places not on this list will not be placed in the MAF/TIGER System. For additional information, see: <https://www.census.gov/programs-surveys/bas/technical-documentation/methodology/state-agreements.html>.
Indiana: Per Indiana state law, counties must provide the
legal boundary updates for townships. For more information, refer to
Indiana Code 36-6 Government of Townships at
<http://iga.in.gov/legislative/laws/2017/ic/titles/001>.
If you have questions about required documentation for your
particular jurisdiction, contact the Geography Division by phone at
1-800-972-5651 or by email at [email protected].
It is important that Census Bureau data reflects the most recent linear features to ensure that new or previously missed housing units located along these features are identified and located. When reviewing linear features (edges layer) on the Census Bureau shapefiles, first determine whether any features are missing or need to be deleted. Pay particular attention to areas that have experienced recent population growth or construction activities, as these are the most likely to possess new or altered linear features (e.g., new subdivisions, traffic circles converted to straight ways, or privately maintained roads that serve as public streets, but exclude private driveways).
You may also add attribute updates (e.g., name, class code, and
address ranges) for selected features. For a complete list of
MAF/TIGER Feature Class Codes (MTFCCs), review
Appendix C
MTFCC Descriptions.
To aid in the review of linear features, GUPS allows you to import local street centerline files, hydrography layers, imagery, and other user-provided geospatial data for reference and comparison against the Census Bureau data.
In your review, please note:
S1100 and S1200—If you add road features with an MTFCC of S1100 (Primary Road) or S1200 (Secondary Road), you must supply a feature name. As is the case for all road features, the feature name should be a proper name or route number.
Spatial Inaccuracies—The Census Bureau will not process the wholesale spatial realignment of features to enhance spatial accuracy. If a feature is in the incorrect location, delete the feature and add it in the correct location. Take this action only if the feature is exceedingly spatially inaccurate and/or the current location (with respect to other features and boundaries) affects the tabulation of housing units to the correct geography, such as legal entities, census tracts, and census blocks.
Address Range Changes—The Census Bureau accepts address range data as part of the linear feature update layer. As with other linear feature updates, you must supply the required attributes and corresponding change type for the update. In addition, because existing address ranges are not shown in our outgoing shapefiles, we recommend that participants only add address ranges to new features.
The Census Bureau accepts updates to area landmarks and hydrographic areas in a similar manner to legal boundary changes. However, area landmarks and hydro areas are not legal entities, so no documentation or effective dates are required.
Allowable updates for area landmarks and hydrographic areas are:
Add new area landmark or hydrographic area;
Remove area landmark or hydrographic area;
Change or add landmark name; and
Boundary corrections (add and remove area).
If you add a new area landmark or hydrographic area, please add only:
Water bodies;
Glaciers;
Airports;
Cemeteries;
Golf courses; and
Parks.
The Census Bureau cannot add other types of area landmark /
hydrographic areas to the MAF/TIGER System at this time (even though
others may already exist in the database).
Table 2
shows the acceptable MTFCCs for new area landmarks or
hydrographic areas.
Table 2: Acceptable MTFCCs for New Area Landmarks / Hydrographic Areas
MTFCC |
Description |
H2030 |
Lake/Pond |
H2040 |
Reservoir |
H2041 |
Treatment Pond |
H2051 |
Bay/Estuary/Gulf/Sound |
H2081 |
Glacier |
C3023 |
Island |
K1231 |
Hospital/Hospice/Urgent Care Facility |
K1235 |
Juvenile Institution |
K1236 |
Local Jail or Detention Center |
K1237 |
Federal Penitentiary, State Prison, or Prison Farm |
K2110 |
Military Installation |
K2180 |
Park |
K2181 |
National Park Service Land |
K2182 |
National Forest or Other Federal Land |
K2183 |
Tribal Park, Forest, or Recreation Area |
K2184 |
State Park, Forest, or Recreation Area |
K2185 |
Regional Park, Forest, or Recreation Area |
K2186 |
County Park, Forest, or Recreation Area |
K2187 |
County Subdivision Park, Forest, or Recreation Area |
K2188 |
Incorporated Place Park, Forest, or Recreation Area |
K2189 |
Private Park, Forest, or Recreation Area |
K2190 |
Other Park, Forest, or Recreation Area (quasi-public, independent park, commission, etc.) |
K2424 |
Marina |
K2540 |
University or College |
K2457 |
Airport – Area Representation |
K2561 |
Golf Course |
K2582 |
Cemetery |
Note: If adding an MTFCC K2457 (Airport – Area Representation) area landmark, please limit the updates to major airports (major regional and international airports). The feature should show the full extent of the airport facility, that is, do not limit the addition to simply the landing strips.

Because many of the point landmarks contained in the Census Bureau’s MAF/TIGER System originate from the U.S. Geological Survey’s Geographic Names Information System (GNIS), which is the official gazetteer of point landmark names for the Federal Government, point landmark updates are limited in the BAS. The Census Bureau cannot modify any point landmark imported from the GNIS database. Thus, be aware that name changes or deletions submitted for the following types of landmarks may be left unchanged:
K2451 (Airport or Airfield);
K2582 (Cemetery);
C3022 (Summit or Pillar); and
C3081 (Locale or Populated Place).
Also, due to Title 13 privacy concerns, any landmark with an MTFCC shown in Table 3 below cannot be added to the MAF/TIGER System as a point landmark. The MAF/TIGER System no longer maintains any point landmarks with these MTFCCs. Landmarks with these codes could identify a residence or private business. Thus, it is also important not to add any of the point landmark types shown in the table using alternative MTFCCs.
Table 3: Restricted Point Landmark MTFCCs
MTFCC |
Description |
K1100 |
Housing Unit Location |
K1121 |
Apartment Building or Complex |
K1122 |
Rooming or Boarding House |
K1223 |
Trailer Court or Mobile Home Park |
K1226 |
Housing Facility/Dormitory for Workers |
K1227 |
Hotel, Motel, Resort, Spa, Hostel, YMCA, or YWCA |
K1228 |
Campground |
K1229 |
Shelter or Mission |
K1232 |
Halfway House/Group Home |
K1233 |
Nursing Home, Retirement Home, or Home for the Aged |
K1234 |
County Home or Poor Farm |
K1235 |
Juvenile Institution |
K1241 |
Sorority, Fraternity, or College Dormitory |
K1251 |
Military Group Quarters |
K1299 |
Other Group Quarters Location |
K2100 |
Governmental |
K2197 |
Mixed Use/Other Non-residential |
K2300 |
Commercial Workplace |
K2361 |
Shopping Center or Major Retail Center |
K2362 |
Industrial Building or Industrial Park |
K2363 |
Office Building or Office Park |
K2364 |
Farm/Vineyard/Winery/Orchard |
K2366 |
Other Employment Center |
K2424 |
Marina |
K2500 |
Other Workplace |
K2564 |
Amusement Center |
Once you have completed your BAS updates, you must complete a review of your change polygons to ensure that:
The polygons have no unintended holes (e.g., you annexed several faces but missed a traffic circle or small pond).
All boundary corrections meet a minimum size threshold (very small corrections cannot be processed).

Prompt submission of updates is appreciated. It benefits the Census Bureau—allowing us to review the files early, provide feedback, and avoid backups in file processing—and you—guaranteeing your updates are recorded accurately and are reflected in the latest releases of Census Bureau data products.
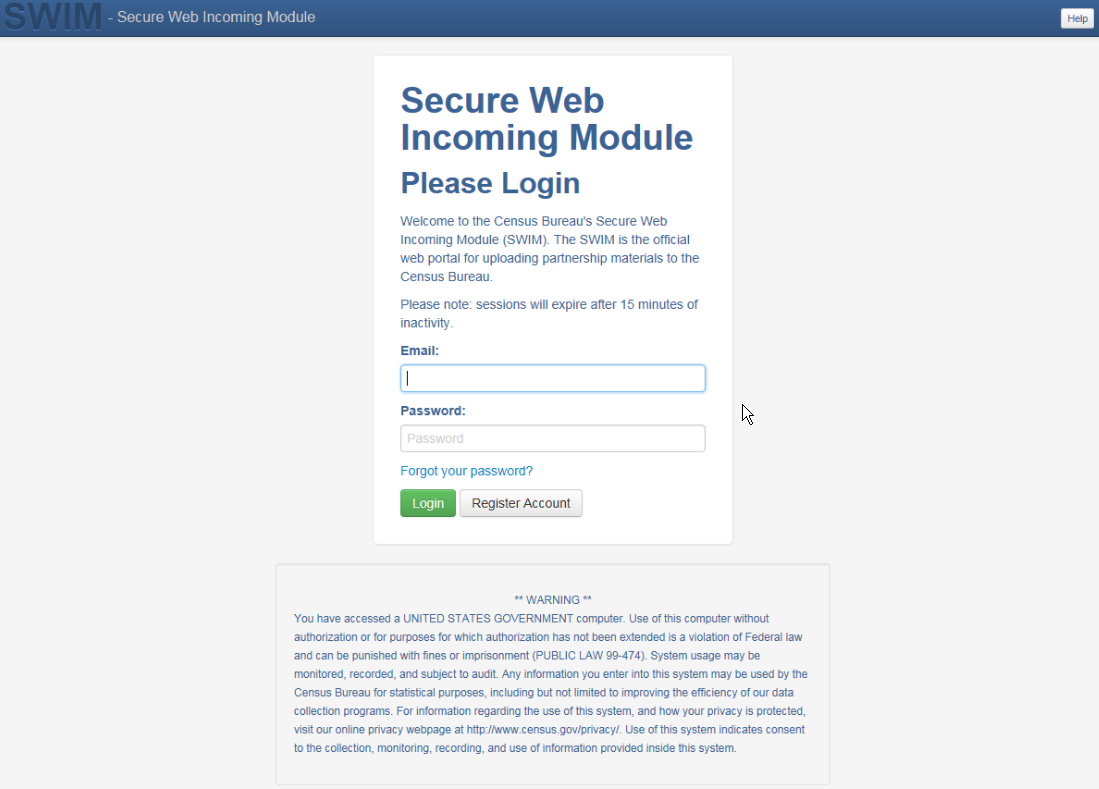
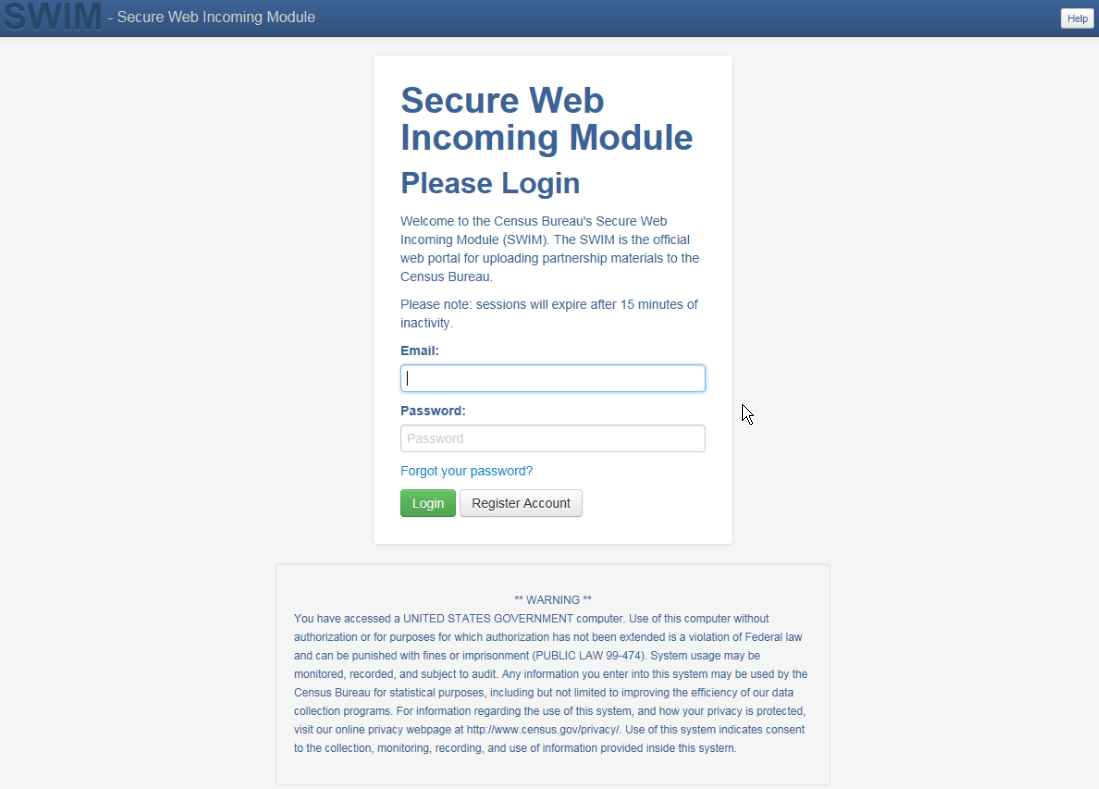
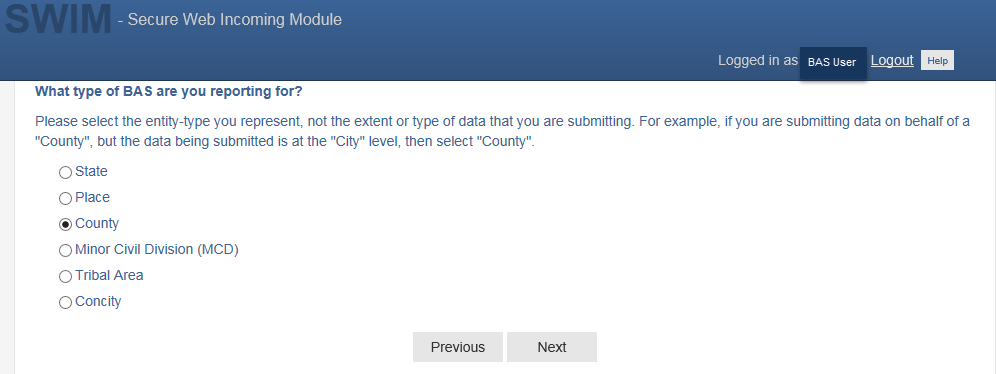
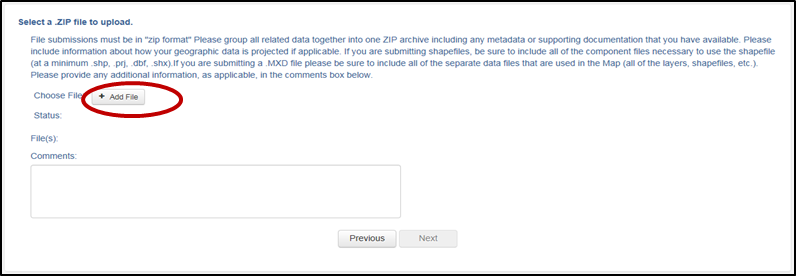
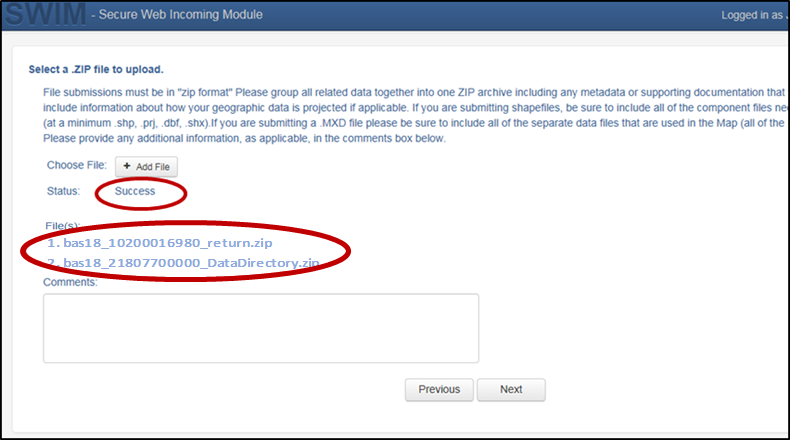
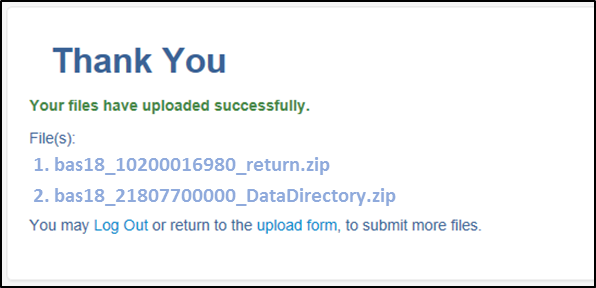
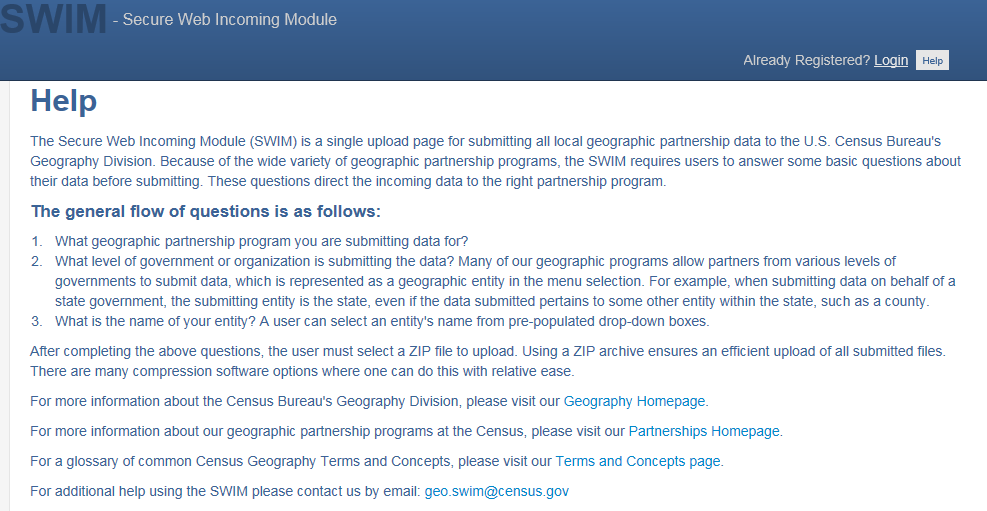
For those with Internet access, all BAS submissions must be made via the Secure Web Incoming Module (SWIM). Due to security reasons, we cannot accept files sent via email or through our alternate ftp sites.
If you indicated on your “Annual Response Form” that you wished to receive the GUPS application, you will automatically receive the SWIM URL and a registration token via email. The email should arrive 5 days after the Annual Response is completed online (or 5 business days after the Census Bureau receives the paper form).
The registration token allows you to establish a personal SWIM account. If you do not receive a SWIM token after the amount of time specified, email [email protected] or call 1‑800‑972‑5651.
Once registered, you will no longer need the token to log into the system.

For step-by-step instructions to submit files through the SWIM, refer to Table 49. For those without Internet access, see Section 3.3 below.
If you do not have Internet access, you may copy your ZIP file(s) to DVD for submission. The DVD should be mailed to:
U.S. Census Bureau
National Processing Center
ATTN: BAS Returns, Bldg 63E
1201 East 10th Street
Jeffersonville, IN 47132
This section includes information needed to use GUPS. It offers a description of the GUPS application and gives specific instructions (in the form of Step / Action tables) for how to use GUPS to make BAS updates. Reminder: this guide is equipped with shortcuts to subjects that respondents may want to jump to directly. To move directly to one of these sections, click on the linked text.
Part 1: Requirements and installation
Getting Started - Lists the hardware and software requirements for GUPS and SWIM; and
How to Install GUPS - Provides instructions for installing the application.
Part 2: Using GUPS (Basics and Map Management)
How to Access BAS Shapefiles - Provides instructions to open GUPS, start a project, and load shapefiles;
How to Start a New Project Using GUPS to Import Data from the Census Bureau’s BAS Website (Recommended Method);
Download Shapefiles from the Census Bureau ftp2 Site;
Use GUPS Interface - Including the Menu, Toolbars, Table of Contents or Map Legend, and the Map View area;
Menu & Toolbars - Offers instructions for using the tools available through the menu and toolbars;
How to Import User-Provided Data into GUPS;
How to Upload User-Provided Data Layers; and
How to Import a Shared ZIP Shapefile.
Part 2: Making BAS Updates in GUPS
How to Update Legal Boundaries - Gives instructions to make required and optional updates in the application;
Adding a New Legal Entity (New Incorporation) and Deleting an Entity (Disincorporation);
Making a Boundary Update on a County Line;
Making a Legal Boundary Change for a Consolidated City;
Making a Boundary Correction (Add Area/Remove Area);
Adding a Geographic Corridor and How to Add a Geographic Offset;
How to Update Linear Features;
How to Update Area Landmarks and Hydrographic Areas;
How to Update Point Landmarks;
How to Use GUPS Review and Validation Tools;
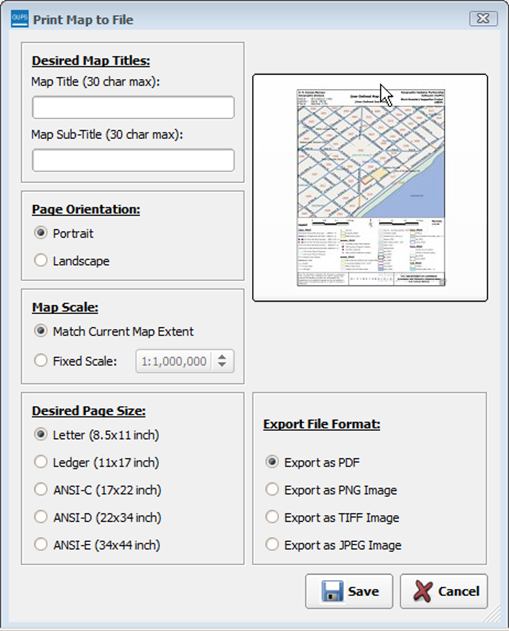
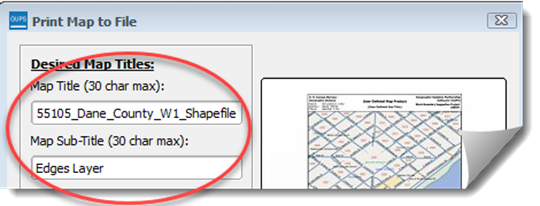
Export a Printable Map;
How to Export ZIP Files to Share/Submit; and
Submitting Files Through SWIM.
Download GUPS from the BAS Web site at: <https://www.census.gov/programs-surveys/bas/technical-documentation/gups-instructions.html>. If you requested and received the GUPS package, it should include a DVD containing the GUPS software, respondent guides, and a readme text file.
Before beginning the installation, check your computer to verify that it has the capabilities need to run GUPS (using Table 4 below).
GUPS is based on QGIS (formerly known as Quantum GIS), a free and open-source desktop geographic information system application. You can learn more about QGIS at <http://www.qgis.org/en/site/>. The GUPS application was developed for use in a desktop PC or a network environment.
Table 4 lists the hardware and software requirements to install and run GUPS. Also included are the software requirements to: (1) play training videos available within the application and (2) submit files through the SWIM Web site.
Table 4: GUPS Hardware and Software Requirements
Hardware |
Operating System |
Browser |
Disk Space Needed to Run GUPS: 2.0 GB Disk Space Needed to Store Shapefiles: Shapefile sizes vary. To view the size of your shapefiles, select a file/ folder, right-click, and choose Properties in the drop-down menu. The Files Properties box opens and displays the file/folder sizes. Select multiple files/ folders in the list to view their properties via the same method. RAM:
|
Windows: To run GUPS, users need one of the following Windows operating systems:
Apple Mac OS X: Mac OS X users must secure a license for Microsoft Windows and use a Windows bridge. The suggested bridge software is Boot Camp, which comes pre‑installed on all Mac computers. See instructions for using Boot Camp at: <https://www.apple.com/support/bootcamp/getstarted/>. Important Note: Since Boot Camp requires you to restart your computer to set up the bridge, be sure to print the instructions provided at the URL above before you begin. |
Minimum Browser Versions to Play Training Videos:
Minimum Browser Versions to Use SWIM:
|
Depending on the Windows OS version, the GUPS dialog boxes may have a different appearance than the screenshots contained in the user guide, although the content is the same.
To install the GUPS application you must have Administrator privileges for your computer. If you already have GUPS downloaded, please make sure you are using the most current version. Compare the version on your computer with the one provided on the Census Bureau’s installation DVD to acquire the latest version. To complete the installation, follow the steps in Table 5: Install the GUPS Application.
Note: If you already have a version of GUPS installed, please check to make sure you are running the latest version. Go to the GUPS tab and click the About GUPS option in the drop‑down menu to find the GUPS version number. If you are not running the latest version, download and follow the setup instructions which will automatically uninstall the old version before it installs the latest GUPS version.
Table 5: Install the GUPS Application
Step |
Action and Result |
Step 1 |
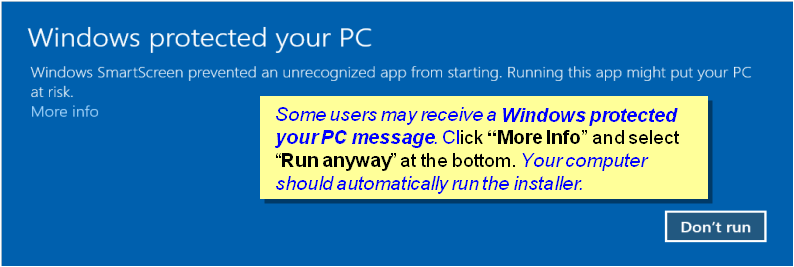
Click the direct download link <https://www2.census.gov/geo/pvs/gups/> or place the installation DVD into your computer’s DVD drive. For some users, a Windows protected your PC pop‑up box may appear.
To continue, click ‘More info’, then select ‘Run anyway?’. |
Step 2 |
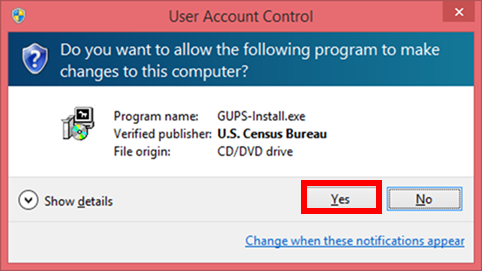
Other users may receive a user account control pop-up that asks, “Do you want to run this file?”, “Do you want to allow the following program from an unknown publisher to make changes to this computer?”, or a similar query. See an example below.
If you receive such a pop-up, click ‘Run’, ‘Yes’, ‘Allow’, or an option that allows you to proceed. The software should begin to run automatically. |
Step 3 |
If the software does not run automatically, open Windows Explorer, navigate to your DVD drive, and double-click on the file named Setup-7.0.0-x.bat. Note: The name of this file may vary slightly, but it will be the only setup .bat file available. If the software still does not run properly, contact your System Administrator for assistance. |
Step 4 |
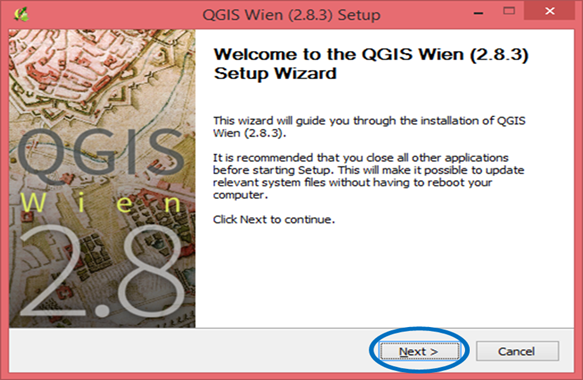
When the installer opens, the Welcome to the QGIS Setup Wizard screen appears.
Before proceeding, close all other programs or applications you have open. Once other programs and applications are closed, click the Next button. |
Step 5 |
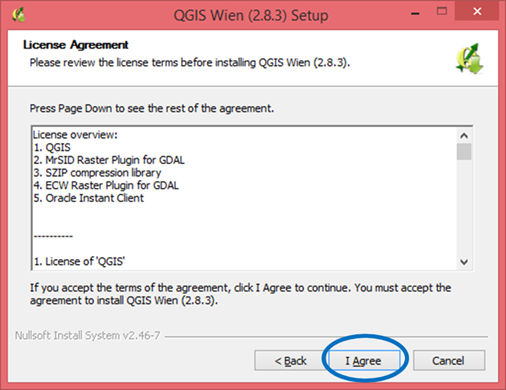
The License Agreement screen appears.
Read the License Agreement and click the I Agree button to continue. |
Step 6 |
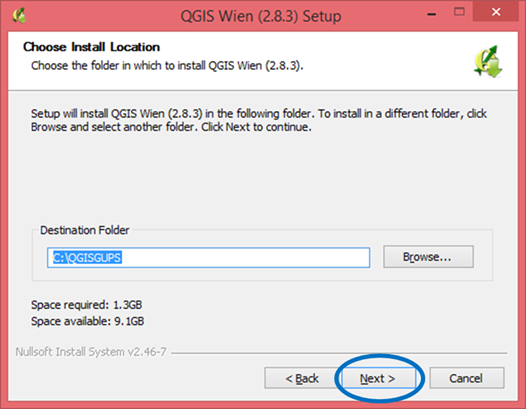
The Choose Install Location screen opens. We recommend you install the application at the default location (i.e., C:\Program files\QGISGUPS).
To begin the installation, click Next to continue. |
Step 7 |
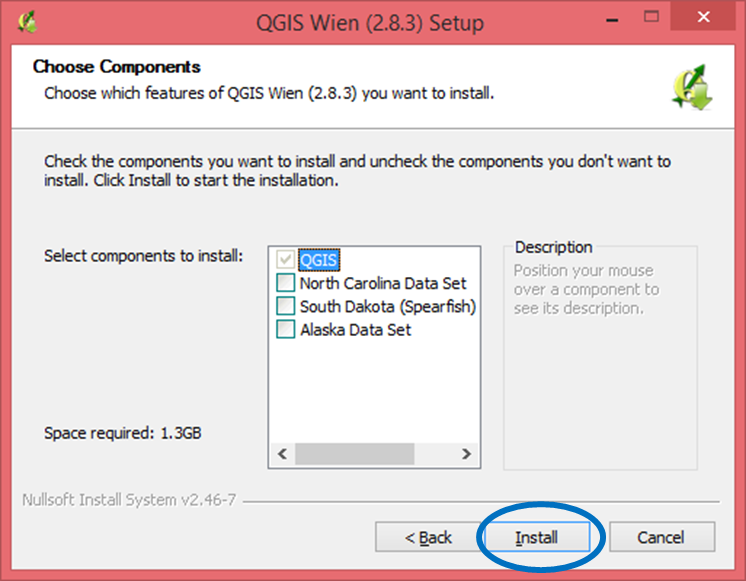
The Choose Components screen opens.
‘QGIS’ in the Select components to install field is grayed out since it is the default. You do not need to select it, simply click Install to continue. |
|
If you want to review a previous screen or reread the license agreement, click the Back button (each screen contains this button). This returns you to the previous screen. |
Step 8 |
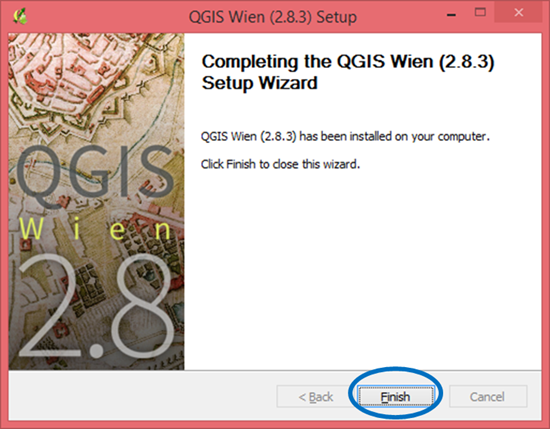
The software should take between 5 and 10 minutes to install. When it is finished, the Completing the QGIS GUPS Setup Wizard screen opens.
Click the Finish button. |
Step 9 |
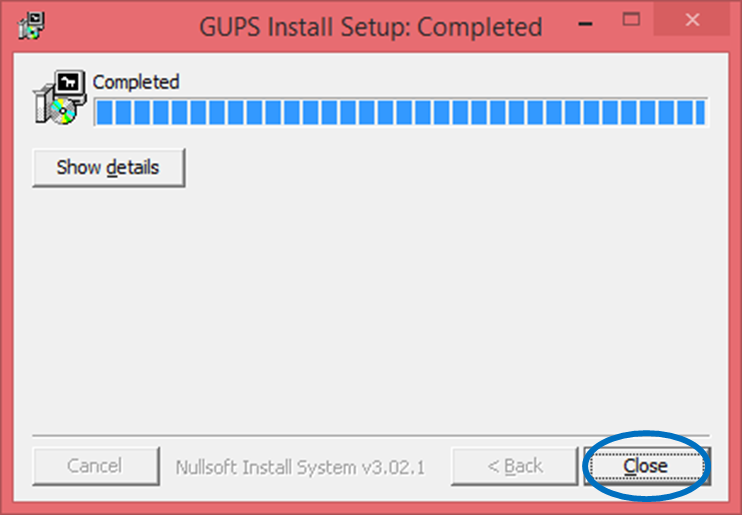
After you click finish, the GUPS Install Setup: Completed screen opens showing the status of the installation of GUPS on your computer. When completed, you click the close button on the following screen.
|
Step 10 |
To complete the installation, click the Close button at the bottom of the GUPS Install Setup: Completed Setup Wizard screen. Once the application installs, a QGIS icon appears on your desktop. |
After successfully installing GUPS, you are ready to start your BAS updates. There are three ways to retrieve shapefiles when starting a new project:
From the Census Web site (loads directly into GUPS);
From DVD (if one was requested); and
From My Computer (if you downloaded them to your hardrive).
Table 6 shows the steps to open GUPS and start a new project using the Census Web site. shows the same steps to open GUPS, but starts a new project using the Census provided DVD or My Computer (downloaded Census shapefiles saved to your hard drive).
BAS shapefiles from the BAS Web site can be pulled directly into the application when working in GUPS. Users can load the shapefiles as needed or load multiple county files at once. This is the preferred method for loading the Census Bureau’s BAS Shapefiles into GUPS as it ensures that required files are placed in the correct location for the application to access.
Another option for loading files is to download the shapefiles to your hard drive from the BAS Web site (or from the Census Bureau ftp2 site), then import them into GUPS. BAS shapefiles are also available for download from the BAS Web site here: <https://www.census.gov/geographies/mapping-files/2019/geo/bas/2019-bas-shapefiles.html>. Instructions for how to download Census Bureau shapefiles to your hard drive appear in Table 6 and Table 7. Downloading files to your hard drive is not the preferred method when working in GUPS, and should be used only when necessary (e.g., you need additional data layers that GUPS does not automatically load and want to pull them in as user-provided data).
If you have requested to receive the shapefiles on DVD, you can also load the files directly into GUPS from the DVD. Instructions for how to load shapefiles are contained in Table 6: Start a New Project Using Shapefiles from the BAS Web site.
Whether the files are pulled from the BAS Web site or from the DVD, the GUPS application unzips them and places them into a pre‑established folder created on your computer’s home directory during the installation process (C:\GUPSGIS\gupsdata\BAS2019\shape). It then displays them in the application. GUPS then manages the files for you. You do not need to take any further action.

How to Start a New Project Using GUPS to Import Data from the Census Bureau’s BAS Website (Recommended Method)
To open the GUPS application and begin your BAS updates, follow the steps in Table 6 below. Before beginning, note that:
If you wish to practice using GUPS without committing the changes you make, simply exit the system without saving. Before the system closes, it will give you the option to discard the changes.
If you feel comfortable with the system, but you do not want to make all your changes in one session, simply save your changes, then close the system. When you open GUPS later, it will allow you to reopen the project and continue working.
Note: In all the Action/Result tables, the action is ususally a command or action you need to perform and the Result(s) of the action will be shown in italics. For example: if you click the QGIS icon on your desktop, the software should begin to run automatically.
Table 6: Start a New Project Using Shapefiles from the BAS Web site
Step |
Action and Result |
Step 1 |
Double-click the QGIS icon on your desktop.
The QGIS splash screen appears. (Note: QGIS is the open-source platform on which GUPS is built.)
|
Step 2 |
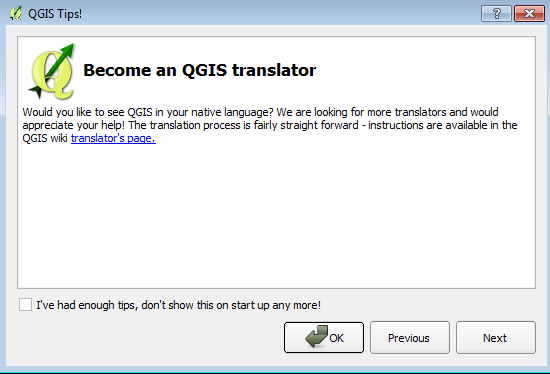
Wait until the application loads (If you have an older computer, this may require a few minutes). When the GUPS application has loaded, the GUPS main page opens and the QGIS Tips! box appears.
Note: Since GUPS was built on the QGIS open-source platform, you may see references to QGIS in several locations within the GUPS application. |
Step 3 |
If you wish to view QGIS system tips, click the Next button to read the first tip. Thereafter use the Previous and Next buttons to navigate within tips. If you do not wish to see tips again, click the checkbox in the bottom left-hand corner that reads ‘I’ve had enough tips, don’t show this on start up any more!’ |
Step 4 |
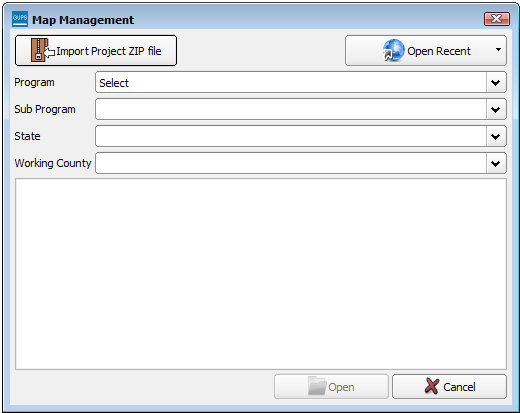
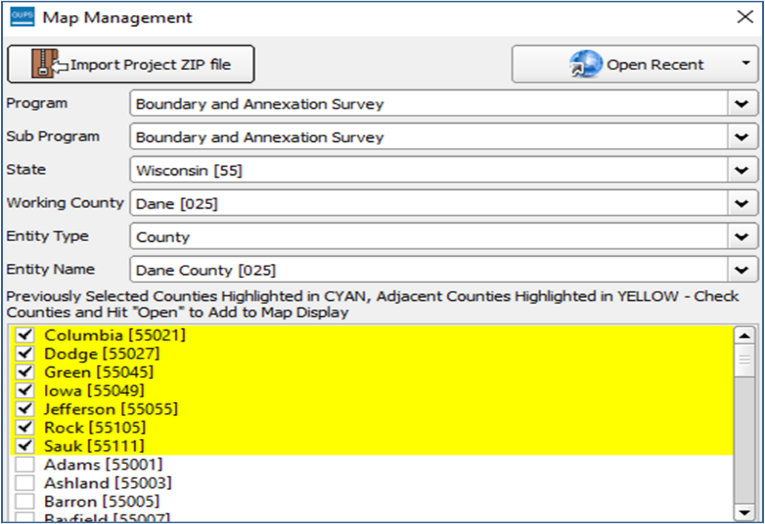
To begin a GUPS project, close the QGIS Tips! box by clicking the OK button. The box closes and the Map Management dialog box opens, as shown below.
|
Step 5 |
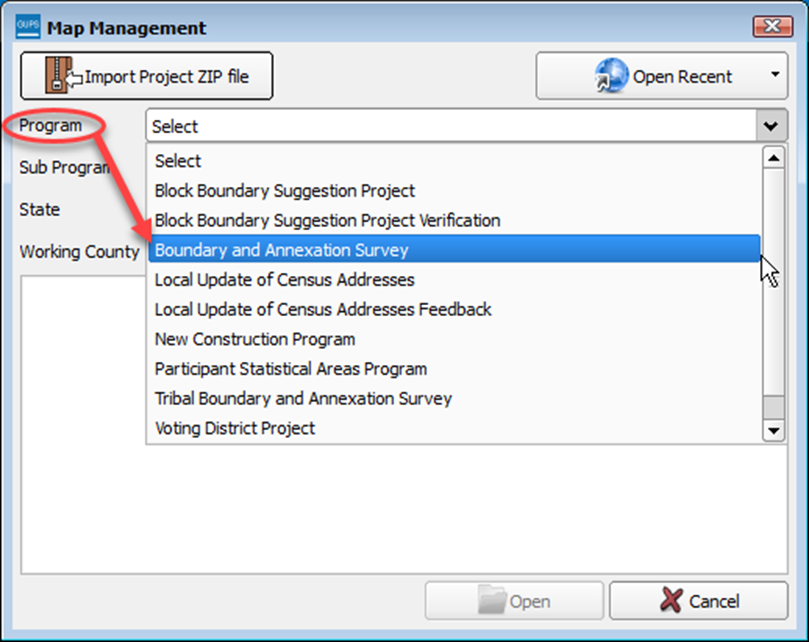
In the Map Management dialog box, use the drop-down menu next to the Program field to select your program, ‘Boundary and Annexation Survey’. ‘Boundary and Annexation’ populates the field.
|
Step 6 |
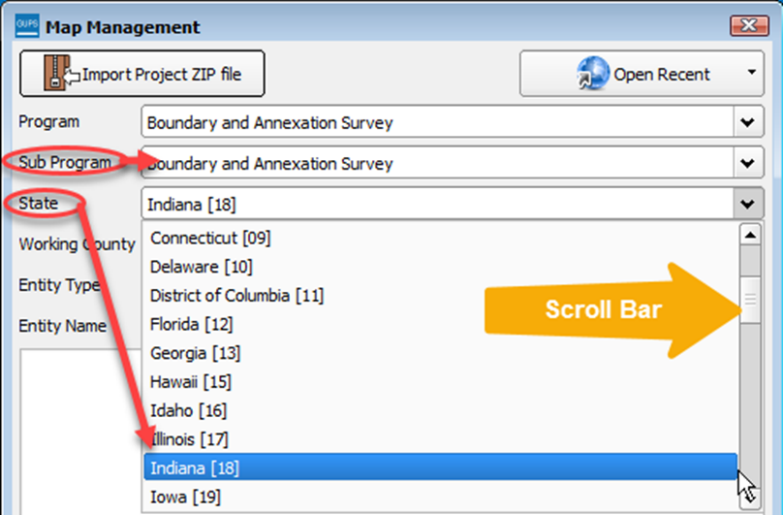
In the Sub Program field, select ‘Boundary and Annexation Survey’. In the State field, use the drop-down menu to select your state. The scroll bar to the right allows you to move up and down the list of states.
This example uses Indiana. |
Step 7 |
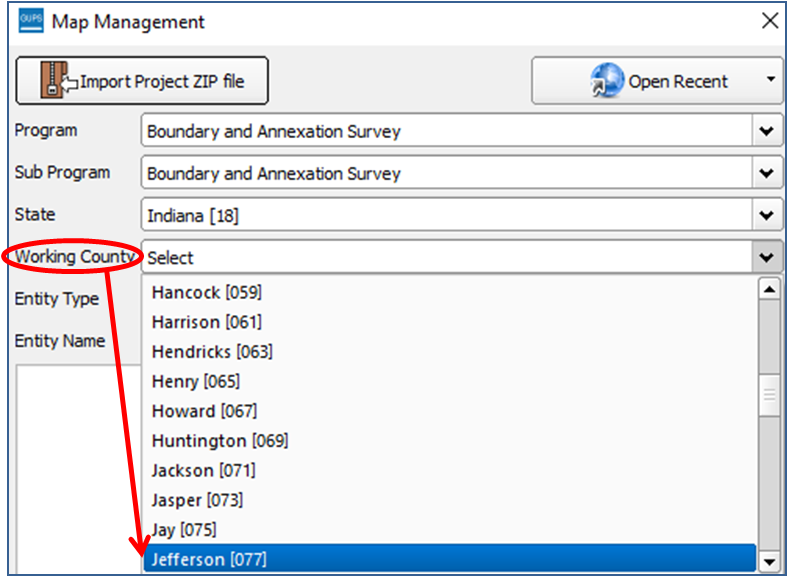
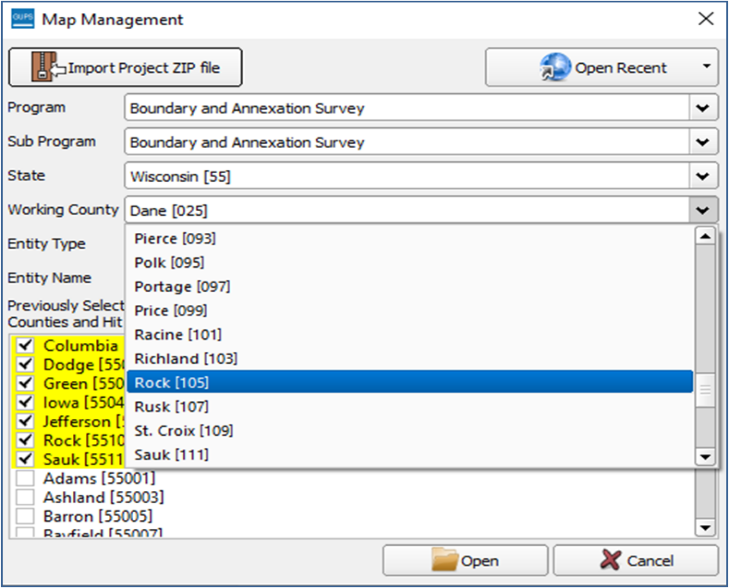
In the Working County field, use the drop-down menu to select the county for which you wish to make updates. This example uses Jefferson County, Indiana. |
|
|
|
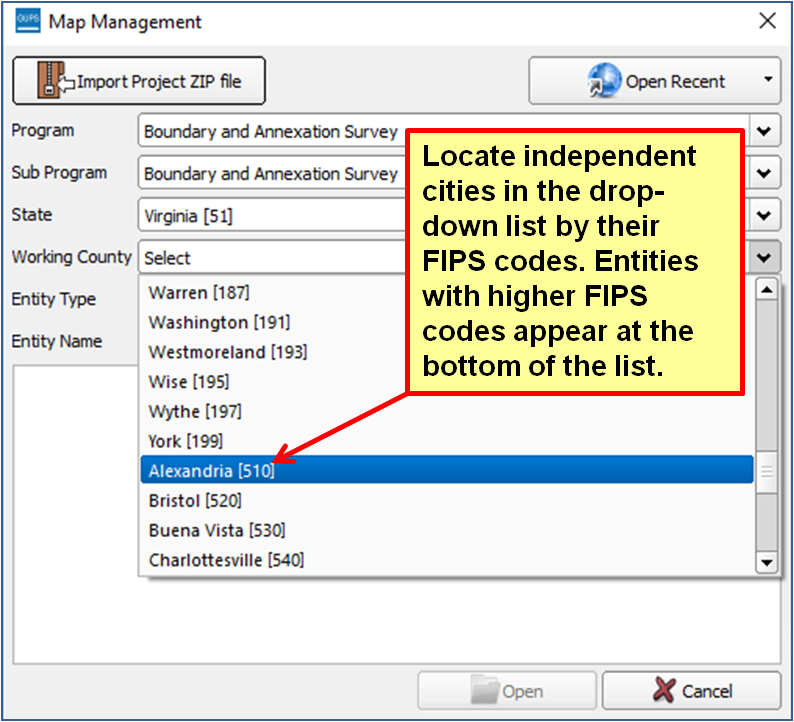
Independent City Users Note that the Working County drop-down menu is sorted by FIPS code. Thus you must search for your city’s code rather than assuming it will appear alphabetically. A portion of the Working County drop-down list (we used the State of Virginia for this example) appears below, showing independent cities near the end of the list because their FIPS codes are higher.
|
Step 8 |
After you select the working county or counties, GUPS asks you to specify the location from which you want to pull the county’s (or county equivalent’s) shapefile. The Select Data Folder, Directory or Location box opens.
|
|
GUPS will only ask you to specify a location the first time you open a county’s shapefile. When you come back to work on the same county again, the shapefile will automatically load, even if you made no changes in your first session. |
Step 9 |
In the Select Data Folder, Directory or Location box drop-down menu, select the location from which you wish to pull the file. This example assumes the user is pulling the data from the BAS Web site, so click on ‘Census Web’ in the drop-down menu.
|
Step 10 |
Once you click on ‘Census Web’, the shapefile for the county begins to load and progress is displayed by a blue striped bar (color may vary), with the percentage of the upload completed displayed to the right.
|
Step 11 |
As GUPS loads the data, it unzips and copies the files to a folder that was created on your computer’s home directory during the installation process. It then pulls the file into the GUPS application. |
Step 12 |
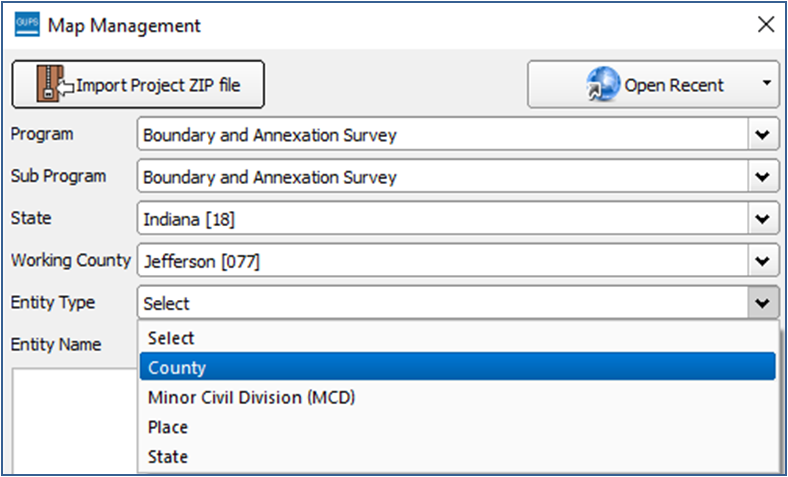
Once finished loading, the Map Management screen allows you to now enter the the entity type. In the Entity Type field drop-down menu, select the entity type you represent. The options are ‘Consolidated City’, County’, ‘Minor Civil Division (MCD)’, ‘Place’, and ‘State’. Note: The options you see may vary, depending on the entity types your state contains. Independent city users should select ‘Place’. This example assumes a ‘County’ user.
|
Step 13 |
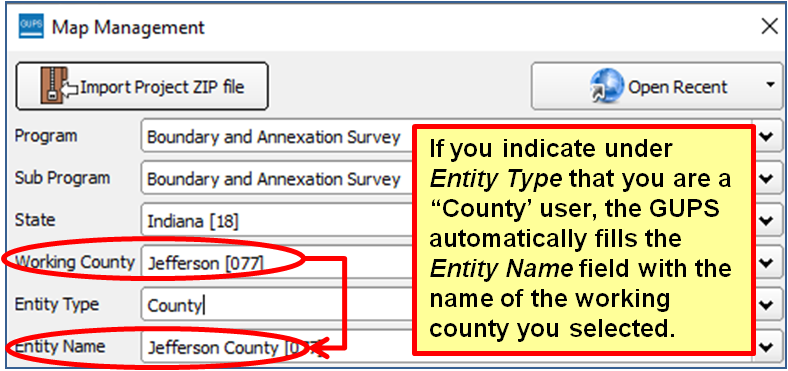
After the entity type is selected, an Entity Name field appears. Since you selected the entity type ‘County’, and you already named Jefferson County as your working county, GUPS automatically fills the Entity Name field with ‘Jefferson County.’
|
|
If you select ‘Consolidated City’ as your Entity Type, the name of the consolidated city-county government automatically fills the Entity Name field. If you select ‘Place’ as your Entity Type, the Entity Name field is blank. A drop-down menu, which lists all incorporated places within the working county, allows you to select your entity. If you select ‘State’ as your entity type, the state you selected in the State field automatically fills the Entity Name field. |
Step 14 |
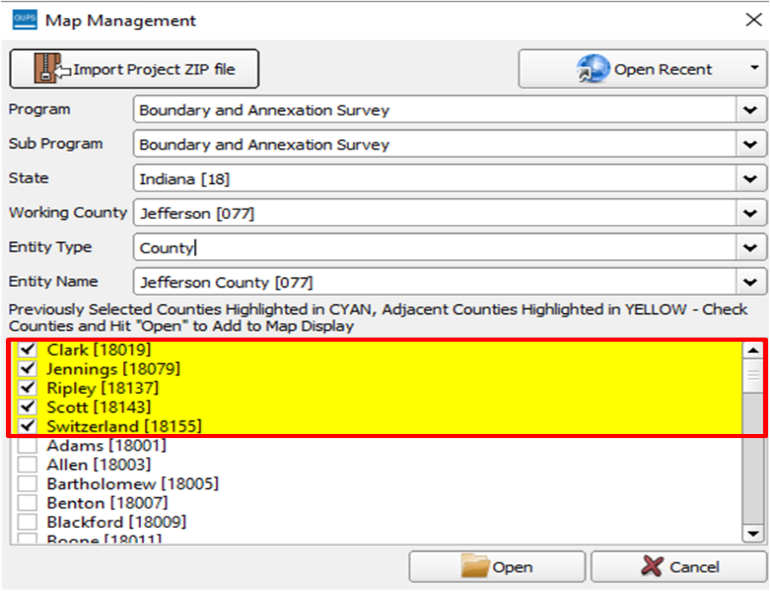
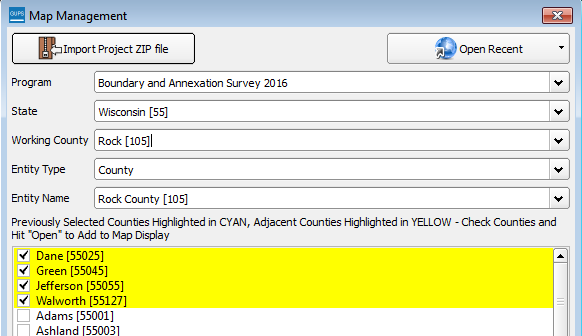
In all cases, a list of the counties in the state appears at the bottom of the Map Management dialog box. Adjacent counties (counties whose borders touch the working county) are highlighted in yellow and checked.
|
Step 15 |
All checked counties will display in the Map View. Uncheck the box for any county you do not wish to see. To select additional counties to display (you may choose up to a total of 10 at once), check the checkboxes next to them. Scroll down using the scroll bar to the right to see the full list of counties. |
Step 16 |
For this example, we
select neighboring Clark and Jennings Counties. Check the
checkboxes next to these counties, then click the Open
|
Step 18 |
As GUPS loads the data, it unzips and copies the files to a folder that was created on your computer’s home directory during the installation process. It then pulls the file into the GUPS application. The data layers for Jefferson County appear in the Table of Contents and the maps for the selected adjacent (or other selected counties) appear next to that for the working county in Map View. In our example, as shown below, Map View displays the maps for Jennings and Clark Counties next to that for Jefferson County.
|
Step 20 |
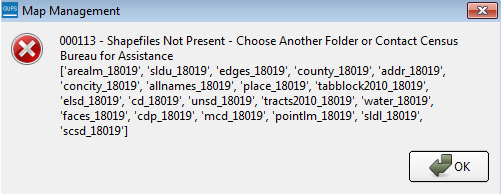
If for any reason shapefiles are missing from the location you chose in the Select Data Folder, Directory or Location drop-down menu, or the files are corrupted and cannot be loaded, you will receive an error message such as the one shown below.
|
Step 21 |
Click OK to return to the Map Management dialog box. |
Step 22 |
You may try loading the
file(s) from another location. Simply click the Open
button at the bottom of the Map
Management box.
The Select Data Folder, Directory or Location dialog box reopens, allowing you to select another option for securing the files.
|
|
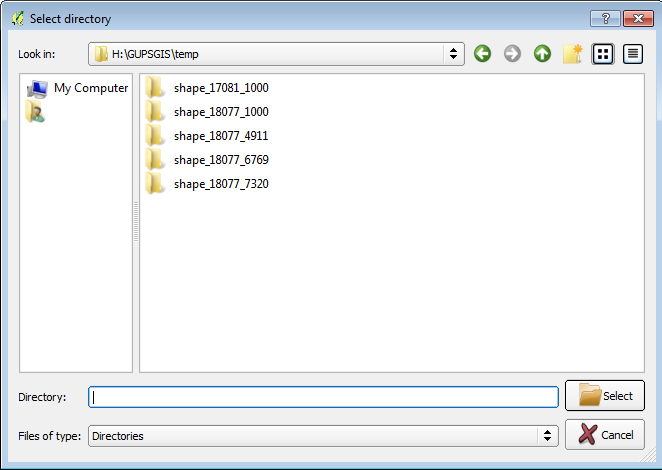
If you have trouble loading shapefiles using the ‘Census Web’ and ‘CD/DVD’ options, follow the instructions in Table 6 or Table 8 to download the files to your computer from the BAS Web site or Census Bureau’s ftp2 site. Then pull them into GUPS using the ‘My Computer’ option in the Select Data Folder, Directory or Location drop-down menu. When you select ‘My Computer’ the Select directory screen opens.
On this screen, click on
the My Computer
icon in the left-hand corner.
Navigate to the location of the files you want to load, then select the files and click on the Select button at the bottom of the Select directory screen. GUPS unzips and loads the files, then moves them to the pre-established folder on your home directory. |
Step 23 |
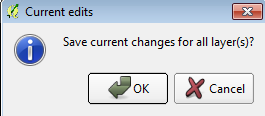
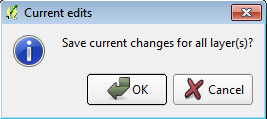
After working on a project, be sure to save before exiting. Otherwise your edits will be lost. To save, click the Save icon on the Standard toolbar.
The Current edits pop-up box asks if you want to save the changes for all layers.
Click OK. The changes are saved. |
Step 24 |
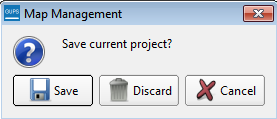
If you do not wish to save your changes, simply close the application (click the red X in the upper right-hand corner of the main GUPS page). A Save? pop-up warning asks if you want to save the project.
Click Discard not to save your project. |
Step 25 |
To reopen a saved project, in the Map Management dialog box, click the down arrow next to the Open Recent button. The drop-down menu opens with your project listed.
|
|
If you share a computer with other GUPS users, multiple project files may appear in the drop-down menu, as shown below. Here three separate users in Mississippi have created projects on the same computer.
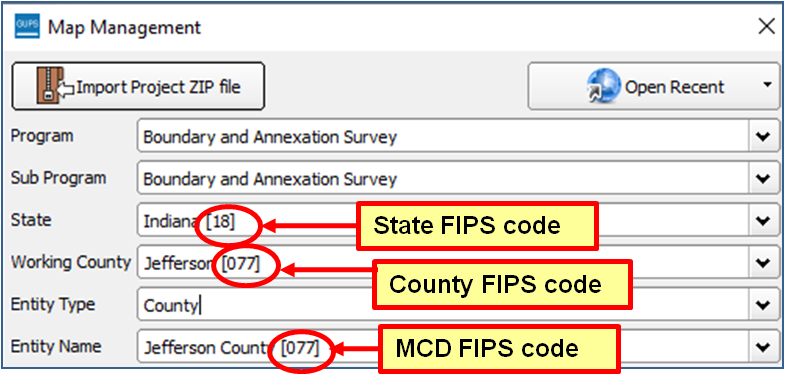
To identify which of the entries in the list represents your project, look at its number string. This string comprises your BAS ID. Each BAS ID is 11 digits. The first digit indicates the Entity Type (i.e., the user type) (0 = consolidated city; 1 = incorporated place; 2 = county; 3 = MCD; and 7 = state). The next two digits are the state FIPS code. The following three digits are the FIPS code for the working county (these digits are ‘000’ for incorporated places). The final five digits are the FIPS code for the specific incorporated place, consolidated city, or MCD that created the project (for counties, these digits are ‘00000’ since the county is already identified in the string).
The number string,
If you do not know the BAS ID information for your particular geography, it is available within the Map Management dialog box. Below is an example for Hanover Township, an MCD in Jefferson County, Indiana.
|
Step 26 |
Once you have identified the correct file to reopen, select it from the list. The map for the project automatically loads and the layers show in the Table of Contents. |
|
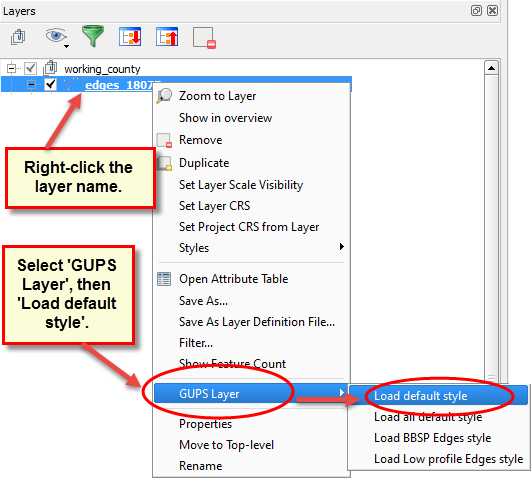
Census Bureau-defined default layers and view settings are loaded each time you start a new project in GUPS. If you change these settings for a project, when you save the project your new settings are also saved. Thus, when you reopen the project, the Table of Contents and Map View display the layers and the map according to the settings you were last using rather than returning to the Census Bureau default settings. To restore the default settings for a layer:
To reset the default settings for all layers, select ‘Load all default style.’
|
Step 27 |
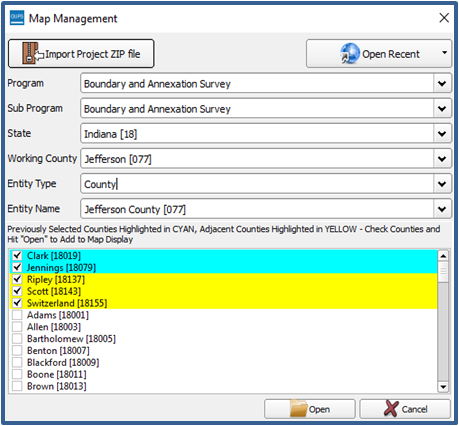
When you reopen a project, also note that any previously selected adjacent (or other selected) counties appear in cyan blue and remain checked. Other adjacent counties that have not previously been selected appear in yellow and are also checked, as shown below.
You may load files for additional counties at this point if you wish. |
|
Loading Multiple Files at Once The limit to how many county datasets can be loaded at once is 11 (the working county plus 10 other counties). To load shapefiles for additional counties, after the first 10 are loaded:
|
Follow the steps in below to download the files from the BAS Web site to your hard drive.
Table 7: Download Shapefiles from the BAS Web site to a Hard Drive
Step |
Action and Result |
Step 1 |
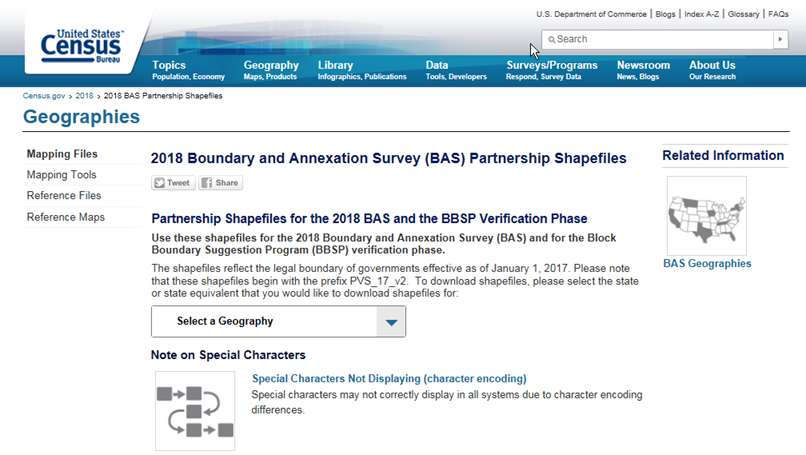
Enter the URL <https://www.census.gov/geographies/mapping-files/2019/geo/bas/2019-bas-shapefiles> into your Internet browser. The Boundary and Annexation Survey (BAS) Partnership Shapefiles page opens.
|
Step 2 |
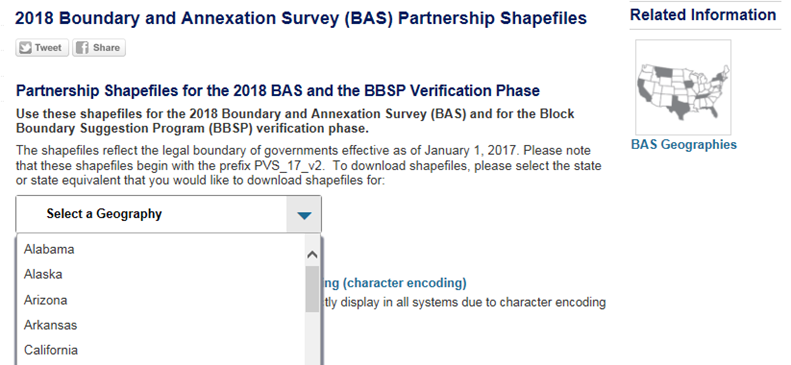
Under ‘2019 Partnership Shapefiles’, in the ‘Select a Geography’ drop-down box, select the name of state your entity is located in from the drop-down list ‘. The [State Name] Partnership Shapefile Batch Download page opens.
|
Step 3 |
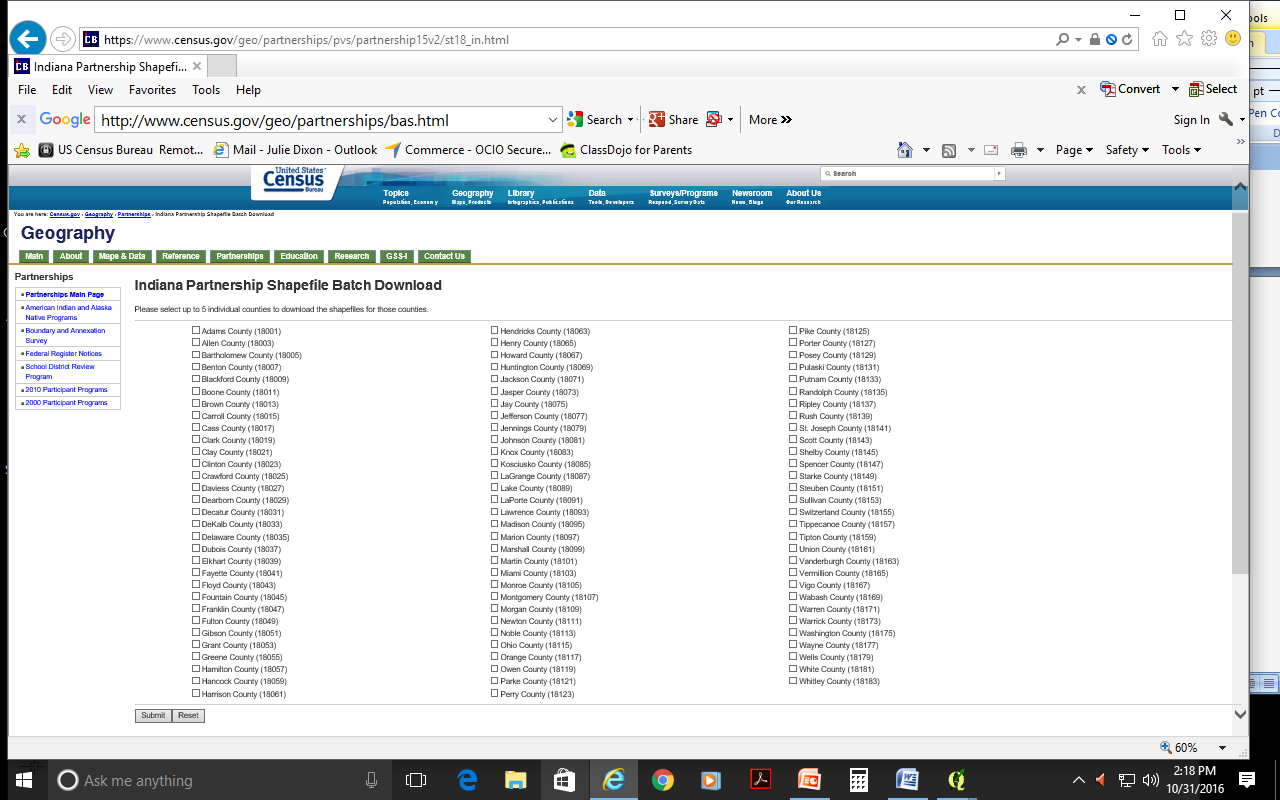
To select the county(ies) you need, click the box next to it. You may select up to five (5) counties at a time. Once you have selected the counties needed, hit the “Submit” button at the bottom left hand side of the page.
A prompt to save the file(s) appears.
|
Step 4 |
Click the down arrow next to Save and select ‘Save As’ in the drop-down list. The Save As dialog box appears, with the file appearing in the File Name field. If you selected more than one county, a single ZIP file containing the selected counties is saved. |
Step 5 |
In the Save As dialog box, select a location on your home directory to save the files. |
Step 6 |
Click the Save button. The file(s) are saved in the location you selected. |
Step 7 |
To obtain shapefiles for additional counties, repeat the download process as needed. |
Step 8
|
When you select your geography in GUPS, the application asks you to specify the location (‘CD/DVD’, ‘My Computer’, or ‘Census Web’) of your files. When you select ‘My Computer’, GUPS asks you to select a directory. Navigate to the location where you saved the files and select those you wish to upload. GUPS unzips and loads the files, then moves them to the pre-established folder on your home directory. |
Step 9 |
When the Select Data Folder, Directory or Location box opens, use the drop-down menu to select the location from which to pull the shapefiles. In this instance, we will load them from a Census Bureau-provided DVD. To do so, insert the DVD into your DVD drive, then select ‘CD/DVD’, as shown below.
The files for Clark and Jennings Counties begin to download and progress is displayed by the blue striped bar (color may vary), with the progress percentage noted to the right.
|
Step 10 |
If for any reason shapefiles are missing from the location you chose in the Select Data Folder, Directory or Location drop-down menu, or the files are corrupted and cannot be loaded, you will receive an error message such as the one shown below.
|
If you are a state level user, or if you would like to download shapefiles for several counties at one time to your hard drive, follow the steps in Table 8.
Table 8: Download Shapefiles from ftp2 Site to a Hard Drive (State Users)
Step |
Action and Result |
Step 1 |
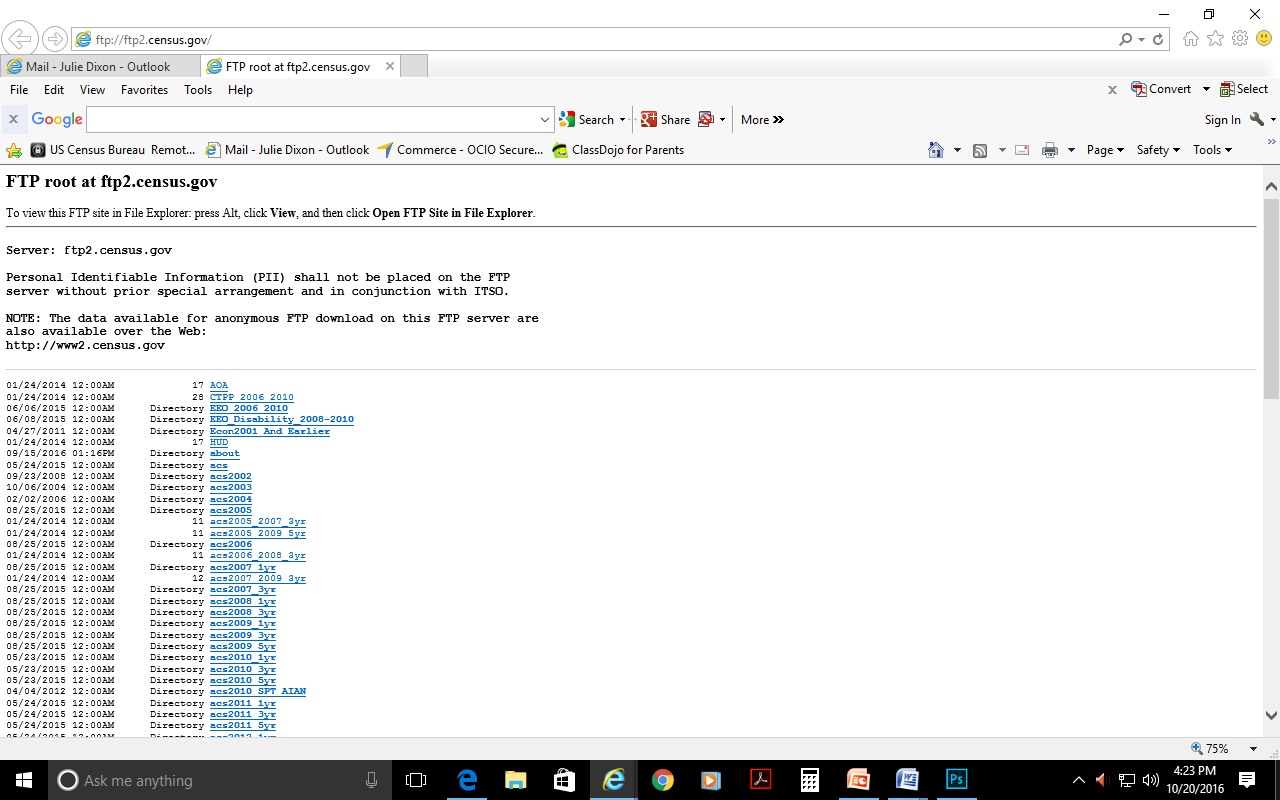
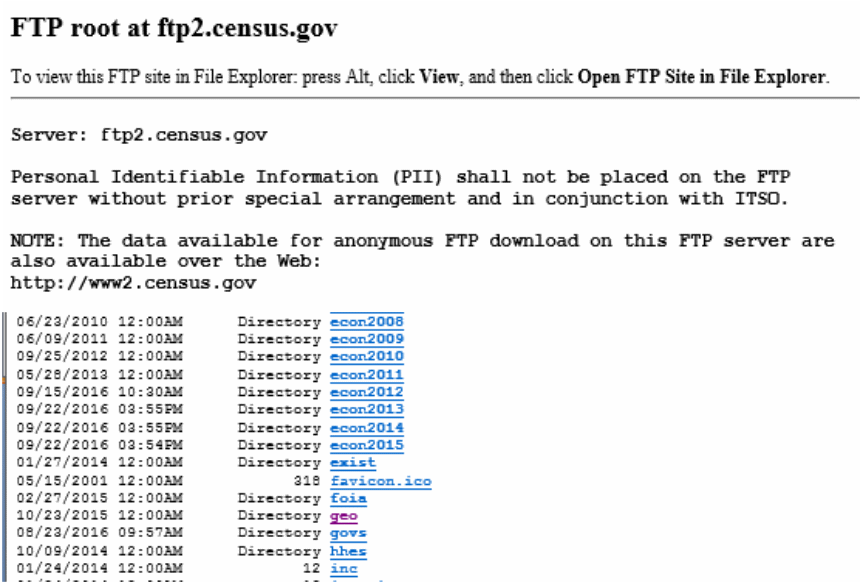
Using Internet Explorer (IE) or a web browser of your choice navigate to <ftp://ftp2.census.gov/>. The ftp root at ftp2.census.gov main page opens.
|
Step 2 |
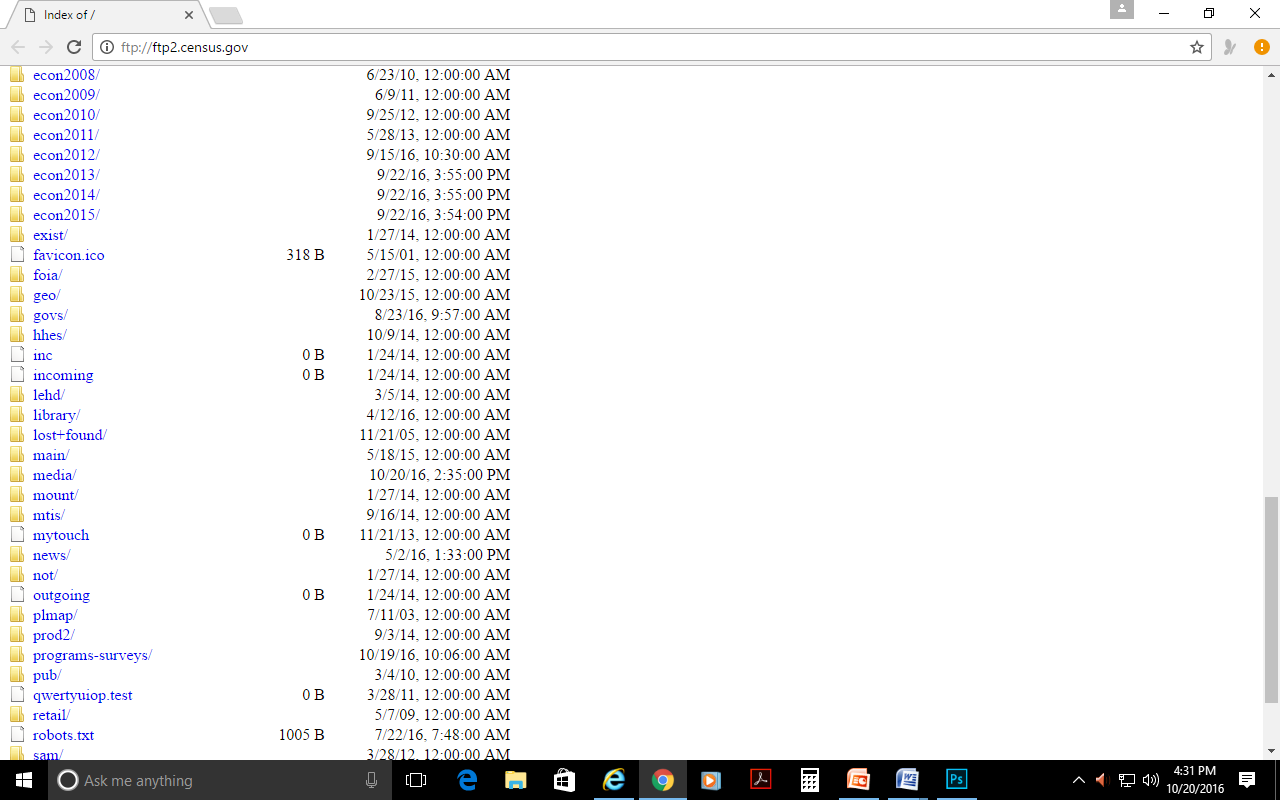
Press ‘Alt’ and click the ‘View’ tab on the browser menu and select “Open FTP site in File Explorer” to open the Census Bureau FTP site in Windows Explorer (sometimes called file explorer). If using Windows Explorer, you do not need a username or password to access the ftp2 site.
|
Step 3 |
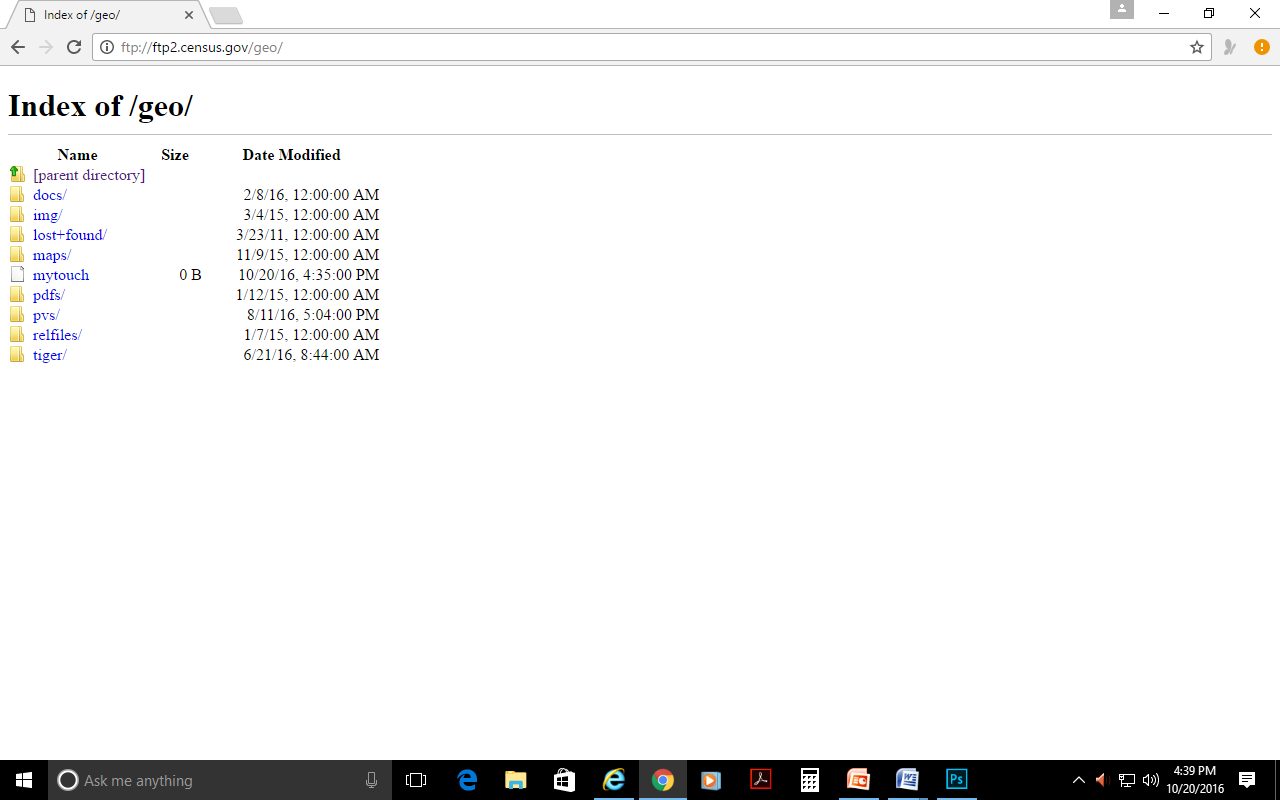
After the Census Bureau FTP site has been opened in file explorer, click the ‘geo’ folder.
|
Step 4 |
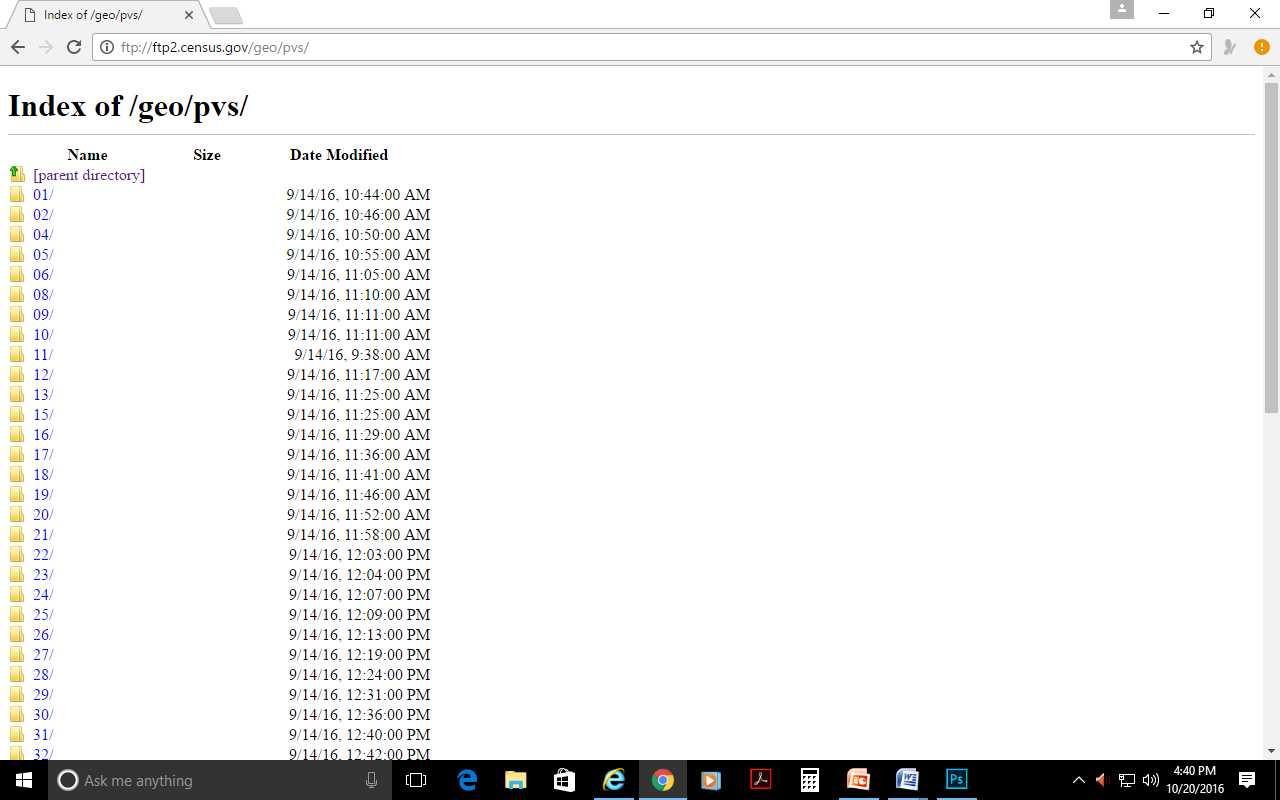
Within the ‘geo’ folder, click the ‘pvs’ folder.
|
Step 5 |
Select the state folder that contains the county(ies) for which you are downloading data. The state folders are represented using two-digital state FIPS codes. |
Step 6 |
There are several sets of shapefiles within each state directory. You will want to download the most recent partnership shapefiles. These shapefiles are contained within a zip file with the prefix partnership_shapefiles_18v2. Each zip file ends with a five-digit state-county FIPS code (e.g., 08051) which represents the county for which you are downloading data. Make sure to choose the filename with “18v2”, because the “18v1” files are sometimes also available in the folders. |
Step 7 |
Select the county or counties that you intend to download and copy to your local or network drive. You may copy the files to any location you wish. When you select your geography in GUPS, the application asks you to specify the location (‘CD/DVD’, ‘My Computer’, or ‘Census Web’) of your files. When you select ‘My Computer’, GUPS asks you to select a directory. Navigate to the location where you saved the files and select those you wish to upload. GUPS unzips and loads the files, then moves them to the pre-established folder on your home directory. |
|
If you have an ftp client software such as winscp or filezilla (or other) you may connect to <ftp://ftp2.census.gov/> without a password. Enter ‘anonymous’ as your user name and enter your email address in place of a password. |
Figure 2 shows the layout of the main GUPS page. This page contains all the tools needed for making BAS updates. All work is completed from this page. Shown in the figure are the main page elements. These include the:
Menu;
Table of Contents;
Map View (where the data displays);
Toolbars (Standard toolbar, BAS toolbar, and Add Layers toolbar); and
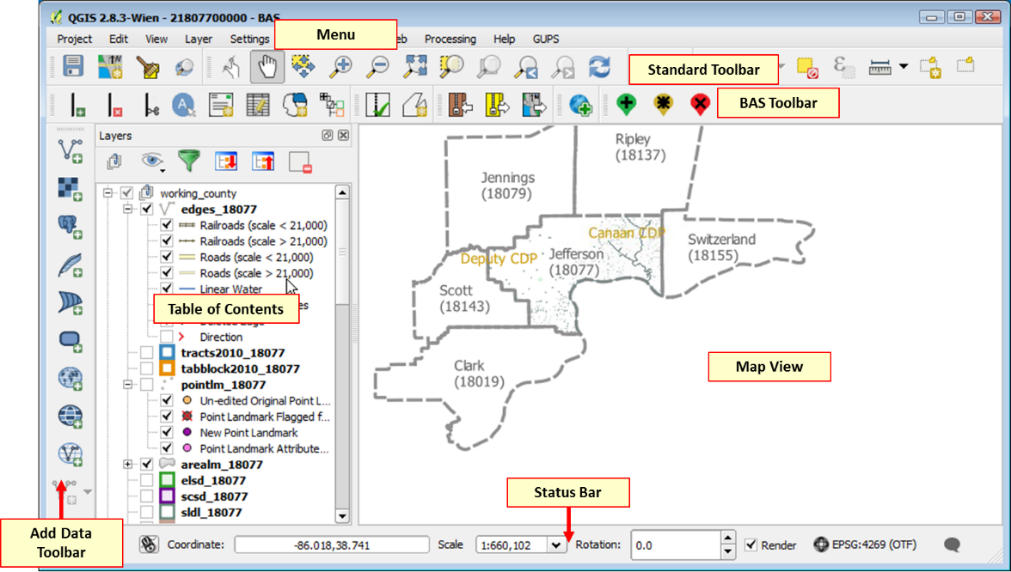
Figure 2. GUPS Main Page Layout
The purpose for each element on the main GUPS page is explained in Section 5.5.1 through Section 5.7.1 describes in detail the individual components and specific functions of each element.
Table 9: GUPS Main Page Elements
Page Element |
General Function |
Menu |
The menu offers basic features such as settings and help; tools to manage the map view and import user-provided data; important calculation, measurement, and geoprocessing tools; and tools needed to make shapefile updates. Note that almost all of the functions available from the menu are also available in the application’s more conveniently located toolbars.
|
Table of Contents |
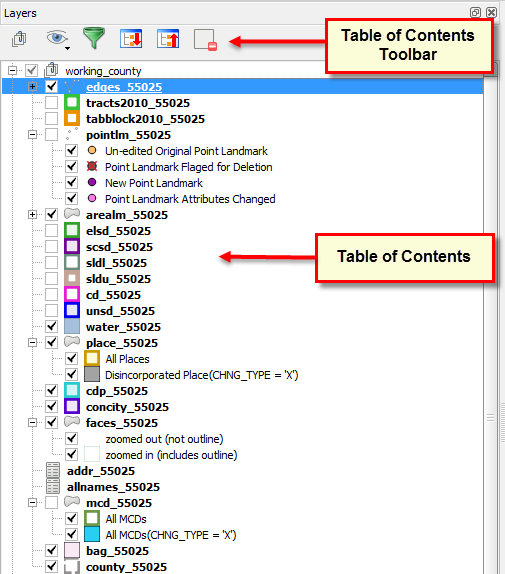
The Table of Contents shows the layers on the map for the county you selected. The Table of Contents toolbar allows you to add or remove layers (or groups), manage layer visibility, and filter the legend by map content
|
Map View |
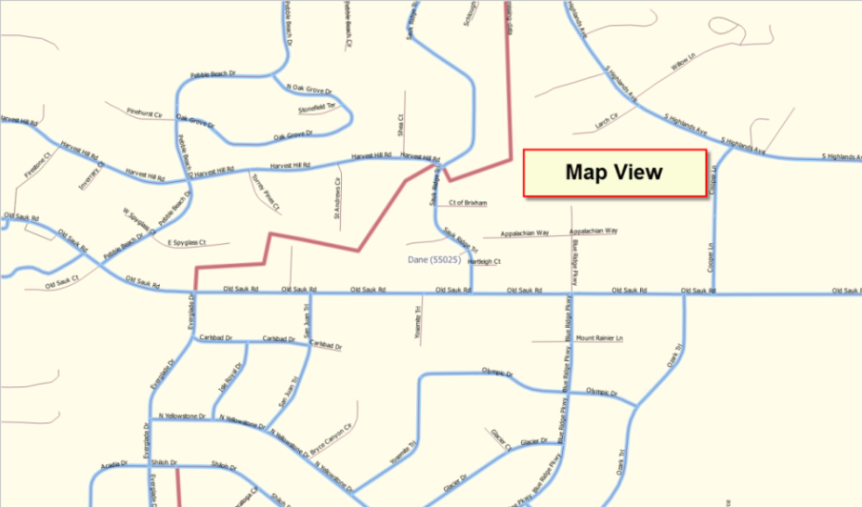
The Map View displays the data for the county you selected in the Map Management dialog box.
|
Standard Toolbar |
Provides the navigation and other tools needed to interact with the map and layers’ attribute tables.
|
BAS Toolbar |
Gives the specific tools needed to make bas updates, view linear feature attributes, review and validate changes, import and export zipped files, and print.
|
Manage Layers Toolbar |
Offers tools to import your own data. You may superimpose map layers in GUPS to compare the features on your own maps with those on the Census shapefiles. Note: although shown horizontally here, this toolbar appears aligned vertically to the left of the Table of Contents in the GUPS application.
|
Status Bar |
Displays information on the map scale, projection, and coordinates and allows you to adjust the display.
|
When you choose your program and geography in the Map Management dialog box, GUPS automatically loads a set of default data layers (and default layer groups) defined by the Census Bureau for the program you selected. As the map opens in Map View, the list of the preset layers (already grouped) appears in the Table of Contents.
You will use the Table of Contents and the small toolbar appearing at its top to manage your map view. Note that the Table of Contents and the Map View windows are interdependent. Selections you make in the Table of Contents are immediately reflected on the map display.
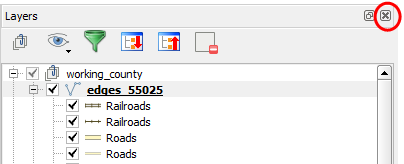
Figure 3. Close Table of Contents
You can close the Table of Contents at any time to see more of the map (just click on the small ‘x’ in the upper right-hand corner).To restore the Table of Contents, click the View tab on the Menu, select ‘Panels’ in the drop‑down menu, click the arrow next to ‘Panel’ to open the submenu, then click on ‘Layers’.
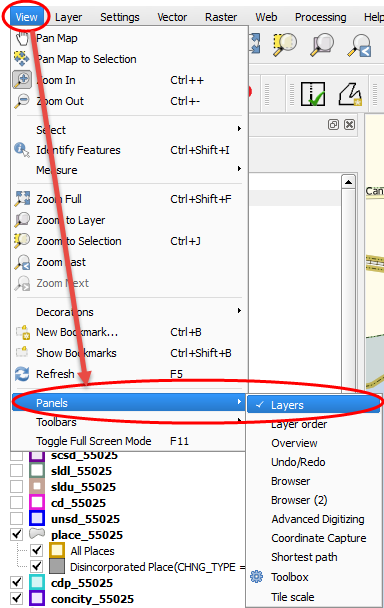
Figure 4. Restore the Table of Contents
The Table of Contents will then reopen and display in its default position on the page.
Within the Table of Contents, you can manage layer visibility (i.e., determine what layers display on the map), reorder data layers, and set new layer symbology.
Manage Layer Visibility
To add or remove layers from the map view:
Click the checkbox next to a layer to add it to the map view.

Uncheck the checkbox next to a layer to remove it from the view.

OR, Right-click the name of the layer and select ‘Remove’ in the drop-down menu.
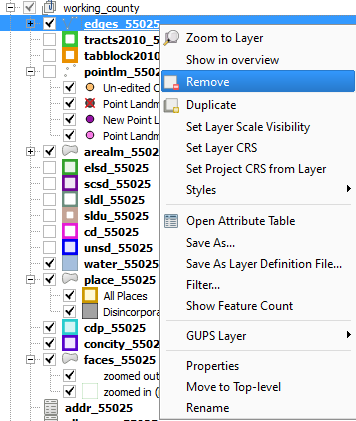
Figure 5. Managing Layer Visibility
Reorder Data Layers
In the Table of Contents, the order in which the layers are listed determines how the layers display on the map. The layers at the top display on top of those below them. To change the display order:
Left-click on the layer name.
Hold down the mouse button and drag the layer to the desired position in the list.
Release the mouse button to place the layer in its new position. The map display will then reflect the new layer order in the Table of Contents.
Expand/Contract Table of Contents Menus
To expand or contract the menu for a layer or layer group:
Click on the ‘+’ sign to expand the group. When you click the ‘+’ sign next to the layer name
 ,
the layer’s submenu opens:
![]()
When you click the ‘-’ sign next to the layer name, the submenu retracts:

The main Menu, the Standard toolbar, and the BAS toolbar are located at the top of the GUPS page. These toolbars offer general GIS and system tools and allow you to make your BAS updates.

The Manage Layer toolbar, the vertical toolbar located to the left of the Table of Contents (shown here in a horizontal position) allows you to import user-provided data.
![]()
Figure 7. Manage Layer Toolbar
Note: Although the Menu is always located at the top of the page and cannot be moved, you may move the toolbars to the location most convenient for you. For example, if you prefer that the Add Data toolbar appear at the top of the page, you can drag it there. This allows you to expand the area available for the Table of Contents and Map View.
As you work with the toolbars, hover your mouse over any toolbar button to see the name of the tool it represents. You can also resize and reposition the toolbars by dragging them.
The Menu, the Standard toolbar, and the BAS toolbar are described in the section below. The Add Data toolbar is discussed in Section 5.7, How to Import User-Provided Data into GUPS.
Menu Tabs
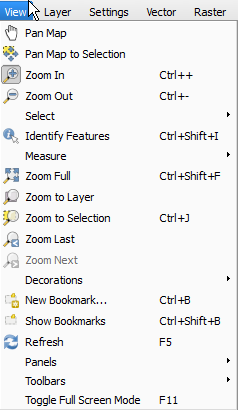
Table 10 below defines each of the tabs on the main Menu, provides an image of the drop‑down options for each, and describes each tab’s function.
Table 10: Menu Tabs and Their Functions
Tab |
Drop-down Menu |
Function / Description |
Project |
|
From the Project tab, you may save a project, click on ‘Save as Image’ to create an image file of the map in Map View, or exit the application. If you click ‘Save as Image’, GUPS allows you to select a file type for the image (.png, .jpg, .tif, etc.), name the file, and save it to any location on your computer. |
Edit |
|
From the Edit tab, you may ‘Undo’ your last action or ‘Redo’ the action (if you selected ‘Undo’ and then changed your mind). Note: For ‘Undo’ to work, the correct layer must be selected in the Table of Contents. For example, if you added a linear feature in the Edges layer, then closed the layer and opened the Area Landmarks layer, ‘Undo’ will not delete the linear feature. You must reselect the Edges layer to undo the linear feature’s addition. Note: You may undo multiple actions within a layer (e.g., the addition of several linear features) provided you have not yet saved. Once you save an action, ‘Undo’ is disabled. |
View |
|
The View tab allows you to complete several actions also available on the Standard toolbar. Included are options for navigating the map, identifying feature attributes, measuring distance, and creating spatial bookmarks to return to the same map view at a later time. From this location you can also:
|
Layer |
|
The Layer tab allows you to add and remove layers from the map, open the layer attribute table, set the map projection, or Coordinate Reference System (CRS), and display or hide layers. Note: Many of these same functions are more conveniently located on the Add Layers toolbar and the small toolbar that sits at the top of the Table of Contents. |
Settings |
|
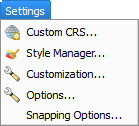
The Settings tab allows you to customize the CRS and map display options and set snapping tolerances (see instructions below this table).
|
Vector |
|
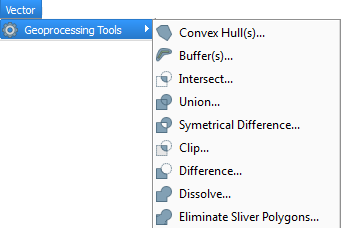
The Vector tab provides access to several Geoprocessing Tools, which allow you to create buffers around features, overlay areas so that you can create an intersection, union, or symmetrical difference, merge features, and perform other common geoprocessing actions. |
Raster |
|
The Raster tab provides access to a Calculator, which allows you to perform calculations on the basis of existing raster pixel values. |
Web |
|
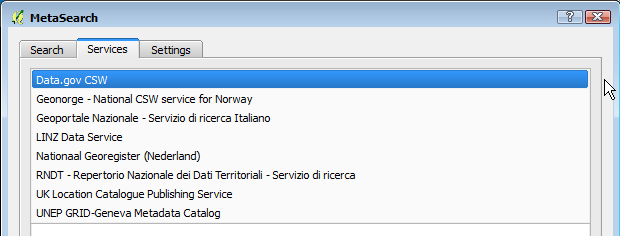
The MetaSearch option takes you to a search tool that uses another search engine’s data to produce results from the Internet. You can use the default services already loaded, or add your own sites. The Help option takes you to <https://issues.qgis.org/projects/MetaSerach> |
Processing |
|
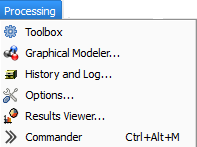
Although available to GUPS users, the options under the Processing tab are not needed for Census Bureau geographic program participation. The items under this tab pertain to algorithms, creating models, viewing the results of algorithms executed, and history. |
Help
|
|
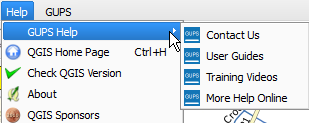
The Help tab provides tools for understanding QGIS (the open-source platform on which GUPS was developed) and the GUPS application itself. It also contains BAS contact information, access to the online version of this guide, training videos, and other information. Clicking the About option will bring up the latest version you have loaded on your pc. |
GUPS |
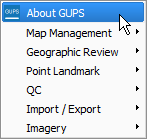
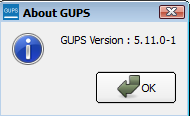
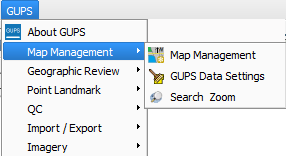
Click the ‘About GUPS’ option in the drop‑down menu to find the GUPS version number. If you call for technical support, you will need to supply this number Here the version number is 5.11.0‑1. The number you see will be more recent.
|
The
GUPS
tab provides quick access to the key tools also available on the
Standard
and BAS
toolbars, including those needed to manage maps;
make
linear changes;
area
feature changes; review and validate your work;
import county ZIP files from other users, and export maps;
add
imagery. |
Table 11: Adjust Snapping Tolerances
Step |
Action and Result |
Step 1 |
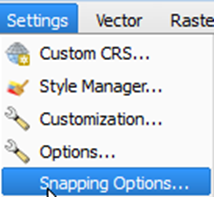
In the Settings tab drop-down menu, click on ‘Snapping Options’.
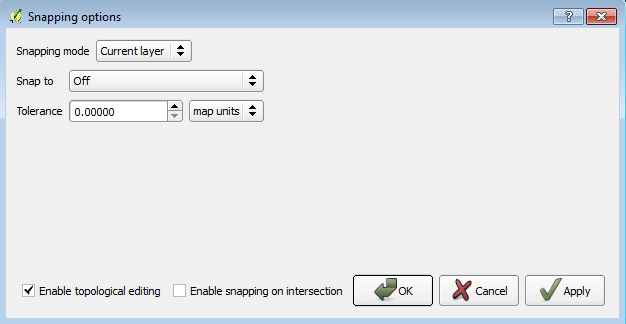
The Snapping options dialog box opens.
|
Step 2 |
From the Snapping mode drop-down menu, select whether you want the tolerance adjustment to apply only to the current layer or to all layers.
|
Step 3 |
From the Snap to drop-down menu, choose the snapping method.
|
Step 4 |
From the Tolerance drop-down menu, use the up and down arrows to select the value you want and then select your units (map units or pixels) in the drop-down to the right.
|
Step 5 |
If you want to enable topological editing and/or snapping on an intersection, use the checkboxes next to each.
|
Step 6 |
Click OK. The new snapping tolerances are set.
|
Standard Toolbar Buttons
The Standard toolbar provides the navigation tools to interact with the map and layers’ attribute tables.
![]()
The Standard toolbar actually includes several smaller toolbars. Each sub‑toolbar is identified by a series of small parallel lines that precede it.

The first sub-toolbar contains the Save button, Map Management button (opens the Map Management dialog box), and the Search button. The second sub-toolbar provides tools for viewing and navigating the map in Map View, and the third sub-toolbar allows you to identify, select, and deselect features on the map, make measurements, create spatial bookmarks, and work with the layers’ attribute tables.
You can move the location of the sub-toolbars. Simply left-click the parallel lines preceding the sub-toolbar and while holding down the mouse, drag the sub-toolbar to the location you want.
Each button on the Standard toolbar and its purpose is defined in the table below.
Table 12: Standard Toolbar Buttons
Button |
Name |
Function / Description |
|
Save |
Saves the current GUPS project, including any user changes to layer properties, projection, last viewed extent, and layers added. |
|
Map Management |
Choose your geographic participant program in GUPS and access the automatically loaded default map display layers based on the program chosen. |
|
GUPS Data Settings |
Warning! This tool deletes files and folders permanelty! Change GUPSGIS data working directory and clean GUPS project data. |
|
Search |
Search the map by place, landmark, or street name and zoom automatically to the feature. |
|
Touch Zoom and Pan |
Designed for touchscreen computers. Allows you to zoom and pan the map displayed in Map View using finger gestures to increase or decrease the map scale. |
|
Pan Map |
Shifts the map in Map View without changing the map scale. Click the button, then click a location on the map to re-center the map to the clicked location. |
|
Pan Map to Selection |
Shifts the map in Map View to the rows selected in the attribute table for a selected feature. After selecting a feature(s), click the button to re-center the map based on the selected feature(s). |
|
Zoom In |
Displays the map in Map View at a larger scale. Click the button, then click on the map at the location to which you want to zoom. |
|
Zoom Out |
Displays the map in Map View at a smaller scale. |
|
Zoom Full |
Displays the map in Map View at a smaller scale and zooms the map view to the full extent of the county. |
|
Zoom to Selection |
Zooms the Map View to the rows selected by query in the attribute table for a feature(s). After selecting a feature(s) on the map, click the button to view the feature(s) at a greater map scale. |
|
Zoom to Layer |
Zooms the Map View to the layer selected in the Table of Contents. After selecting the layer, click the button to zoom to the layer’s extent. |
|
Zoom Last |
Zooms the Map View to the previous map extent. |
|
Zoom Next |
Zooms the Map View forward to the next map extent (if you viewed the previous extent). |
|
Refresh |
Displays Map View to initial full display. |
|
Identify Features |
Identifies geographic features. Click the button, then click on a feature on the map to identify the feature at the location. |
|
Select Features by Area or Single Click |
Allows the user to select layer features in the map window with a single click, by dragging the cursor, or by drawing graphics on the screen.
|
|
Deselect Features from All Layers |
Deselects selected features from all layers. |
|
Select Features Using an Expression |
Initiates an attribute table record request by querying the table based on table fields and/or values in the fields. |
|
Measure |
Provides options to measure linear distance, area, and angles on the map. |
|
New Bookmark |
Creates and names a spatial bookmark of the current map view. |
|
Show Bookmarks |
Display all bookmarks created by the user. |
Most of the sub-toolbar buttons defined above are straight-forward. Those related to features, however, require further explanation. You will need these buttons to identify and select/deselect features on the map and to view feature attributes. You will also need them to make measurements and create spatial bookmarks.
Identify a Feature Using the Identify Features Button
To identify a feature on the map, follow the steps in Table 13 below.
Table 13: Identify a Feature on the Map
Step |
Action and Result |
Step 1 |
Click the Identify button on the Standard toolbar.
|
Step 2 |
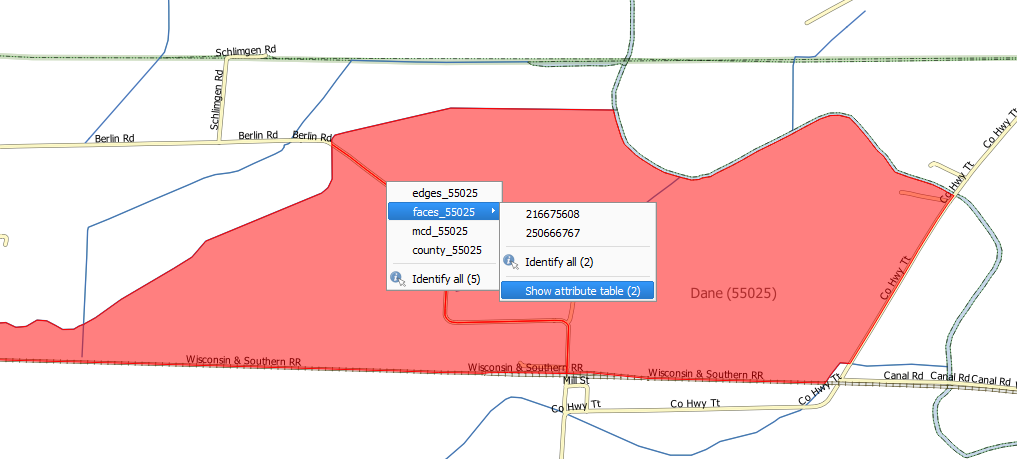
Then right-click on the feature. The results will display in drop-down menus on the map.
To see all attributes for the feature, select ‘Show attribute table’ in the faces drop‑down menu. |
Step 3 |
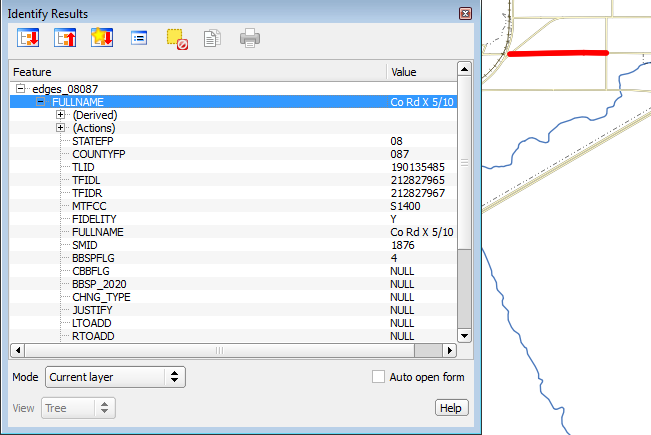
Alternately, click the Identify button, then left-click on the feature. The feature turns red (color may vary) and the Identify Results screen opens under the Table of Contents, showing the feature attributes. (Note that here we have dragged the screen from beneath the Table of Contents so that it sits over the map.)
|
Select/Deselect Features Using the Select Features and Deselect Features Buttons
The Select Features button gives you several ways to select features on the map. The Deselect Features from All Layers button allows you to deselect features you previously selected. Table 14 describes each of the feature selection methods, discusses when one might be preferable over another, and explains how to deselect features.
Table 14: Select/Deselect Features on the Map
Step |
Action and Result |
Step 1 |
To begin, click on the layer name in the Table of Contents for the layer in which you want to select a feature. For example, if you want to select linear features, click on the ‘edges’ layer; if you want to select faces, click on the ‘faces’ layer. |
Step 2 |
Click once on the Select Features button on the Standard Toolbar.
|
Step 3 |
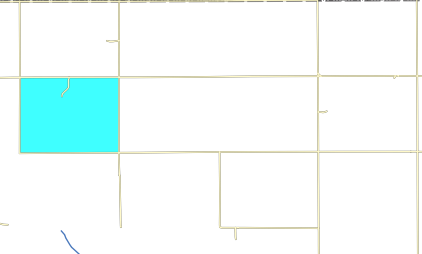
To select an edge or face on the map, click on it. In this example, we have selected ‘faces’ in the Table of Contents and clicked on a face. The face selected turns cyan blue (color may vary).
|
Step 4 |
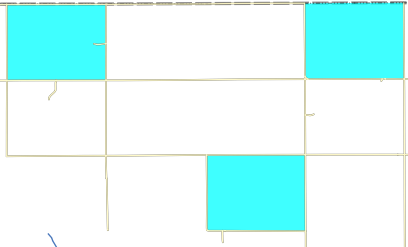
To select more than one face, hold down the CTRL key while clicking on the additional faces you wish to select. This method is suited to instances where you want to select faces that are not contiguous, as shown below.
|
|
You can also select multiple features by simply clicking the Select Feature button, then dragging your cursor over the features. This method is convenient when you want to select a large number of contiguous faces or a large number of nearby linear features without having to click each, one by one. |
|
A Note on GUPS Tools GUPS tools remain active until a different tool is selected. For example, if you use the Select Features tool to choose faces for a new area landmark, then decide you would rather add a new linear feature instead, you must click the Add Linear Feature tool before you click on the map again. If you do not, the Select Features tool, still active, selects a face. |
Step 5 |
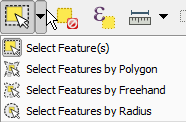
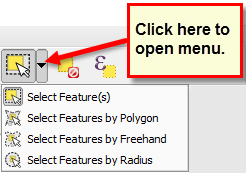
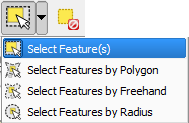
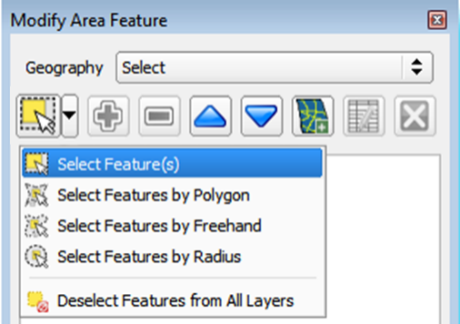
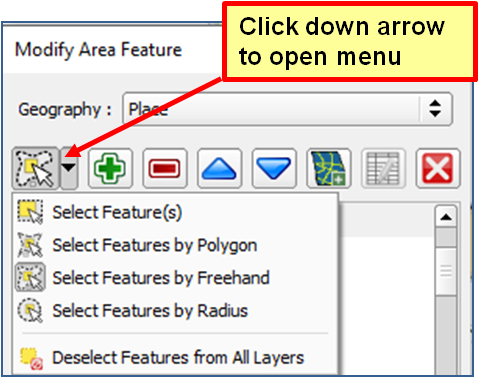
To open other Select Features options, click on the down arrow to the right of the Select Features button. The Select Features drop-down menu opens.
|
Step 6 |
The first option in the menu, ‘Select Feature(s)’, duplicates the functions available when you click on the main button on the toolbar.
|
Step 7 |
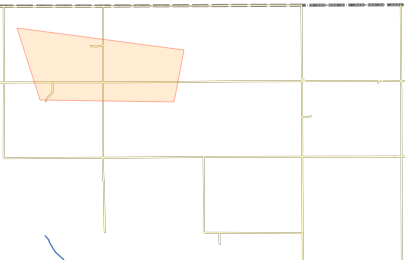
The second option, ‘Select Features by Polygon’, allows you to draw a polygon on the map to select features. To use this feature select it in the drop-down menu, then follow the steps below.
|
Step 8 |
Left-click on the map where you want to begin the polygon. Drag your cursor to extend the line to the point you want, left-click, then extend the line in a new direction. Continue until you have a closed polygon, as shown below.
|
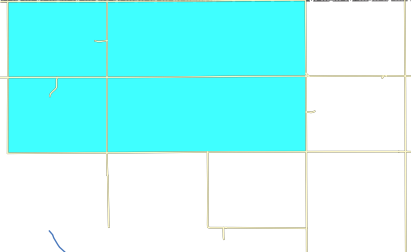
Step 9 |
When you are done, right-click. (This tells the system you have finished drawing). All faces with an edge appearing within the polygon are highlighted in cyan blue.
|
Step 10 |
The third option, ‘Select Features by Freehand’, allows you to use your cursor to draw a variety of shapes to select a face or faces.
To use this option, click on the map and use your cursor to draw any shape (polygon, triangle, circle, etc.). If the shape does not cross any edges, the single face in which the shape is drawn is selected and turns cyan blue. If the shape crosses several faces, all faces whose edges are crossed are selected and turn cyan blue. Note: This method is particularly useful when attempting to select a very small face. You may draw a tiny triangle, for example, within a face to select it. |
Step 11 |
The final option, ‘Select Features by Radius’, allows you to use your cursor to draw a circle to define the features you want to select.
To use this tool, left-click on the map where you want to begin, then hold down the mouse and drag the cursor outward to expand the circle. Release the mouse when you are done. The feature(s) selected is(are) highlighted in cyan blue. |
Step 12 |
You can either deselect polygons selected by holding and using the same selection option to deselect by holding CTRL and retracing over the polygons, or deselect a feature or features automatically by clicking the Deselect Features from All Layers button (next to the Select Features button) once.
The selected features in all layers are deselected. |
Select Features by Querying the Attribute Table
Another method to select features is by querying the attribute table. To do so, follow the steps in Table 15. In this example, we are querying the attribute table for the edges layer to locate and select all linear features flagged as edges for block boundaries.
Table 15: Select Features by Querying the Attribute Table
Step |
Action and Result |
Step 1 |
Click the Select Features Using an Expression button on the Standard toolbar.
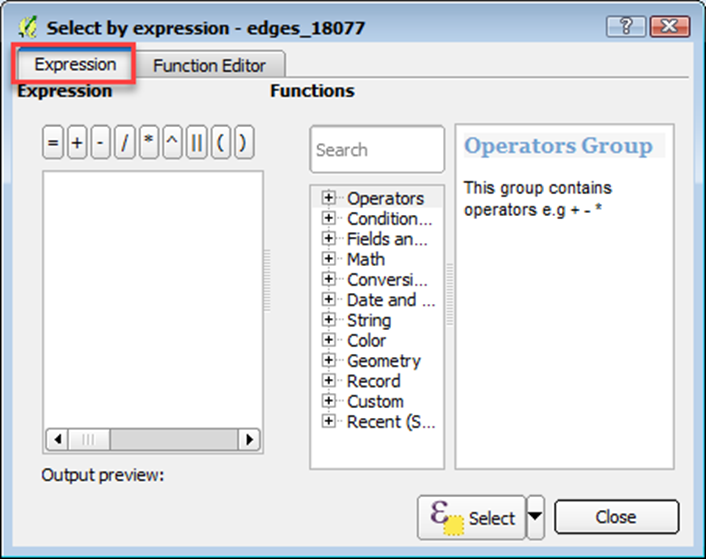
The Select by Expression window opens. The window has two tabs: Expression and Function Editor.
|
Step 2 |
Under the Expressions tab, click the plus (‘+’) signs next to the items in the Functions field to display their submenus.
|
Step 3 |
To build a query, click the ‘Fields and Values’ ‘+’ sign to open the list of choices. Then double-click on your choice. In this example, we will select ‘BBSP Flag’ to search for all features flagged as edges for block boundaries. Once selected, “BBSP Flag” appears in the expression pane, and a Load values field is added to the Fields pane at the bottom far-right corner.
|
Step 4 |
Select an operator from a full list by clicking the ‘+’ sign next to “Operators’ in the Functions pane. OR If you need a commonly used operator such as equals, plus, or minus, click its corresponding button in the row of buttons at the top of the Expression pane.
|
Step 5 |
In this example, we need the operator for equals. Double-click the ‘=‘ operator button. The expression in the Expression pane now reads “BBSP Flag” =. |
Step 6 |
To select a specific value for the field “BBSP Flag”, click either the all unique or 10 samples button in the Load values field. The Values field above the buttons populates with all allowed values.
|
Step 7 |
Select a value. We will select ‘4’ by double-clicking on it in the Values field list. The expression changes to “BBSP Flag” = ‘4’. |
Step 8 |
Double-click
the Select
by Expression
|
View an Attribute Table for a Layer on the Map
To view an attribute table for a map layer, follow the steps in the table below.
Table 16: View Layer Attributes Using the Attributes Table
Step |
Action and Result |
Step 1 |
Right-click the layer in the Table of Contents. The drop-down menu opens.
|
Step 2 |
Click the ‘Open Attribute Table’ option in the drop-down menu. The Attribute table opens showing all features in the layer and their attributes (e.g., name, MTFCCs, etc.). Each column represents a separate attribute and each row an individual feature.
|
Step 3 |
To select a feature to view, click on the number on the far left of the row. To select multiple features, click on the number of the row for the first feature you want to select, then press the CTRL key. While holding the CTRL key down, click on the numbers for the other individual rows you want to select. To select a range of features, click on the number for the row showing the first feature you want to select, then press the SHIFT key. While holding down the SHIFT key, click on the number for the last row you want to select. |
Determine Distance, Area, and Angles on the Map
To measure the distance between two or more points, area, or an angle on a map, follow the steps in Table 17.
Table 17: Measure Distances, Area, and Angles on a Map
Step |
Action and Result |
Step 1 |
Click the Measure button on the Standard toolbar.
The Measure button drop-down menu opens.
|
Step 2 |
To measure the distance between two points on the map, select ‘Measure Line’ in the drop-down menu. The Measure box opens.
|
Step 3 |
Zoom to the map location where you want to make the measurement. Then click on the beginning point on the map and continue clicking on points until you reach the final point. Right-click when you are done. The length of each segment of the line you drew, as well as the total length of the line between the beginning point and the ending point, appear in the Measure box.
|
Step 4 |
To measure area on the map, select ‘Measure Area’ in the drop-down menu. The Measure box opens. When the box opens, left-click on the map to begin drawing a polygon around the area you want to measure. Left-click when you reach each vertex of the polygon. When you are finished, right-click. The area polygon encompasses appears in the Total field. Use the drop-down to the right to see the area in other units of measure.
To begin a new measurement, click the New button. |
Step 5 |
To measure an angle on the map, first select the ‘Measure Angle’ option in the drop-down menu. Then left-click on the map to begin drawing the angle. Drag the mouse (but do not hold down the mouse button) to create the first side of the angle. Then left-click. Drag the mouse again (again without holding down the mouse button) to draw the second leg. The Angle box opens showing the angle measurement.
|
Save Locations on a Map Using the Bookmark Button
To save geographic locations on your map and view them later, follow the steps in Table 18 below.
Table 18: Bookmark Locations on a Map
Step |
Action and Result |
Step 1 |
Zoom to the location on the map in Map View that you wish to bookmark and click on the New Bookmark button on the Standard toolbar.
The Geospatial Bookmarks box opens.
|
Step 2 |
Click on the row named ‘New bookmark’. Then backspace over ‘New bookmark’ and type in a descriptive name for the bookmark (255-character limit). Click the Close button. The bookmark is added. |
Step 3 |
To view and manage spatial bookmarks, click on the Show Bookmarks button on the Standard toolbar. The Geospatial Bookmarks dialog box again opens. To zoom to a bookmark, click on a bookmark name in the dialog box and then click the Zoom to button. To delete a bookmark, click on the bookmark name, then press the Delete button. |
|
Bookmark names and coordinates cannot be edited from the Geospatial Bookmarks dialog box. |
BAS Toolbar Buttons
The BAS toolbar provides the BAS-specific functions needed to complete your review and update activities, as well as to import and export zipped shapefiles.
![]()
Each toolbar button is described in Table 19 below.
Button |
Name |
Function/Description |
|
Add Linear Feature |
Add a new linear feature. |
|
Delete Linear feature |
Delete an existing linear feature. |
|
Split Linear Feature |
Split a linear feature. You may need to split a linear feature to accurately reflect an entity’s location. This feature “splits” the original into two. |
|
Display All Names |
Displays all names for a street with multiple names assigned in the MAF/TIGER System. |
|
User Address List |
Import an address list (.csv, .txt, etc.) into GUPS. |
|
Modify Linear Feature Attributes |
Edit attributes of a selected linear feature. |
|
Modify Area Feature |
Make updates to legal area (annexations, deannexations, boundary corrections, etc.). |
|
Show/Hide Legend |
Shows or hides the layer. |
|
Geography Review Tool |
Review the attribute table for a layer. |
|
Review Change Polygons |
Review change polygons in a layer and make corrections (reviews change polygons for holes and minimum size). |
|
Import County ZIP |
Import zipped Census Bureau shapefiles shared by another GUPS user. |
|
Export to ZIP |
Create the ZIP file containing all required data and shapefiles to be submitted to the Census Bureau. |
|
Print Map to File |
Export a printable map in .pdf, .png, .tif, or jpeg format. |
|
Add Point Landmark |
Add a new point landmark. |
|
Edit Point Landmark |
Edit point landmark attributes. |
|
Delete Point Landmark |
Delete an existing point landmark. |
Status Bar
The Status bar at the bottom of the GUPS main page displays information about the map. It allows you to adjust the map scale and see the mouse cursor’s coordinates on the map.
![]()
Table 20 describes each element of the Status bar.
Item |
Description |
|
Allows you to toggle between the mouse’s coordinate position or the map view extents as you pan and zoom in and out on the map. |
Coordinate |
Shows your current position in map coordinates (default is decimal degrees for GUPS) as your map cursor is moved across the map. |
Scale |
Shows the current zoom level in the Map View. Can be changed by selecting one of the predefined levels from the drop down, by typing in a new ratio, or using the scroll wheel on your mouse. |
Rotation |
Shows the map rotation. |
Render |
Allows you to temporarily prevent layers from drawing by clicking the checkbox immediately to the left of “Render.” |
|
Clicking on the icon opens the projection properties for the current map. |
To import your own imagery, geodatabase, shapefiles, web mapping service, or other data layers into GUPS you will use the Add Data toolbar.
![]()
Although shown in a horizontal position here, the Add Data toolbar appears arranged vertically to the left of the Table of Contents in GUPS. Its buttons are described in Table 21.
Table 21: Add Data Toolbar Buttons
Button |
Name |
Function / Description |
|
Add Vector Layer |
Allows you to add shapefile and geodatabase files to your GUPS project. |
|
Add Raster Layer |
Allows you to add raster datasets such as imagery. |
|
Add PostGIS Layer |
Add PostGIS layer. |
|
Add SpatialLite Layer |
Add data from a SpatialLite database. |
|
Add MS SQL Layer |
Add MS SQL 2008 Spatial data. |
|
Add Oracle Spatial Layer |
Add a spatial layer from an Oracle database. |
|
Add WMS/WM(T)S Layer |
Add Web Mapping Services and Web Mapping Tile Services. Publicly accessible and secured WMS services are supported. |
|
Add WCS Layer |
Add Web Coverage Services, which provide access to raster data useful for client-side map rendering. |
|
Add WFS Layer |
Add Web Feature Services. |
|
New Shapefile Layer |
Add a new shapefile layer or new temporary scratch layer. |
GUPS supports vector data in a number of formats, including those supported by the OGR library data provider plugin, such as ESRI shapefiles, MapInfo MIF (interchange format), and MapInfo TAB (native format). It also supports PostGIS layers in a PostgreSQL database and SpatiaLite layers. Support for additional data types (e.g., delimited text) is provided by additional data provider plugins.
Below are the steps to import the most commonly used data formats. To upload shapefile or geodatabase data layers, follow the steps in the table below.
Note: You May Only Upload One User-Provided Data Layer at a Time. If you have multiple data layers that you wish to upload, note that GUPS will only allow you to upload one layer at a time.
Table 22: Load Shapefiles/Geodatabase Layers
Step |
Action and Result |
Step 1 |
Begin
the upload.
Click
the Add
Vector Layer
|
Step 2 |
In the Encoding drop-down menu, the default value is ‘System’. If you receive an error message when opening your file, use the drop-down to select UTF-8. UTF-8 populates the Encoding field. |
Step 3 |
Click the Browse button and navigate to the folder where the shapefile or geodatabase is saved on your computer. |
Step 4 |
Left-click the file you want to upload, then click the Open button. The shapefile / geodatabase is added to the Table of Contents and to the Map View window. |
To load data from a web mapping service, follow the steps in Table 23 below.
Table 23: Load Data from a Web Mapping Service
Step |
Action and Result |
Step 1 |
Begin
the upload. Click the Add
WMS/WM(T)S Layer
button
|
Step 2 |
Select the web mapping service. Click the Layers tab, then click the New button under the tab. The Create a new WMS Connection dialog box opens. |
Step 3 |
In the Name field, type a name for the web mapping imagery service. In the URL field, type the URL for the service. If the service requires a user name and password, type them in the fields provided. Click OK. The service will be added to the drop-down menu for web mapping services appearing just below the Labels tab. Note: If you are working inside a firewall, you may be prompted to enter a user name and password to obtain resources from outside the firewall. |
Step 4 |
Select the imagery service you added in the drop-down menu. The available layers appear in the ID/Name/Title/Abstract box. |
Step 5 |
Click on the layer you want to display, then click the Add button. The WMS is added to the map showing in Map View and to the Table of Contents. |
|
When the WMS is added, it displays over the top of other layers you have selected for Map View. To make it display below these layers, click on the WMS layer and, while holding down the mouse button, drag it to the bottom of the Table of Contents. |
If you do not have access to a web mapping service, have a poor Internet connection, or work under a restrictive firewall, you can still add other types of imagery files to GUPS (e.g., a county or state imagery dataset), one option for adding imagery may be the National Agricultural Imagery Service (NAIP), supplied in web mapping service format by the U.S. Geological Survey. To add imagery files, follow the steps in the Table 24 below.
Step |
Action and Result |
Step 1 |
Click
the Add
Raster Layer
|
Step 2 |
Navigate to the folder on your computer where the imagery file is stored. |
Step 3 |
Select the file, then click Open. The file loads into GUPS. |
If you want to import Census Bureau shapefiles already updated by another user, you may use the Import Project ZIP File button (available both on the BAS toolbar and in the Map Management dialog box), then follow the steps in Table 25 below.
Table 25: Import a ZIP File Shared by Another User
Step |
Action and Result |
Step 1 |
Click the Import Project ZIP File button in the upper left-hand corner of the Map Management dialog box:
OR on the BAS toolbar:
|
Step 2 |
The Open window opens.
|
Step 3 |
From
this window, click on the ‘Computer’ icon (called ‘My
Computer’ in some versions of Windows) located in the
far-left-hand pane.
When the list of directories opens, navigate to the location where the shared ZIP file is located. |
Step 4 |
Once you locate the file, click once on the file, then click the Open button.
The file loads into Map View. |
The tables in this section provide step-by-step instructions for making BAS updates. The examples assume you have read and understood the directions for opening GUPS and using Map Management. If you do not yet feel comfortable with Map Management, please review the contents of Section 5: Using GUPS (Basics and Map Management) before you begin making updates. It is highly recommended to use a souce of imagery data when making any BAS updates.
All examples shown here, although using real data, are purely fictitious. They are employed for purposes of illustration only and do not indicate any actual geographic changes.
Follow the steps in Table 26 to record an annexation. The fictitious example in this table looks at an incorporated place named Kissimmee, Florida. Kissimmee has annexed several parcels previously outside its city limits.
Table 26: Record an Annexation
Step |
Action and Result |
Step 1 |
Open in Map View the county that contains the place (or other legal entity) that is annexing area. Be sure that you have all layers you wish to see on the map checked in the Table of Contents. |
Step 2 |
Click the Modify Area Feature button on the BAS toolbar.
The Modify Area Feature dialog box opens.
|
Step 3 |
Click the drop-down area next to the Geography field, and select the entity type (here ‘Place’), from the drop-down menu. A list of all incorporated places in the county appears in the Info list in the bottom portion of the dialog box.
|
Step 4 |
Double-click on the row in the list for the place that is making the annexation (here ‘Kissimmee city’). (Note: The list of places is short, but in some cases it can be long. Use the scroll bar to the right of the list to move up and down the list, if needed.) Once you double-click on the row, the map zooms to the place selected.
|
Step 5 |
If the map does not zoom to a scale sufficient to make your changes, click on the Zoom in button on the Standard toolbar.
|
Step 6 |
To select the faces you want to add to the place, click on the small down arrow next to the Select Features button on the dialog box toolbar. The Select Features button drop‑down menu opens. In this example we will use the “radius” method to select the faces we want to add to Kissimmee. Click on ‘Select Features by Radius’ in the menu.
|
Step 7 |
Next, go to the map and place your cursor where you want to add the faces. To select a single face, simply drag the cursor outward in the center of the face. To select multiple faces, drag the cursor across the edges that separate the faces. In this example, we select seven faces. The faces selected turn cyan blue (color may vary).
|
|
Because all geographic areas consist of faces, you may need to “split” a face to accurately reflect an entity’s boundary. To split a face, digitize a new line that represents the boundary’s location (click on Table 33 for instructions to add a linear feature) and assign it the appropriate MTFCC. This splits the original face into two faces. You can now select the face you need to add to the new entity. |
|
If you accidentally select a face you do not wish to include, you can use the Deselect Features from All Layers option in the Select Feature(s) drop-down menu to clear the selected faces from your screen and start over.
|
Step 8 |
Click the Add Area button on the dialog box toolbar.
The Modify Area Feature Choose Change Type pop-up box appears, and asks you to choose your change type.
|
Step 9 |
Since this is an annexation, click the ‘Legal Change’ radio button, then click OK. The Create Change Polygons dialog box opens, with the state and county FIPS codes, the place name, and the Legal/Statistical Area Description (LSAD) already populated.
|
Step 10 |
Click the calendar icon next to the EFF_DATE field to open the calendar, then click on the effective date for the annexation.
The selected date will populate the EFF_DATE field. |
Step 11 |
Select an authority type for the annexation in the AUTHTYPE field drop-down menu.
|
Step 12 |
In the DOCU field, type in the ordinance or other legal documentation number authorizing the annexation or upload documentation for the change. To upload documentation, click the folder icon next to the DOCU field.
The DOCU window opens.
|
Step 13 |
Click on the icon for ‘My Computer’ (or simply ‘Computer’ in some Windows versions) to open the directory where you have saved your documentation.
Your directories display, as shown below.
|
Step 14 |
Select the appropriate directory in the list and navigate to the file you want to upload. Click the file, then to upload it, click the Open button at the bottom of the DOCU window.
The name of the document populates the DOCU field on the dialog box.
|
Step 15 |
Finally, select ‘Annexation’ in the drop-down menu for the CHNG_TYPE field.
|
Step 16 |
When you are finished, click OK. The added faces (once you save) turn tan in color on the map (color may vary).
|
Follow the steps in Table 27 to record a deannexation. The fictitious example in this table uses Sayre City, an incorporated place in Oklahoma.
Table 27: Recording a Deannexation
Step |
Action and Result |
Step 1 |
Open in Map View the county that contains the place (or other legal entity) that is deannexing area. Be sure that you have all layers you wish to see on the map checked in the Table of Contents. |
Step 2 |
Click the Modify Area Feature button on the BAS toolbar.
The Modify Area Feature dialog box opens.
|
Step 3 |
Click the arrow next to the Geography field, and select in the drop-down menu the entity type from which you want to deannex area. In this example we are deannexing land from an incorporated place, so we select ‘Place’.
Place appears in the Geography field and a list of all incorporated places in the county appears in the Info list in the bottom portion of the dialog box.
|
Step 4 |
Click on the place name (Sayre city) in the list. The map zooms to Sayre.
|
Step 5 |
Zoom on the map to the location where the deannexation occurred. Then choose a method for selecting the faces to be deannexed. In this example, in the drop‑down menu for the Select Features tool, click on the ‘Select Feature(s)’ option.
|
Step 6 |
Click on the face you want to select. If you want to select more than one face, depress the CTRL key, and while holding the CTRL key down, click each face to be deannexed. The selected face(s) turn cyan blue (colors may vary).
|
|
Because all geographic areas consist of faces, you may need to “split” a face to accurately reflect an entity’s boundary. To split a face, digitize a new line that represents the boundary’s location (click on Table 33 for instructions to add a linear feature) and assign it the appropriate MTFCC. This splits the original face into two faces. You can now select the face you need to add to the new entity. |
Step 7 |
Click the Remove Area button on the dialog box toolbar.
The Modify Area Feature Choose change type pop-up box appears, and asks you to choose your change type.
|
Step 8 |
Since this is a legal deannexation, click the ‘Legal Change’ radio button, then click OK. The Create Change Polygons dialog box opens.
|
Step 9 |
In the Create Change Polygons dialog box, click the calendar icon next to the EFF_DATE field and, when the calendar opens, click on the date which the deannexation became effective.
The date selected populates the EFF_DATE field. |
Step 10 |
Select an authority type for the deannexation in the AUTHTYPE field drop-down menu.
|
Step 11 |
In the DOCU field, type in the ordinance or other legal documentation number authorizing the deannexation, or upload legal documentation for the change. To upload documentation, click the folder icon next to the DOCU field.
When the DOCU window opens, click on the icon for ‘My Computer’ (or simply ‘Computer’ in some Windows versions) to open the directory where you have saved your documentation.
Your directories display, as shown below.
|
Step 12 |
Select the appropriate directory and navigate to the file you want to upload. Click the file. Then, to upload it, click the Open button at the bottom of the DOCU window.
GUPS uploads the file and the file name appears in the DOCU field on the Create Change Polygons dialog box.
|
Step 13 |
In the CHNG_TYPE field drop-down menu, select ‘De-annexation’.
|
Step 14 |
When finished, click OK. The selected faces turn green on the map (color may vary).
|
Follow the steps Table 28 to add a new legal entity. In this example, we will add a fictitious newly incorporated place in Michigan.
Table 28: Adding a New Legal Entity
Step |
Action and Result |
Step 1 |
Open in Map View the county where you want to add a new entity. Be sure that you have all layers you wish to see checked in the Table of Contents. |
Step 2 |
Click the Modify Area Feature button on the BAS toolbar.
The Modify Area Feature dialog box opens.
|
Step 3 |
Click the drop-down arrow next to the Geography field, and select the entity type you want to add from the drop-down menu. In this example we are adding a newly incorporated city, so we select ‘Place’.
Place appears in the Geography field and a list of all incorporated places in the county appears in the Info list.
|
Step 4 |
Zoom to the location where the new entity is located. To select the faces for the entity, left-click once on the Select Features button on the dialog box toolbar.
|
Step 5 |
Then click on the map to select the face or faces. If the entity includes only a single face, you may simply click once on the face to select it. If the entity includes several contiguous faces, after clicking on the first face, depress the CTRL key and while holding it down, left-click on each additional face to be added. The selected faces turn cyan blue (colors may vary).
Note: You may also select faces (after clicking the Select Features button) by simply dragging your cursor over the edges that mark their boundaries. Additional means of selecting faces (by polygon, by freehand, and by radius) are discussed Table 14: Select/Deselect Features on the Map. |
|
Because all geographic areas consist of faces, you may need to “split” a face to accurately reflect an entity’s boundary. To split a face, digitize a new line that represents the boundary’s location (click on Table 33 for instructions to add a linear feature) and assign it the appropriate MTFCC. This splits the original face into two faces. You can now select the face you need to add to the new entity. |
Step 6 |
To record the new entity, click the Add Entity button on the dialog box toolbar.
The Modify Area Feature new entity dialog box opens.
|
|
Note: If you click the Add Entity button before selecting the faces, you will see a pop-up box warning. Simply click OK and add the faces.
Since we have already selected faces, we do not see the pop-up warning. |
Step 7 |
In the new entity dialog box, type the new legal entity name in the Name field. |
Step 8 |
Next add the effective date for the legal change. Click on the calendar icon next to the EFF_DATE field and, when the calendar opens, click on the effective date.
The date selected populates the EFF_DATE field.
|
Step 9 |
Next, add the authority type using the AUTHTYPE drop-down menu.
|
Step 10 |
Finally, either type in the ordinance or other legal documentation number authorizing the new entity in the DOCU field, or upload documentation for the change. To upload documentation, click the folder icon next to the DOCU field.
The DOCU window opens.
|
Step 11 |
Click on the icon for ‘My Computer’ (or simply ‘Computer’ in some Windows versions) to open the directory where you have saved your documentation.
Your directories display, as shown below.
|
Step 12 |
Select the appropriate directory in the list and navigate to the file you want to upload as documentation, then click the file. The file name appears in the File name: field. To upload the file, click the Open button.
|
Step 13 |
Once you have clicked the Open button, the name of the document appears in the DOCU field.
|
Step 14 |
Click the OK button. Note: Red asterisks indicate required fields. You must complete required fields to move forward. If you click OK and have not completed one or more required fields, GUPS will prompt you to do so. Any required field not completed will highlight in red, as shown below.
If you have completed all required fields, when you click OK, the faces for the new entity turn purple on the map (colors may vary) and the name of the new entity appears in the list of incorporated places in the Modify Area Feature dialog box.
|
|
Once the Census Bureau verifies the new entity, it will assign it a FIPS code. The code preceding the new entity name in the list is not a FIPS code, and should not be used for any official purpose. It is only a placeholder until the official FIPS code can be assigned. |
Step 15 |
To make additional changes to the map, simply make a new selection in the Modify Area Feature dialog box Geography field and continue work. You may save your changes as you go or wait until you have finished all work on the map. Saving as changes are completed, however, is recommended to avoid losing work in the event of a power outage or system interruption. |
|
New Entity that Crosses a County Boundary If the new entity crosses a county boundary, you must add the new entity in both counties separately. After making the change in your working county, return to Map Management, select the other county as the working county, and proceed to add the new entity in this county as well. If the added entity crosses more than one county boundary, complete the addition in each county affected. |
Follow the steps in Table 29 to record a disincorporation. In this example, we will show a fictitious disincorporation for Minersville, Utah.
Table 29: Record a Disincorporation
Step |
Action and Result |
Step 1 |
Open in Map View the county that contains the entity you wish to delete. Be sure that you have all layers you wish to see checked in the Table of Contents. |
Step 2 |
Click the Modify Area Feature button on the BAS toolbar.
The Modify Area Feature dialog box opens.
|
Step 3 |
Click the drop-down arrow next to the Geography field, and select ‘Place’ in the drop‑down menu.
Place appears in the Geography field and a list of all incorporated places in the county appears in the Info list.
|
Step 4 |
Click the entity in the list for which you want to show the disincorporation (here Minersville). The map zooms to Minersville.
|
Step 5 |
Click the Delete button on the toolbar inside the Modify Area Feature dialog box.
A pop-up asks you ‘Are you sure you want to permanently delete this Area feature?’
|
Step 6 |
Click OK. The disincorporated entity turns green on the map (color may vary), and it is removed from the list of incorporated places in the county.
|
Step 7 |
To make additional changes to the map, simply make a new selection in the Modify Area Feature dialog box Geography field and continue work. |
|
Deleted Entity that Crosses a County Boundary If the deleted entity crosses a county boundary, you must delete the entity in both counties separately. After making the change in your working county, return to Map Management, select the other county as the working county, and proceed to delete the entity in this county as well. If the deleted entity crosses more than one county boundary, complete the deletion in each county affected. |
Users reporting on behalf of an incorporated place may make changes across county boundaries for their place. The steps in Table 30 below provide an example for an annexation by a place across a county boundary. The fictitious example uses Brooklyn Village, in Dane County, Wisconsin. It has annexed land in adjacent Rock County.
Table 30: Record an Annexation in an Adjacent County
Step |
Action and Result |
|
Independent City Users: Users reporting for independent cities (cities independent of any county and treated by the Census Bureau as county equivalents) should follow the steps described below to show annexations/deannexations between the city and surrounding counties. County Users: When updating a county boundary, you must switch the working county to add/remove area located in the other county. To update a boundary, use the instructions below, but in Step 6, select County instead of Place in the Geography drop-down menu, and in Step 7, click in the Info list on the name of the county to which you want add or remove the area. |
Step 1 |
To show a boundary change that crosses a county boundary, you must change your working county to the county in which the added faces are located. This example assumes that Dane County is your working county and is already displayed in Map View. To switch the working county: Click the Map Management button on the Standard toolbar.
The Map Management dialog box opens showing the program, state, working county, entity type, and entity name you earlier selected. A list of adjacent counties, highlighted in yellow, displays near the bottom of the dialog box.
|
Step 2 |
To change the working county, click the down arrow for the Working County field to open the drop-down menu and select Rock County from the list. Select County from the Entity Type field.
The list of adjacent counties repopulates to show the counties adjacent to Rock County.
|
Step 3 |
Unclick
the checkbox for all counties except Dane. Then click the Open
|
Step 4 |
Click the Save button in order not to lose any changes you previously made to the Dane County shapefile. The Map View displays both Dane and Rock Counties and the Table of Contents displays the layers for the new working county (Rock County).
|
Step 5 |
To select the entity within Dane County to which you want to add the area that is within Rock County, click the Modify Area Feature button on the BAS toolbar.
The Modify Area Feature dialog box opens.
|
Step 6 |
In the Geography field drop-down menu, select the entity type to which the annexed land should be assigned. Because Brooklyn Village is an incorporated place, select ‘Place’.
A list of all incorporated places in both Rock and Dane Counties appears in the Info list at the bottom of the dialog box. The list includes Brooklyn Village.
|
Step 7 |
Scroll down the list and click the row for ‘Brooklyn village’. The map zooms to the portion of the county boundary where Brooklyn Village is located.
|
Step 8 |
Zoom in to the faces to be annexed, then click the Select Features button on the dialog box toolbar once.
|
Step 9 |
Click the face on the map to be added, if there is only one. If you want to add additional faces, hold down the CRTL key and continue to click on faces until you are done. The selected faces turn a more vibrant yellow (color may vary).
|
|
Because all geographic areas consist of faces, you may need to “split” a face to accurately reflect an entity’s boundary. To split a face, digitize a new line that represents the boundary’s location (click on Table 33 for instructions to add a linear feature) and assign it the appropriate MTFCC. This splits the original face into two faces. You can now select the face you need to add to the new entity. |
Step 10 |
To add the faces selected within Rock County to the incorporated place Brooklyn Village, click the Add Area button on the dialog box toolbar.
The Modify Area Feature Choose change type dialog box opens.
Click the radio button next to ‘Legal Change’ to indicate that this is a legal boundary change. Then click OK. |
Step 11 |
The selected faces turn green (colors may vary) and the Create Change Polygons dialog box opens. GUPS automatically fills the FIPS codes, name, and LSAD fields for Brooklyn Village.
|
Step 12 |
Click the calendar icon next to the EFF_DATE field to select an effective date for the annexation.
|
Step 13 |
Select an authority type for the annexation in the AUTHTYPE field drop-down menu.
|
Step 14 |
Type in the ordinance or other legal documentation number authorizing the change, or upload legal documentation. To upload a document, click on the folder icon to the right of the DOCU field.
When the DOCU window opens, click on the icon for ‘My Computer’ (or simply ‘Computer’ in some Windows versions) to open the directory where you have saved your documentation.
Your directories display, as shown below.
|
Step 15 |
Select the appropriate directory and navigate to the file you want to upload. Click the file. Then, to upload it, click the Open button at the bottom of the DOCU window.
The file name appears in the DOCU field in the Create Change Polygons box.
|
Step 16 |
Finally, use the CHNG_TYPE drop-down menu to select the type of legal change being made, here an annexation.
Then click OK. |
Step 17 |
Click the Save button on the Standard toolbar. The Current edits pop-up box asks if you would like to save the changes to all layers.
Click OK. The changes are saved and the selected faces turn brown, as shown below. (Note: If you now reopen the Dane County map, the faces will appear as part of Brooklyn Village.)
|
Users who represent consolidated cities (i.e., cities that share a consolidated government with a county or minor civil division) should follow the steps described in Table 30 in Section 6.1.5: Making a Boundary Update on a County Line to show boundary changes between the city and any county adjacent to it. To show boundary changes between the consolidated city itself and the entity or entities with which it shares a government, proceed as any incorporated place user would. That is, if you wish to annex land from another entity within the consolidated government area, treat it as you would any annexation within a county.
To make a boundary correction that adds or removes area from an entity, follow the steps in the table below. In this fictitious example, a boundary correction is made to the city limits of Linwood, Kansas.
Table 31: Making a Boundary Correction
Step |
Action and Result |
Step 1 |
Open in Map View the county that contains the legal entity for which you want to add or remove area. Be sure you have all layers you wish to see on the map checked in the Table of Contents. |
Step 2 |
Click the Modify Area Feature button on the BAS toolbar.
The Modify Area Feature dialog box opens.
|
Step 3 |
Click the arrow next to the Geography field, and select in the drop-down menu the entity type for which you want to add or remove area. In this example, we select ‘Place’. The Info list populates with all incorporated places in the county for the geography chosen.
|
Step 4 |
Click on the row in the list for the place that is adding/removing area (here Linwood). The map zooms to the place selected.
|
Step 5 |
Click the down arrow next to the Select Features button to select the face(s) to add or remove for the boundary correction. The Select Features drop-down menu opens.
In this example, we are adding three small faces that are difficult to select, so we opt for ‘Select Features by Freehand’. This method allows us to place our cursor inside the first face and draw a tiny line. The selected face turns cyan blue (colors may vary).
To select the other faces, press the CTRL key, and while holding it down, repeat the action for the two remaining faces. All three faces turn color.
|
|
Note: To add area, the area must be outside the selected place. To remove area, the area must be within the selected place. |
Step 6 |
On the Modify Area Feature toolbar, click on the Add button (to add area to the entity) or on the Remove button (to remove area from the entity).
The Modify Area Feature Choose change type pop-up box opens, and asks you to choose your change type.
|
Step 7 |
Since we are not making a legal boundary change, but rather a boundary correction, click the radio button next to ‘Boundary Correction’. Then click OK. The added faces turn green on the map (color may vary) and are added to the legal entity boundary.
|
|
Removing area from a boundary is conducted following the same steps, the only difference being that you click the Remove button on the Modify Area Feature toolbar. Once you select the faces and click the Remove button, you see the same Modify Area Feature Choose change type pop-up box, select ‘Boundary Correction’, and see the faces turn green. |
The steps to add a geographic corridor are shown in the table below. The fictitious example provided uses Dupont, Indiana. The steps in this table show how the city would mark the annexation of a geographic corridor along State Road 7, which in the example leads to a newly built golf course that is part of the town.
Table 32: Adding a Geographic Corridor
Step |
Action and Result |
|
Creating a geographic corridor requires two actions: first you must split the faces on either side of the road (if edges do not already exist), then you must add the area. |
Step 1 |
Load the data for the county (in this example, Jefferson County, Indiana).
|
Step 2 |
Pan to the location of the geographic corridor (here State Road 7).
|
Step 3 |
Click the Add Linear Feature button on the BAS toolbar.
|
Step 4 |
Left-click on the map at the beginning point of the first line and drag the cursor to create the line marking the first half of the corridor. Left-click at the end of the line, then right-click to tell GUPS you have finished drawing. The line appears on the map, and the Add Linear Feature dialog box opens.
|
Step 5 |
A name is not required, but if you wish, type a name in the Name field, then select the appropriate MTFCC code in the MTFCC drop-down list. In this example, we select ‘P0001 – Nonvisible Legal/Statistical Boundary’.
The MTFCC field populates with your selection. |
Step 6 |
Click the OK button.
The line turns from purple to dark green (colors may vary) and the name, if you provided one, is added to the map.
|
Step 7 |
Add a line on the opposite side of the road using the same instructions provided in Steps 4 through 6. (Note: You do not need to click the Add Linear Feature button again; it is still active.) When you are finished, the map should display the two corridor faces you created, as shown below.
|
Step 8 |
To add the area: click the Modify Area Feature button on the BAS toolbar.
The Modify Area Feature dialog box opens.
|
Step 9 |
In the Geography field drop-down menu, select the entity type (in this case, ‘Place’). A list of all incorporated places in Jefferson County (including Dupont) populates the Info list at the bottom of the dialog box.
|
Step 10 |
Click on the row for Dupont in the list. The map zooms to the Town of Dupont.
|
Step 11 |
Pan to the location of the new corridor you drew on the map. Then click the Select Feature(s) button on the small toolbar near the top of the Modify Area Feature dialog box.
|
Step 12 |
Left-click inside one of the corridor faces, then drag your cursor across the road. When you release the cursor the faces on either side of the road have been selected and turn cyan blue.
|
Step 13 |
To record the corridor, click the Add button on the Modify Area Feature dialog box toolbar.
The Modify Area Feature Choose change type dialog box opens.
|
Step 14 |
Click the radio button next to Corridor. A box opens giving an explanation of what a geographic corridor is and asking if you want to proceed. Click Yes. You are returned to the Modify Area Feature Choose change type box.
|
Step 15 |
Click the OK button at the bottom of the box.
|
Step 16 |
The Review Change Polygons pop-up box opens and asks whether this is a legal change.
|
Step 17 |
If the geographic corridor is not part of a legal change, click No. The change is automatically added as a boundary correction. If the geographic corridor is a legal change, click Yes. The Create Change Polygons dialog box opens.
|
Step 18 |
Click on the calendar icon next to the EFF_DATE field to select an effective date for the change.
|
Step 19 |
Use the AUTHTYPE drop-down menu to select an authority type.
|
Step 20 |
In the DOCU field, either type in the documentation number, or upload legal documentation of the change. To upload a document, click on the folder icon, navigate to the directory where the document is stored, and double-click the file. The file uploads to GUPS and the name of the file appears in the DOCU field.
|
Step 21 |
In the CHNG_TYPE field, select ‘Corridor’ in the drop-down list. Corridor fills the CHNG_TYPE field as shown in the screenshot above. |
Step 22 |
Click OK. The faces marking the corridor turn green on the map (color may vary). The corridor has been added.
|
To create a geographic offset, follow the same steps as for a corridor (Table 32). The only difference is that geographic offsets are only on one side of the road.
Adding a Linear Feature
Follow the steps in below to add a linear feature.
Table 33: Adding a Linear Feature
Step |
Action and Result |
Step 1 |
Open in Map View the county that contains the entity where you want to add a linear feature. Be sure the edges layer is checked in the Table of Contents. Then zoom to the location on the map where you want to add the feature. |
Step 2 |
Click on the Add Linear Feature button on the BAS toolbar.
|
Step 3 |
Left-click the mouse at the starting point of the line (A) and continue to left-click the mouse at each vertex (shape) point of the line. When you have completed the new line, right-click the mouse (B). The right-click tells GUPS you are finished drawing.
The Add Linear Feature dialog box opens.
|
Step 4 |
Type the name of the new linear feature in the Name field if the feature is named; otherwise, leave blank. Be sure when entering the feature name either to spell out the feature type (e.g., street, road, avenue), or to select an approved abbreviation from the list provided in Appendix D.
|
Step 5 |
In the MTFCC field drop-down menu, choose the appropriate code for the feature.
|
Step 6 |
Click
the OK
button
|
|
Adding a linear feature coincident with a boundary – The GUPS will not allow one linear feature to be placed over another. For example, if you attempt to add a road overlaying a legal boundary line, a pop-up box will warn you ‘Added Line Overlays an Existing line’. If you are adding a linear feature coincident with a boundary, follow the instructions for updating linear feature attributes instead (for instructions click on Table 36). Once you select the boundary edge that you want to add a street on top of, update the MTFCC in the Update Attributes pop-up to one of the "S" class feature codes (e.g., S1400) and add a name in the FULLNAME field. |
Deleting a Linear Feature
To delete a linear feature, follow the steps below.
Table 34: Deleting a Linear Feature
Step |
Action and Result |
Step 1 |
Open in Map View the county that contains the entity where you want to delete a linear feature. Be sure the edges layer is checked in the Table of Contents. Then zoom to the location on the map where you want to delete the feature. |
Step 2 |
Click on the Delete Linear Feature button on the BAS toolbar.
|
Step 3 |
Left-click the linear feature that you want to delete. In the example below, we clicked on an unnamed road. The clicked linear feature turns cyan blue (color may vary) and the Delete Linear Feature pop-up box appears, asking if you are sure you want to delete the feature.
|
Step 4 |
Click OK. The line is deleted in the attribute table. The cyan blue color is removed from the line and the line now looks as it did originally. |
|
When you delete a linear feature, it is not actually removed from the Census shapefile. GUPS assigns a Delete Line flag to the feature in the attribute table, and the feature is later processed for deletion when the Census Bureau receives the BAS file. Note: If you have multiple linear features to delete, you may click the Delete Linear Feature button on the toolbar once, then press CTRL and click each of the features you want to delete. GUPS will delete all of the linear features selected. You may also drag your cursor over multiple linear features to select them. |
Restoring a Deleted Linear Feature
To restore a deleted linear feature, follow the steps below.
Table 35: Restoring a Deleted Linear Feature
Step |
Action and Result |
Step 1 |
Open in Map View the county that contains the deleted linear feature. Be sure the edges layer is checked in the Table of Contents. Then zoom to the location on the map where the deleted feature is located. |
Step 2 |
Left-click on the deleted feature. The deleted feature turns cyan blue (color may vary) and the Delete Linear Feature dialog box opens. The box asks you to confirm that you want to restore the line.
|
Step 3 |
To restore the linear feature, click the OK button.
The Delete Line flag is removed from the attribute table and the line is restored. |
Changing the Attributes of a Linear Feature
Follow the steps below to change the attributes (e.g., the name, MTFCC, or address range) of a linear feature.
Table 36: Changing the Attributes of a Linear Feature
Step |
Action and Result |
Step 1 |
If you plan to change the name of a linear feature, check first to see if it has an alternate name. To do this, click the Display All Names button on the BAS toolbar.
Then click on the linear feature on the map. The selected feature turns cyan blue (color may vary) and the Display All Names dialog box opens, showing the primary name in the Prim. Name field and the alternate name, if one is present, in the Alt. Name field.
To see any additional alternate names, click the drop-down arrow to the right of the Alt. Name field. If no alternate name exists, ‘NULL’ appears in the Alt. name field. |
Step 2 |
If you plan to provide an address range for a linear feature, check the checkbox next to > direction in the Edges field in the Table of Contents. This activates the arrows that indicate the FROM and TO nodes for line segments.
|
Step 3 |
Click on the Modify Linear Feature Attributes button on the BAS toolbar.
|
Step 4 |
Click the linear feature on the map with attributes you want to edit. The Modify Linear Feature Attributes dialog box opens with the TIGER Line Feature ID (TLID) of the feature selected. The FULLNAME field populates if the feature is named. If the feature is not named, the field is blank. The MTFCC, LTOADD, RTOADD, LFROMADD, and RFROMADD fields show the assigned values for each.
|
Step 5 |
Update the FULLNAME field. If the field is blank, type in the new name. If the field is already populated, highlight the existing name and hit the Delete key on your keyboard. You may also backspace over the name to clear the field. Then type in the new name. |
Step 6 |
If you need to correct the MTFCC code, click on the down arrow to the right of the field to open the drop-down menu and select the correct MTFCC from the menu. |
Step 7 |
Change the address range for the linear feature, if necessary. Type in potential address ranges in the LTOADD (left to address); RTOADD (right to address); LFROMADD (left from address); RFROMADD (right from address) fields based on the directional arrows. The directional arrows show the origin node (FROM) and the end node (TO). |
Step 8 |
Click Save button at the bottom of the Modify Linear Feature Attributes dialog box. |
|
The address ranges for all features are blank in the geographic partnership shapefiles because the ranges are stored in tables separate from the shapefiles. You can provide address ranges in these fields, but be aware that we may already have address ranges. It is important to note which node is the FROM node and which is the TO node (based on the red directional arrows) so that the address ranges are associated with the correct side of the street and the correct census block. Note: Provide potential address ranges for blocksides, such as 0-98, 100-198, etc., for even parity and 1-99, 101-199, etc., for odd parity address ranges. Do not provide actual address ranges. |
To create a new landmark or hydrographic area, follow the steps below. In this fictitious example, we will add a golf course in Jefferson County, Indiana, located northwest of Dupont Town.
Table 37: Creating a New Area Landmark/Hydrographic Area
Step |
Action and Result |
Step 1 |
Open in Map View the county in which you want to add the new area landmark or hydrographic area. Be sure the ‘Area_Landmarks’ layer is checked in the Table of Contents. Then zoom to the location on the map where you want to add the landmark or hydrographic area. |
Step 2 |
Click the Modify Area Feature button on the BAS toolbar.
The Modify Area Feature dialog box opens.
|
Step 3 |
In the Geography field drop-down menu, select ‘Area Landmark/Area Hydrology’. ‘Area Landmark/Area Hydrology’ populates the Geography field and a list of area landmarks and hydrological features in the county appears in the Info list.
|
Step 4 |
Click on the yellow Select Feature(s) button on the Modify Area Feature toolbar.
|
Step 5 |
Then click on the first face on the map you wish to select. To select more than one face, depress the CTRL key, and while holding it down, click on the additional faces. In this example, we are selecting two faces, one on either side of Bear Creek. The selected faces turn cyan blue (color may vary).
|
Step 6 |
Click on the Add Entity button on the Modify Area Feature toolbar.
The Modify Area Feature box opens.
|
Step 7 |
In the Modify Area Feature box, type in the name of the new area landmark in the Full name field.
Then select the appropriate code in the MTFCC field drop-down list, as shown below.
|
Step 8 |
Click OK. The faces selected for the new entity now display in purple (color may vary). The name of the added landmark also appears within the change polygon on the map (see green circle), and the name of the new entity appears in the Info list.
|
|
Because all geographic areas consist of faces, you may need to “split” a face to accurately reflect an entity’s boundary. To split a face, digitize a new line that represents the boundary’s location (click on Table 33 for instructions to add a linear feature) and assign it the appropriate MTFCC. This splits the original face into two faces. You can now select the face you need to add to the new entity. |
To delete an area landmark or hydrographic area, follow the steps below.
Table 38: Deleting an Area Landmark/Hydrographic Area
Step |
Action and Result |
Step 1 |
Open in Map View the county in which you want to delete an area landmark or hydrographic area. Be sure the ‘Area_Landmarks’ layer is checked in the Table of Contents. |
Step 2 |
Click the Modify Area Feature button on the BAS toolbar.
The Modify Area Feature dialog box opens.
|
Step 3 |
In the Geography field drop-down menu, select ‘Area Landmark/Area Hydrography’. ‘Area Landmark/Area Hydrography’ populates the Geography field and a list of area landmarks and hydrological features in the county appears in the Info list.
|
Hint |
To view all the area landmarks and hydrographic areas in the Info list, you may use the scroll bar located to the far right-hand side of the Modify Area Feature dialog box. To move up and down within the list, use the blue navigation arrows located on the small toolbar near the top of the dialog box.
|
Step 4 |
In the Info list, click on the area landmark/hydrographic area you want to delete. The selected entry is highlighted in the Info list and the map zooms directly to the selected feature.
|
Step 5 |
Click the Delete Area Feature button on the Modify Area Feature dialog toolbar.
A pop-up box opens and asks you to confirm that you want to delete the feature.
|
Step 6 |
To delete the area landmark/hydro area, click OK. The linear feature turns gray (color may vary) on the map, and its name disappears from the Info list. |
Step 7 |
Not ready to delete? If you change your mind about deleting the area landmark/hydro area, click Cancel. You will be returned to the Modify Area Feature dialog.
|
Step 8 |
If you now decide to delete the area landmark/hydro feature, click on the feature name in the Info list. The buttons will reactivate and you may click the Delete Area Feature button again. |
Follow the steps below to add area to an area landmark or hydrographic area.
Table 39: Adding Area to an Area Landmark/Hydrographic Area
Step |
Action and Result |
Step 1 |
Open in Map View the county that contains the area landmark or hydrographic area to which you wish to add area. Be sure the ‘Area_Landmarks’ layer is checked in the Table of Contents. |
Step 2 |
Click the Modify Area Feature button on the BAS toolbar.
The Modify Area Feature dialog box opens.
|
Step 3 |
Click the down arrow next to the Geography field and select ‘Area Landmark/Area Hydrography’ in the drop-down menu. The selection populates the Geography field and a list of area landmarks/hydro features in the county appears in the Info list.
|
Step 4 |
Click the row in the list for the area landmark/hydro area to which you want to add area. The selected entity is highlighted in the Info list and the map zooms to its location.
|
Step 5 |
To select the face(s) you want to add to the area landmark, click the Select Feature button on the Modify Area Feature toolbar.
Then click the face you want to add to the area feature. The added face turns cyan blue (color may vary). (Note: To select more than one face, depress the CTRL key, and while holding it down, click the other faces.)
|
Step 6 |
To add the face(s) selected, click the Add Area button on the Modify Area Feature dialog box toolbar.
The selected face is added to the area landmark and turns the same color as the other face(s) that make up the area landmark. The map also now shows the full extent of the area landmark.
|
|
Because all geographic areas consist of faces, you may need to “split” a face to accurately reflect an entity’s boundary. To split a face, digitize a new line that represents the boundary’s location (click on Table 33 for instructions to add a linear feature) and assign it the appropriate MTFCC. This splits the original face into two faces. You can now select the face you need to add to the new entity. |
Follow the steps below to remove area from an area landmark or hydrographic area.
Table 40: Removing Area from an Area Landmark/Hydrographic Area
Step |
Action and Result |
Step 1 |
Open in Map View the county that contains the area landmark or hydrographic area from which you wish to remove area. Be sure the ‘Area_Landmarks’ layer is checked in the Table of Contents. |
Step 2 |
Click the Modify Area Feature button on the BAS toolbar.
The Modify Area Feature dialog box opens.
|
Step 3 |
In the Geography field drop-down menu, select ‘Area Landmark/Area Hydrography’. ‘Area Landmark/Area Hydrography’ populates the Geography field and a list of area landmarks and hydrological features in the county appears in the Info list.
|
Step 4 |
Select the area landmark/hydro area from which you want to remove area. The selected entity is highlighted in the Info list and the map zooms to its location. In this example, we have chosen Indian Lake County Park.
|
Step 5 |
To select the face(s) you want to remove from the area landmark, click the Select Feature button on the Modify Area Feature dialog box toolbar.
Then click on the first face you want to remove. To select additional faces, depress the CTRL key, and while holding it down, click the additional faces. |
Step 6 |
To remove the face(s) selected, click the Remove Area button on the Modify Area Feature dialog box’s internal toolbar.
The selected face turns light green (color may vary) on the map and is removed from the area landmark.
|
|
Because all geographic areas consist of faces, you may need to “split” a face to accurately reflect an entity’s boundary. To split a face, digitize a new line that represents the boundary’s location (click on Table 33 for instructions to add a linear feature) and assign it the appropriate MTFCC. This splits the original face into two faces. You can now select the face you need to add to the new entity. |
Adding a Point Landmark
To add a point landmark, follow the steps below.
Table 41: Adding a Point Landmark
Step |
Action and Result |
Step 1 |
Open in Map View the county that contains the entity where you want to add the point landmark. Be sure the point landmarks layer (pointlm_18077 in this example) is checked in the Table of Contents. Then zoom to the location where you want to add the landmark.
|
Step 2 |
Click the Add Point Landmark button on the BAS toolbar.
|
Step 3 |
Click on the map where you want to add the point landmark. The Add Point Landmark dialog box opens and a red X marks the location you selected.
|
Step 4 |
Type in the name for the new point landmark in the FULLNAME: field. Then click the down arrow next to the MTFCC: field to open the drop-down menu.
|
Step 5 |
Select
the MTFCC, then click the OK The map updates to show the added point landmark. In this case we added a traffic circle and named it Buchanan Circle.
|
Deleting a Point Landmark
To delete a point landmark, follow the steps in Table 42.
Table 42: Deleting a Point Landmark
Step |
Action and Result |
Step 1 |
Zoom to the area on the map where you want to delete a point landmark. In this example, we will delete the traffic circle named Buchanan Circle. |
Step 2 |
Click the Delete Point Landmark button on the BAS toolbar.
|
Step 3 |
On the map, click on the point landmark you want to delete (Buchanan Circle). The Delete Point Landmark dialog box opens, and asks if you are sure you want to delete the point landmark.
|
Step 4 |
Click OK. The point landmark disappears from the map and from the attribute table. |
Changing the Attributes of a Point Landmark
To change the attributes of a point landmark (e.g., its name, MTFCC), follow the steps below.
Table 43: Changing the Attributes of a Point Landmark
Step |
Action and Result |
Step 1 |
Zoom to the area on the map where the point landmark is located and click on the landmark. In this example, we will change the name of Buchanan Traffic Circle. |
Step 2 |
Click on the Edit Point Landmark button on the BAS toolbar.
|
Step 3 |
On the map, click on Buchanan Circle. The Edit Point Landmark dialog box opens.
|
Step 4 |
To change the name, backspace over the name appearing in the FULLNAME: field, then type in the new name. In this example, we will change the name to Marley Circle.
|
Step 5 |
Click OK. The new name of the point landmark appears on the map.
|
GUPS provides two tools—the Geography Review tool and the Review Change Polygons tool to help you review and validate the updates you have made in the system.
Geography Review Tool
The Geography Review tool filters the map layers based on various fields in the attribute table. You can use this tool to check the changes you made to linear features, area landmarks, point landmarks, and legal boundaries anywhere within a county (you may also view the attributes of entities, features, landmarks, and boundaries you did not change). Note: Although this tool allows you to review your changes, you cannot use it to edit them.
Instructions for how to use the Geography Review tool information appear below.
Table 44: Using the Geography Review Tool
Step |
Action and Result |
Step 1 |
Click on the Geography Review button on the BAS toolbar.
The Geography Review Tool dialog box opens.
|
Step 2 |
In the Layer Name: field drop-down menu, select the data layer you want to view:
In this example, we selected the file “bas19_25510500000_55105_changes_alndk.” This is the transaction data output file for the area landmark layer (note the word “changes” in the file name to indicate the layer has been updated). |
Step 3 |
Once you make your selection, the attribute table for the layer opens, with the attributes for each area landmark you changed displayed in a separate row.
|
|
If you cannot see all the columns in the attribute data table, drag the edge of the dialog box outward to widen the view. You may also move the dialog box to another location by clicking inside the box and dragging it. |
Step 4 |
To see an area landmark on the map, click its row in the attribute table, then click the Zoom button (the row is highlighted and the map automatically zooms to the landmark selected, which is highlighted and shows changes made in cyan blue – colors may vary).
|
Step 5 |
To view other area landmarks listed in the table rows, use the Previous Zoom and Next Zoom buttons. The previous or next row highlights and the system zooms to the map for that row.
|
Step 6 |
You may use the Search feature at the bottom of the dialog box to filter the table layers by specific attributes (e.g., full name, MTFCC, change type, etc.).
|
Step 7 |
First, select the layer you want to view (in this example, we will select the county subdivision layer).
For each feature changed for a county subdivision, the attributes of the changed feature display in the table rows. Each column gives the name of the attribute.
|
Step 8 |
In the Column Name drop-down menu, select the attribute by which you want to filter.
In this example, we will select change type (CHNG_TYPE). |
Step 9 |
Finally, in the Select drop-down, select the attribute value by which you want to filter, then click the Search button. In this example, we will select ‘Boundary Correction’.
After you click Search, the attribute table is filtered to show the rows for all boundary corrections made in the county subdivision layer.
|
Step 10 |
To view an individual boundary correction, click on its row and click the Zoom button. |
Step 11 |
To
return to the attribute table to see the full (unfiltered)
county subdivision layer, click the Refresh |
|
Note that when filtering the table by some attributes (e.g., state and county FIPS code or MTFCC), no drop-down list appears from which to make a selection. This is because some attribute codes are too numerous to make scrolling through a list practicable. Instead you will receive a blank box in which you may type the search value. For example, if you are filtering the area landmarks layer by MTFCC and want to see hospitals in the layer, type in the MTFCC for hospitals (K1231), as shown below, then click Search.
|
Reviewing Change Polygons Tool
The Review Change Polygons tool allows you to view the transactions created from the edits you made to legal entities, as well as to area landmarks and hydrographic areas. You can review the transaction polygons that represent boundary changes, as well as new incorporations and disincorporations. The tool also allows you to make corrections to change polygons.

To use the Review Change Polygons tool, follow the steps below.
Table 45: Reviewing Change Polygons
Step |
Action and Result |
Step 1 |
In the Map Management dialog box, make sure the county for which you want to run the check appears in the Working County field.
Once you click the Open button at the bottom of the dialog box and the map opens in Map View, you are ready to run the Review Change Polygons check. |
|
If you made changes in more than one county, you must run the check for each county in which you worked. This means that after completing the check for one county you must return to Map Management and select the additional county in which you worked as the working county. Then run the check on it. Repeat this process until you have run the check for all counties in which you made changes. If you did not make any changes in another county, you need only run the check for your county. |
Step 2 |
Once you have loaded the working county, you are ready to begin the change polygons review. Click on the Review Change Polygons button on the BAS toolbar.
The Review Change Polygons dialog box opens just below the Table of Contents.
Note: This box can be dragged anywhere on your screen and docked. |
Step 3 |
Use the Geography drop-down menu shown below to select the geography you want to review. In this example, we have selected ‘MCD’.
|
Step 4 |
After you select an entity type, the Small Area Check and Find Holes buttons become active and all change polygons for the entity type you selected appear in the Info list at the bottom of the box.
|
Step 5 |
To check for small area change polygons, click the Small Area Check button. If all your change polygons are of sufficient size, a pop-up box informs you of this.
|
Step 6 |
If you have small area polygons within an MCD in the working county, they appear in the Info list with their acreage noted in the Area in Acres column. The Display All Changes button also becomes active (this button allows you to toggle back to see all change polygons in the list).
|
Step 7 |
To view a polygon on the map, click the row for the polygon in the Info list. The polygon is highlighted and the map zooms to the location of the polygon.
Note in the illustration above, we moved the Review Change Polygons box to sit over the map. As stated earlier, you may move the box anywhere on the page and dock it. |
Step 8 |
To delete polygons that are too small (less than 500 square feet), click on the row for the change polygon in the Info list. The Delete Change Polygon button appears.
|
Step 9 |
To delete the polygon, click the Delete Change Polygon button. A pop-up box asks if you are sure you want to delete.
|
Step 10 |
Click the Yes button. The polygon is removed from the list, from the map, and from the attribute table. |
Step 11 |
Before the Small Area check is complete, you must repeat the steps above for each geography type for which you created change polygons. |
Step 12 |
Next, review your polygons for holes (that is, two or fewer small faces missed when creating a change polygon). While still in the Review Change Polygons dialog box, select a geography type from the Geography drop-down menu. For this example, we again selected ‘MCD’. A list of change polygons for MCDs in the county populates the Info list and the Display All Changes button replaces the Small Area button (since you’ve already run this check). The Find Holes buttons remains in its original location.
|
Step 13 |
Click on the row for the polygon in the Info list to see it on the map, then click the Find Holes button. If no holes are present, a pop-up box informs you of this.
|
Step 14 |
If holes are found, a list of polygons with holes appears in the Holes Review box and the Fix button activates at the bottom of the box.
|
Step 15 |
To correct a change polygon, click on its row to highlight it. The map zooms to its location and displays all holes in cyan blue (color may vary).
|
Step 16 |
Click the Fix button to repair the hole. The change polygon is corrected and the correction displays on the map (i.e., the hole is changed to the same color as the remainder of the polygon).
|
Step 17 |
Before the Find Holes check is complete, you must repeat the steps above for each geography type for which you created change polygons. |
Step 18 |
After you review for small areas and holes, you may also use the Review Change Polygons tool to check the general accuracy of your change polygons. To do so, select your entity type in the Geography drop-down menu. A full list of change polygons for the geography type selected displays in the Info list. |
Step 19 |
Click on the row for each polygon to see it on the map and review your changes. If you notice a mistake on the map (e.g., you created a new incorporated place that was supposed to have six faces, but you selected only five), click on the Modify Area Feature button on the BAS toolbar and make the correction. |
Step 20 |
To review boundary changes, select the entity type you want to review in the Geography drop-down menu at the top of the Review Change Polygons dialog box. In this example, we select ‘Place’. All boundary change polygons for the entity type selected populate the Info list. To review a boundary change, click on the change polygon in the list, then click the Legal Entity Change button at the bottom of the Review Change Polygons dialog box, shown below.
The map zooms to where the change was made and a box opens displaying the information that you entered when you coded the change. Here, because the change was a boundary correction, the effective date, authority type, and documentation fields are not filled.
If this change was mistakenly coded as a boundary correction, and should have been a legal change instead, you may correct the error here. In this example we correct a change polygon mistakenly coded as a boundary correction rather than an annexation. |
Step 21 |
Click the calendar icon next to the EFF_DATE field to select an effective date for the annexation.
|
Step 22 |
Use the drop-down menu for the AUTHTYPE field to select the authority type for the change.
|
Step 23 |
In the DOCU field, type in the ordinance or other legal documentation number authorizing the annexation, or upload legal documentation for the change. To upload documentation, click the folder icon next to the DOCU field.
When the DOCU window opens, click on the icon for ‘My Computer’ (or simply ‘Computer’ in some Windows versions) to open the directory where you have saved your documentation.
Your directories display, as shown below.
Select the appropriate directory and navigate to the file you want to upload. Click the file. Then, to upload it, click the Open button at the bottom of the DOCU window.
GUPS uploads the file and the file name appears in the DOCU field. |
Step 24 |
Finally, in the CHNG_TYPE field drop-down menu, change ‘Boundary Correction’ to the correct change type (‘Annexation’, ‘Corridor’, or ‘Offset’). Here we select ‘Annexation’.
|
Step 25 |
Click
the OK
|
Step 26 |
When
you have completed all
your reviews
(for small areas, holes, and boundary changes) for all
entity types,
and have made any corrections needed, click the Save
|
Step 27 |
If you made changes in more than one working county, return to Map Management, select the additional county as your working county, and repeat the steps above. Repeat this process as many times as needed until you have run the Review Change Polygons check on all the counties in which you made changes. |
GUPS allows you to generate printable maps in four formats (.pdf, .png., .tiff, and .jpeg). The maps can be created in portrait or landscape view, on letter or ledger (legal) size paper, and at various scales. To export a printable map from GUPS, follow the steps below.
Table 46: Export a Printable Map
Step |
Action and Result |
Step 1 |
Click on the Export to ZIP button on the BAS toolbar.
The Print Map to File dialog box opens.
|
Step 2 |
In the Desired Map Titles section, type in a map title and sub-title.
|
Step 3 |
Under Page Orientation, click the radio button next to ‘Portrait’ or ‘Landscape’ to select the map’s orientation on the page when printed.
The map orientation in the preview pane to the right changes to reflect your selection.
Portrait View (left) and Landscape View (right) |
Step 4 |
Under Map Scale, click the appropriate radio button to select the map scale (you may use your current map extent or set a fixed scale). To select a fixed scale, click the radio button next to ‘Fixed Scale’, then click the down arrow to open the drop-down menu. In the drop-down list, click on the scale that you want.
|
Step 5 |
Under Desired Paper Size, click the radio button next to ‘Letter’ for 8½ by 11-inch paper or the ‘Ledger’ button for 11 by 17-inch paper.
|
Step 6 |
When you are ready to export the file, under Export File Format, click the radio button next to the desired format. You may export the file in .pdf, .png, .tiff, or .jpeg format.
|
Step 7 |
Click the Save button. The Map Export – Save Map As… window opens.
Note: GUPS automatically selected the “output” folder for BAS2019 as the save location. This folder was created on your computer by the GUPS installer. If you want to save the file to a different location, navigate to the location first before saving. |
Step 8 |
After you have selected the location, type in the name you want to give the file, then click Save.
|
Step 9 |
The file is saved and you receive a pop-up message confirming that the export is complete.
|
Step 10 |
To save the file, click OK. Your file is saved either in the default BAS2019 output location or in the alternate location you specified. Here we saved the file in the default location.
|
When creating ZIP files to export, you have two options—you may export the file to share with another user or you may export the file for submission to the Census Bureau. In either case, GUPS automatically names the output ZIP file for you. It packages all the files required by the Census Bureau (including any documentation you uploaded) into the ZIP file and saves it in a preset location created on your computer by during the installation process.

Exporting a File to Share
To export a file to share with another user, follow the steps below.
Table 47: Exporting Files to Share with Another User
Step |
Action and Result |
Step 1 |
Click on the Export to ZIP button on the BAS toolbar.
|
Step 2 |
After you click Export to Zip button, you may receive one of two results, depending on whether you have validated your changes using the Review Change Polygons tool. If you have not used the tool to check your work, the Export to ZIP pop-up box appears and lists the specific checks that need to be run before you can export the file.
If you see this message, click the Cancel button and run the Review Change Polygons check. Then repeat the initial export steps again. |
Step 3 |
If you have already run the Review Change Polygon check, the Export to ZIP pop‑up box displays the status of the checks and the date and time they were made, as shown below.
|
Step 4 |
Look carefully at the run times listed. If you have made any additional changes after these times, click Cancel and run the Review Change Polygons check again. Then repeat the export steps. |
Step 5 |
The Select Output Type dialog box opens.
To prepare ZIP file to be shared with another user, select the “Share with Another Participant” radio button. Click OK. |
Step 6 |
The ZIP File Output dialog box opens. It informs you that the ZIP file was created and asks if you want to view the folder.
|
Step 7 |
If you click Yes, the directory opens and displays the folder location where GUPS placed the file. Note: GUPS automatically saves the file to an output folder that the GUPS installer placed on your computer during the installation process.)
|
Step 8 |
You may now share the file with another user. |
Exporting a File to Submit to the Census Bureau
To export a file to submit to the Census Bureau, follow the steps below.
Table 48: Exporting Files for Submission to the Census Bureau
Step |
Action and Result |
Step 1 |
Click on the Export to ZIP button on the BAS toolbar.
The Select Output Type dialog box opens.
Click the Export for Census radio button. Then click OK. |
Step 2 |
After you click OK, you may receive one of two results, depending on whether you have validated your changes using the Review Change Polygons tool. If you have not used the tool to check your work, the Export to ZIP pop-up box appears and lists the specific checks that need to be run before you can export the file.
|
Step 3 |
If you see this message, click the Cancel button and run the Review Change Polygons check. Then repeat the initial export steps again. |
Step 4 |
If you have already run the Review Change Polygon check, the Export to ZIP pop‑up box displays the status of the checks and the date and time they were made, as shown below.
|
Step 5 |
Look carefully at the run times listed. If you have made any additional changes after these times, click Cancel and run the Review Change Polygons check again. Then repeat the export steps. |
Step 6 |
Otherwise, click OK. The GUPS User Contact Information dialog box opens up. Complete the required fields and click OK.
The ZIP File Output dialog box opens. It informs you that the ZIP file was created and asks if you want to view the folder.
|
Step 7 |
If you click Yes, the directory opens and displays the folder location where GUPS placed the file. Note: GUPS automatically saves the file to an output folder that the GUPS installer placed on your computer during the installation process.
|
Step 8 |
You are now ready to upload your file to the Census Bureau through the SWIM. See Section 7 on the next page. |
To upload and transmit your update files to the Census Bureau, you must access your account in the Secure Web Incoming Module (SWIM), as shown in the table below.
Note: If you already have a SWIM account, have your user name (email address) and password ready. If you do not have a SWIM account, have the 12-digit registration token provided by the Census Bureau ready.
Table 49: Transmitting Files to the Census Bureau Using SWIM
Step |
Action and Result |
Step 1 |
If you are a participant in another Census Bureau partnership program and already have a SWIM Account, access <https://respond.census.gov/swim/> and enter your Email address and Password. Then click the Login button. The Welcome screen opens. Go to Step 7.
|
Step 2 |
If you do not yet have a SWIM Account, have the 12-digit registration token provided to you by the Census Bureau ready for your registration. You can register at <https://respond.census.gov/swim/>. Once the login screen opens, click the Register Account button. The Account Registration screen opens.
|
|
All fields on the Account Registration screen are required. You will not be able to move to the next screen until you have completed all fields. |
Step 3 |
On the Account Registration screen, first, enter the 12-digit token provided by the Census Bureau. Then enter your name, agency, and email in the appropriate fields. |
Step 4 |
Next, create a password. The passwords must meet the five criteria below:
|
Step 5 |
Set up a security question (click the arrow on the right of the Security Question box and select a question in the drop-down list, then enter an answer in the Answer box). When you have finished, click the Submit button. A screen opens to confirm that you have successfully registered.
|
Step 6 |
On the Confirmation screen, click Login. You will return to the Login screen.
|
Step 7 |
On the Login screen, enter your email and password then click the green Login button. The Welcome screen opens. You will see the list of files you have previously uploaded, the creation date of the file, the name of the file, and its corresponding zip size. If you need to make modifications, click on the file you want to edit then select the Start Now Upload button.
|
Step 8 |
To begin an upload, click the Start New Upload button. A screen opens asking which program for which you are reporting data. On this screen, click the Boundary Annexation Survey (BAS) radio button, then click Next at the bottom of the screen.
|
Step 9 |
A screen opens asking “What type of BAS you are reporting for?” Click the radio button next to the governmental unit for which you are reporting data, then click the Next button. In this example, we will select County.
|
Step 10 |
A screen opens that allows you to select your state and the entity (in this case county) for which you are reporting data. For the example, select North Carolina in the State field drop-down menu and the county in the County field drop-down menu. Then click the Next button.
|
Step 11 |
The Select a .ZIP file to upload screen opens. Choose a zip file to upload. Note: All files must be a zip file. To upload a file, click the + Add File button on the screen.
|
Step 12 |
The Choose File to Upload window opens and allows you to navigate on your computer to the ZIP file’s location.
Locate the ZIP file you want to upload then double-click it. Note: You can only add one file at a time. |
Step 13 |
Once the file upload is complete, the Status field shows ‘Success.’ The name of the file appears in the File(s) field. To add another file, click the + Add File and the upload process will repeat. In this example, there are two files uploaded. One for an updated digital address list and one for an updated shapefile.
|
Step 14 |
After you have uploaded the file(s), type any comments (including pertinent information about data projection or supporting documentation for shapefiles) in the Comments field. Click Next. |
Step 15 |
The Thank You screen appears and confirms the receipt of your submission.
|
Step 16 |
To submit files for a different entity, click on the ‘Upload Form’ link in the phrase “You may Log Out or return to the upload form, to submit more files.” This choice returns you to the Welcome screen. To log out, click on Log Out. The Census Bureau will acknowledge the receipt of the uploaded file. |
|
SWIM sessions deactivate after 15 minutes of inactivity. Note: While working in SWIM, you may obtain help by clicking on the Help button on any screen. When you click the button, a screen opens with links to help resources.
|
Appendices
Action/Question |
Resource |
Contact |
Request shapefiles on DVD |
Geography Division |
Call: 1‑800-972-5651 Email: [email protected] |
BAS materials questions |
Geography Division |
Call: 1‑800-972-5651 Email: [email protected] |
Legal boundary questions |
Geography Division |
Call: 1-301-763-1099 Email: [email protected] Fax: 1-800-972-5652 |
Ask guidance on areas under legal dispute |
Census Bureau Legal Office |
Call: 1-301-763-9844 |
GUPS technical support |
Geography Division |
Call: 1‑800-972-5651 Email: [email protected] Be sure to have the number for the version of GUPS you are running ready. To find this number, go to the Help tab on the main Menu in GUPS and click ‘About GUPS’ in the drop-down menu. A pop-up box will provide you the number. |
SWIM token questions |
Geography Division |
Call: 1‑800-972-5651 Email: [email protected] |
SWIM technical support |
Geography Division |
|
Submit output files on DVD (if you do not have Internet access) |
National Processing Center |
Send to: US Census Bureau National Processing Center ATTN: BAS Returns, Bldg 63E 1201 East 10th Street Jeffersonville, IN 47132 |
Areal Feature - is a prominent and identifying feature of a landscape significant enough to warrant name recognition, such as a lake, park, school, military base, or cemetery, etc. This type of feature class is only assigned to a face geometry. Any face can be assigned to multiple features. For example, a water body can also be part of a park.
Edge - is a one-dimensional object (legacy 1-cell), bounded by two nodes: a start node and an end node. Its geometry is distinguished by the coordinates of the start and end nodes, and additional coordinates that are ordered and serve as vertices (or shape points) between the two nodes. An edge is a primitive feature in the Oracle database.
Effects of having Edge features in the MAF/TIGER Database(MTDB):
Represents an invisible boundary line for various geometry, geographic, and statistical data and can stand alone.
A linear feature always occupies the same space as an edge and there are attributes on an edge that are lone relevant when a linear feature exists.
Face - is a two-dimensional object (legacy 2-cell) bounded by two or more edges. Its boundary includes not only the edges that separate it from other faces, but also any interior edges (two-dimensional topological primitives) contained within the area of the face.
Geographic Area - is a demarcated area used for the collection and/or tabulation of Census Bureau data.
Geographic Corridors - is an area that includes only a road (or other feature’s) right-of-way and does not contain any structures. Figure 13. Annexed Area Corridor and Unincorporated shows a corridor that has been created where an incorporated place annexed the road right-of-way, but not the housing units assigned to either side of the road (these belong instead to an unincorporated area). If it is important to the incorporated place that its ownership and/or maintenance of the road and/or its right-of-way be displayed on Census Bureau’s maps, a geographic corridor should be created. However, the Census Bureau does not require places to report rights-of-way: maintaining geographic corridors in a nationwide database is difficult and impractical, and the right-of-way should only be included if it is crucial to the place, or if state or local laws require it. The Census Bureau would actually prefer that the area simply not be assigned to the place at all.
Figure 14. shows an example where the right-of-way belongs in an unincorporated area, while the housing units along it are included in an incorporated place (shown in color). While depicting this corridor may be important for local purposes, it is not relevant for Census Bureau tabulations and is not easy to depict in the Census nationwide database. This type of corridor should not be included in a BAS response.
Please note that the Census Bureau does not require places to display rights-of-way or road maintenance corridors that do not contain or potentially contain housing or population. If local or state law does not require depiction of these geographic features, the Census Bureau prefers that they be left off BAS submissions. However, if it is necessary for the place to depict them, then they must be submitted as a geographic corridor.
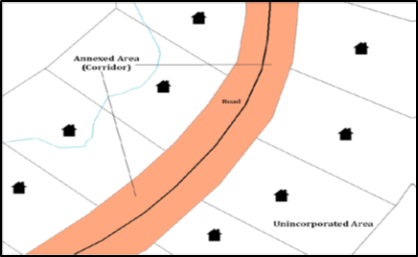
Figure 13. Annexed Area Corridor and Unincorporated Area
Figure 13 - A corridor that has been created where an incorporated place annexed the road right-of-way, but not the housing units assigned to either side of the road.
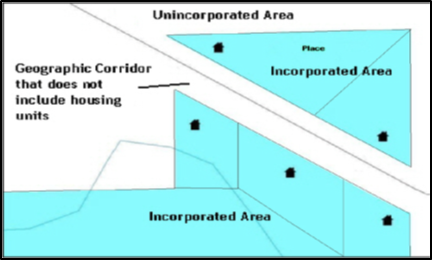
Figure 14. Incorporated Area and Unincorporated Area
Figure 14 - The right-of-way belongs in an unincorporated area, while the housing units along it are included in an incorporated place.
To recap, when a participant has a case where a road right-of-way is legally included in the boundary, but the adjacent parcels/houses are not, there are two options. You should either not include the area in the place at all (Scenario A in Figure 15. Participant Responses), or include it in the place and flag it as a corridor (Scenario C in Figure 15. Participant Responses). What you should never do is include such areas within the place boundary without flagging them as corridors (Scenario B in Figure 15. Participant Responses).
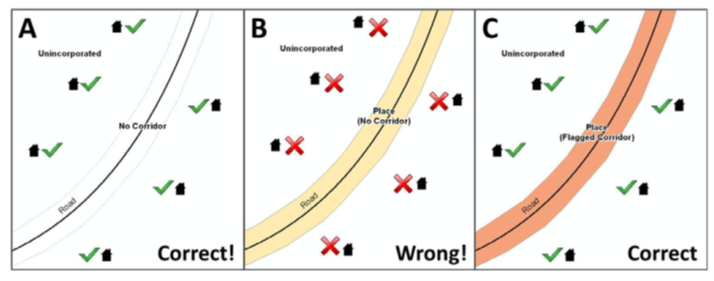
Figure 15. Participant Responses
Figure 15 – (A): The respondent did not include place ownership of the road or the right-of-way, allowing houses along the road to be geocoded correctly. (B): The respondent chose to show place ownership of the road, but did not flag it as a corridor, causing houses along the road to be incorrectly geocoded.(C): The respondent chose to show place ownership of the road, and flagged that ownership as a corridor, allowing the houses to be geocoded correctly. Both A and C are acceptable.
Geographic Offsets
A geographic offset is an area (either within or outside of a geographic entity) that is only on one side of a road (unlike corridors, which involve both sides of the road) and does not include structures addressed to that side of the road. Much of the same guidelines regarding corridors also holds true for offsets.
The Census Bureau is aware that many governments base their legal boundaries on cadastral (parcel-based) right-of-way mapping. Census Bureau maps are based on spatial data that is topologically integrated which makes maintenance of geographic offsets inefficient. Using the road centerline wherever possible will help to establish more accurate population counts. If a boundary follows a front lot line, the Census Bureau strongly prefers that the road centerline be used as the boundary. If a boundary is at the rear of a lot, then it should be depicted as such. If it is unclear whether a particular line is a front lot line or something else, please contact the BAS team for assistance. As a rule, if a house or building could not conceivably be built in the area between the potential line and the centerline of the road, then the line can be considered a front lot line. Figure 16. A Cadastral (Parcel-Based) Boundary Map depicts a cadastral (parcel-based) boundary map and Figure 17. How a Boundary Should be Represented When Sent to the Census Bureau shows how the boundary should be represented when it is sent to the Census Bureau.
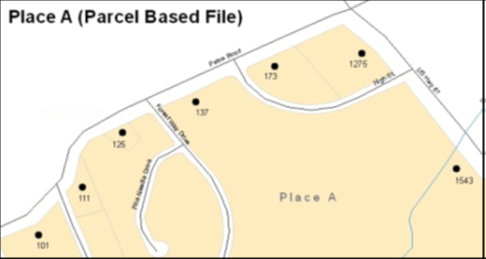
Figure 16. A Cadastral (Parcel-Based) Boundary Map
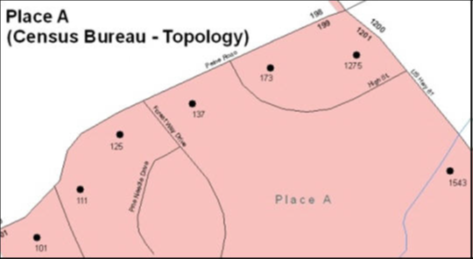
Figure 17. How a Boundary Should be Represented When Sent to the Census Bureau
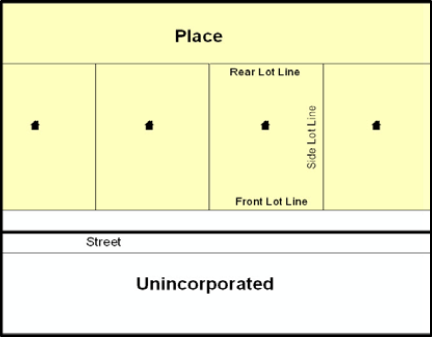
Figure 18. Place Boundary – Front Lot Line
Figure 18 - Shows a situation in which the place boundary is along the front lot line. In this example, the respondent must either use the road centerline as the boundary (preferred), or create an offset.
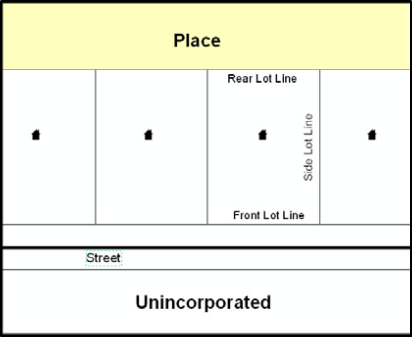
Figure 19. Place Boundary – Rear Lot Line
Figure 19 - The place boundary is on the rear lot line, so the respondent should of course not use the road centerline or create an offset, but should rather digitize in a new boundary following the rear lot line.
The Census Bureau has included an “offset” shapefile in the BAS materials (bas_2019_offset_<ssccc>.shp), so that your jurisdiction can be checked for any existing corridors or offsets. While the Census Bureau prefers that new offsets are not created (see above), this information can be helpful in determining if current boundaries are correct.
Linear Feature - is a single dimension feature (Road/Path, Hydro, Rail, or Miscellaneous) along one or more edges.
Point Feature - is an isolated node not connected to an edge. The XY coordinate point is where a structure resides. Point Feature structures include housing units and legacy point landmark of public facilities such as libraries, police stations, schools, churches, malls, and some monuments.
The MAF/TIGER Feature Classification Code (MTFCC) is a 5-digit code assigned by the Census Bureau to classify and describe geographic objects or features in Census Bureau MAF/TIGER products.
MTFCC |
Feature Class |
Feature Class Description |
C3022 |
Mountain Peak or Summit |
A prominent elevation rising above the surrounding level of the Earth’s surface. |
C3023 |
Island |
An area of dry or relatively dry land surrounded by water or low wetland [including archipelago, atoll, cay, hammock, hummock, isla, isle, key, moku and rock]. |
C3024 |
Levee |
An embankment flanking a stream or other flowing water feature to prevent overflow. |
C3026 |
Quarry (not water-filled), Open Pit Mine or Mine |
An area from which commercial minerals are or were removed from the Earth; not including an oilfield or gas field. |
C3027 |
Dam |
A barrier built across the course of a stream to impound water and/or control water flow. |
C3061 |
Cul-de-sac |
An expanded paved area at the end of a street used by vehicles for turning around. For mapping purposes, the Census Bureau maps it only as a point feature. |
C3062 |
Traffic Circle |
A circular intersection allowing for continuous movement of traffic at the meeting of roadways. |
C3066 |
Gate |
A movable barrier across a road. |
C3067 |
Toll Booth |
A structure or barrier where a fee is collected for using a road. |
C3071 |
Lookout Tower |
A manmade structure, higher than its diameter, used for observation. |
C3074 |
Lighthouse Beacon |
A manmade structure, higher than its diameter, used for transmission of light and possibly sound generally to aid in navigation. |
C3075 |
Tank/Tank Farm |
One or more manmade structures, each higher than its diameter, used for liquid (other than water) or gas storage or for distribution activities. |
C3076 |
Windmill Farm |
One or more manmade structures used to generate power from the wind. |
C3077 |
Solar Farm |
One or more manmade structures used to generate power from the sun. |
C3078 |
Monument or Memorial |
A manmade structure to educate, commemorate, or memorialize an event, person, or feature. |
C3079 |
Boundary Monument Point |
A material object placed on or near a boundary line to preserve and identify the location of the boundary line on the ground. |
C3080 |
Survey Control Point |
A point on the ground whose position (horizontal or vertical) is known and can be used as a base for additional survey work. |
C3081 |
Locality Point |
A point that identifies the location and name of an unbounded locality (e.g., crossroad, community, populated place or locale). |
C3085 |
Alaska Native Village Official Point |
A point that serves as the core of an Alaska Native village and is used in defining Alaska Native village statistical areas. |
G2100 |
American Indian Area |
A legally defined state- or federally recognized reservation and/or off-reservation trust land (excludes statistical American Indian areas). |
G2120 |
Hawaiian Home Land |
A legal area held in trust for the benefit of Native Hawaiians. |
G2130 |
Alaska Native Village Statistical Area |
A statistical geographic entity that represents the residences, permanent and/or seasonal, for Alaska Natives who are members of or receiving governmental services from the defining legal Alaska Native Village corporation. |
G2140 |
Oklahoma Tribal Statistical Area |
A statistical entity identified and delineated by the Census Bureau in consultation with federally recognized American Indian tribes that have no current reservation, but had a former reservation in Oklahoma. |
G2150 |
State-designated Tribal Statistical Area |
A statistical geographic entity identified and delineated for the Census Bureau by a state-appointed liaison for a state-recognized American Indian tribe that does not currently have a reservation and/or lands in trust. |
G2160 |
Tribal Designated Statistical Area |
A statistical geographic entity identified and delineated for the Census Bureau by a federally recognized American Indian tribe that does not currently have a reservation and/or off-reservation trust land. |
G2170 |
American Indian Joint Use Area |
An area administered jointly and/or claimed by two or more American Indian tribes. |
G2200 |
Alaska Native Regional Corporation |
Corporate entities established to conduct both business and nonprofit affairs of Alaska Natives pursuant to the Alaska Native Claims Settlement Act of 1972 (Public Law 92-203). There are twelve geographically defined ANRCs and they are all within and cover most of the State of Alaska (the Annette Island Reserve-an American Indian reservation-is excluded from any ANRC). The boundaries of ANRCs have been legally established. |
G2300 |
Tribal Subdivision |
Administrative subdivisions of federally recognized American Indian reservations, off-reservation trust lands, or Oklahoma tribal statistical areas (OTSAs). These entities are internal units of self-government or administration that serve social, cultural, and/or economic purposes for the American Indians on the reservations, off-reservation trust lands, or OTSAs. |
G2400 |
Tribal Census Tract |
A relatively small and permanent statistical subdivision of a federally recognized American Indian reservation and/or off-reservation trust land, delineated by American Indian tribal participants or the Census Bureau for the purpose of presenting demographic data. |
G2410 |
Tribal Block Group |
A cluster of census blocks within a single tribal census tract delineated by American Indian tribal participants or the Census Bureau for the purpose of presenting demographic data. |
G3100 |
Combined Statistical Area |
A grouping of adjacent metropolitan and/or micropolitan statistical areas that have a degree of economic and social integration, as measured by commuting. |
G3110 |
Metropolitan and Micropolitan Statistical Area |
An area containing a substantial population nucleus together with adjacent communities having a high degree of economic and social integration with that core, as measured by commuting. Defined using whole counties and equivalents. |
G3120 |
Metropolitan Division |
A county or grouping of counties that is a subdivision of a Metropolitan Statistical Area containing an urbanized area with a population of 2.5 million or more. |
G3200 |
Combined New England City and Town Area |
A grouping of adjacent New England city and town areas that have a degree of economic and social integration, as measured by commuting. |
G3210 |
New England City and Town Metropolitan and Micropolitan Statistical Area |
An area containing a substantial population nucleus together with adjacent communities having a high degree of economic and social integration with that core, as measured by commuting. Defined using Minor Civil Divisions (MCDs) in New England. |
G3220 |
New England City and Town Division |
A grouping of cities and towns in New England that is a subdivision of a New England City and Town Area containing an urbanized area with a population of 2.5 million or more. |
G3500 |
Urban Area |
Densely settled territory that contains at least 2,500 people. The subtypes of this feature are Urbanized Area (UA), which consists of 50,000 + people and Urban Cluster, which ranges between 2,500 and 49,999 people. |
G4000 |
State or Equivalent Feature |
The primary governmental divisions of the United States. The District of Columbia is treated as a statistical equivalent of a state for census purposes, as is Puerto Rico. |
G4020 |
County or Equivalent Feature |
The primary division of a state or state equivalent area. The primary divisions of 48 states are termed County, but other terms are used such as Borough in Alaska, Parish in Louisiana, and Municipio in Puerto Rico. This feature includes independent cities, which are incorporated places that are not part of any county. |
G4040 |
County Subdivision |
The primary divisions of counties and equivalent features for the reporting of Census Bureau data. The subtypes of this feature are Minor Civil Division, Census County Division/Census Subarea, and Unorganized Territory. This feature includes independent places, which are incorporated places that are not part of any county subdivision. |
G4050 |
Estate |
Estates are subdivisions of the three major islands in the United States Virgin Islands (USVI). |
G4060 |
Subbarrio (Subminor Civil Division) |
Legally defined divisions (subbarrios) of minor civil divisions (barrios-pueblo and barrios) in Puerto Rico. |
G4110 |
Incorporated Place |
A legal entity incorporated under state law to provide general-purpose governmental services to a concentration of population. Incorporated places are generally designated as a city, borough, municipality, town, village, or, in a few instances, have no legal description. |
G4120 |
Consolidated City |
An incorporated place that has merged governmentally with a county or minor civil division, but one or more of the incorporated places continues to function within the consolidation. It is a place that contains additional separately incorporated places. |
G4210 |
Census Designated Place |
A statistical area defined for a named concentration of population and the statistical counterpart of an incorporated place. |
G4300 |
Economic Census Place |
The lowest level of geographic area for presentation of some types of Economic Census data. It includes incorporated places, consolidated cities, census designated places (CDPs), minor civil divisions (MCDs) in selected states, and balances of MCDs or counties. An incorporated place, CDP, MCD, or balance of MCD qualifies as an economic census place if it contains 5,000 or more residents, or 5,000 or more jobs, according to the most current data available. |
G5020 |
Census Tract |
Relatively permanent statistical subdivisions of a County or equivalent feature delineated by local participants as part of the Census Bureau’s Participant Statistical Areas Program. |
G5030 |
Block Group |
A cluster of census blocks having the same first digit of their four-digit identifying numbers within a Census Tract. For example, block group 3 (BG 3) within a Census Tract includes all blocks numbered from 3000 to 3999. |
G5035 |
Block Area Grouping |
A user-defined group of islands forming a single census tabulation block. A BAG must: (1) consist of two or more islands, (2) have a perimeter entirely over water, (3) not overlap, and (4) not cross the boundary of other tabulation geographies, such as county or incorporated place boundaries. |
G5040 |
Tabulation Block |
The lowest-order census defined statistical area. It is an area, such as a city block, bounded primarily by physical features but sometimes by invisible city or property boundaries. A tabulation block boundary does not cross the boundary of any other geographic area for which the Census Bureau tabulates data. The subtypes of this feature are Count Question Resolution (CQR), current, and census. |
G5200 |
Congressional District |
The 435 areas from which people are elected to the U.S. House of Representatives. Additional equivalent features exist for state equivalents with nonvoting delegates or no representative. The subtypes of this feature are 106th, 107th, 108th, 109th, and 111th Congressional Districts, plus subsequent Congresses. |
G5210 |
State Legislative District (Upper Chamber |
Areas established by a state or equivalent government from which members are elected to the upper or unicameral chamber of a state governing body. The upper chamber is the senate in a bicameral legislature, and the unicameral case is a single house legislature (Nebraska). |
G5220 |
State Legislative District (Lower Chamber) |
Areas established by a state or equivalent government from which members are elected to the lower chamber of a state governing body. The lower chamber is the House of Representatives in a bicameral legislature. |
G5240 |
Voting District |
The generic name for the geographic features, such as precincts, wards, and election districts, established by state, local, and tribal governments for the purpose of conducting elections. |
G5400 |
Elementary School District |
A geographic area within which officials provide public elementary grade-level educational services for residents. |
G5410 |
Secondary School District |
A geographic area within which officials provide public secondary grade-level educational services for residents. |
G5420 |
Unified School District |
A geographic area within which officials provide public educational services for all grade levels for residents. |
G6120 |
Public-Use Microdata Area
|
A decennial census area with a population of at least 100,000 or more persons for which the Census Bureau provides selected extracts of household-level data that are screened to protect confidentiality. |
G6300 |
Traffic Analysis District |
An area delineated by Metropolitan Planning Organizations (MPOs) and state Departments of Transportation (DOTs) for tabulating journey-to-work and place-of-work data. A Traffic Analysis District (TAD) consists of one or more Traffic Analysis Zones (TAZs). |
G6320 |
Traffic Analysis Zone |
An area delineated by Metropolitan Planning Organizations (MPOs) and state Departments of Transportation (DOTs) for tabulating journey-to-work and place-of-work data. |
G6330 |
Urban Growth Area |
An area defined under state authority to manage urbanization that the Census Bureau includes in the MAF/TIGER® System in agreement with the state. |
G6350 |
ZIP Code Tabulation Area (Five-Digit) |
An approximate statistical-area representation of a U.S. Postal Service (USPS) 5-digit ZIP Code service area. |
G6400 |
Commercial Region |
For the purpose of presenting economic statistical data, municipios in Puerto Rico are grouped into commercial regions. |
H1100 |
Connector |
A known, but nonspecific, hydrographic connection between two nonadjacent water features. |
H2025 |
Swamp/Marsh |
A poorly drained wetland, fresh or saltwater, wooded or grassy, possibly covered with open water [includes bog, cienega, marais and pocosin]. |
H2030 |
Lake/Pond |
A standing body of water that is surrounded by land. |
H2040 |
Reservoir |
An artificially impounded body of water. |
H2041 |
Treatment Pond |
An artificial body of water built to treat fouled water. |
H2051 |
Bay/Estuary/Gulf/ Sound |
A body of water partly surrounded by land [includes arm, bight, cove and inlet]. |
H2053 |
Ocean/Sea |
The great body of salt water that covers much of the earth. |
H2060 |
Gravel Pit/Quarry filled with water |
A body of water in a place or area from which commercial minerals were removed from the Earth. |
H2081 |
Glacier |
A body of ice moving outward and down slope from an area of accumulation; an area of relatively permanent snow or ice on the top or side of a mountain or mountainous area [includes ice field and ice patch]. |
H3010 |
Stream/River |
A natural flowing waterway [includes anabranch, awawa, branch, brook, creek, distributary, fork, kill, pup, rio, and run]. |
H3013 |
Braided Stream |
A natural flowing waterway with an intricate network of interlacing channels. |
H3020 |
Canal, Ditch or Aqueduct |
An artificial waterway constructed to transport water, to irrigate or drain land, to connect two or more bodies of water, or to serve as a waterway for watercraft [includes lateral]. |
K1225 |
Crew-of-Vessel Location |
A point or area in which the population of military or merchant marine vessels at sea are assigned, usually being at or near the home port pier. |
K1231 |
Hospital/Hospice/ Urgent Care Facility |
One or more structures where the sick or injured may receive medical or surgical attention [including infirmary]. |
K1235 |
Juvenile Institution |
A facility (correctional and non-correctional) where groups of juveniles reside; this includes training schools, detention centers, residential treatment centers and orphanages. |
K1236 |
Local Jail or Detention Center |
One or more structures that serve as a place for the confinement of adult persons in lawful detention, administered by a local (county, municipal, etc.) government. |
K1237 |
Federal Penitentiary, State Prison, or Prison Farm |
An institution that serves as a place for the confinement of adult persons in lawful detention, administered by the federal government or a state government. |
K1238 |
Other Correctional Institution |
One or more structures that serve as a place for the confinement of adult persons in lawful detention, not elsewhere classified or administered by a government of unknown jurisdiction. |
K1239 |
Convent, Monastery, Rectory, Other Religious Group Quarters |
One or more structures intended for use as a residence for those having a religious vocation. |
K1246 |
Community Center |
Community Center. |
K2110 |
Military Installation |
An area owned and/or occupied by the Department of Defense for use by a branch of the armed forces (such as the Army, Navy, Air Force, Marines, or Coast Guard), or a state owned area for the use of the National Guard. |
K2165 |
Government Center |
A place used by members of government (either federal, state, local, or tribal) for administration and public business. |
K2167 |
Convention Center |
An exhibition hall or conference center with enough open space to host public and private business and social events. |
K2180 |
Park |
Parkland defined and administered by federal, state, and local governments. |
K2181 |
National Park Service Land |
Area—National parks, National Monuments, and so forth—under the jurisdiction of the National Park Service. |
K2182 |
National Forest or Other Federal Land |
Land under the management and jurisdiction of the federal government, specifically including areas designated as National Forest, and excluding areas under the jurisdiction of the National Park Service. |
K2183 |
Tribal Park, Forest, or Recreation Area |
A place or area set aside for recreation or preservation of a cultural or natural resource and under the administration of an American Indian tribe. |
K2184 |
State Park, Forest, or Recreation Area |
A place or area set aside for recreation or preservation of a cultural or natural resource and under the administration of a state government. |
K2185 |
Regional Park, Forest, or Recreation Area |
A place or area set aside for recreation or preservation of a cultural or natural resource and under the administration of a regional government. |
K2186 |
County Park, Forest, or Recreation Area |
A place or area set aside for recreation or preservation of a cultural or natural resource and under the administration of a county government. |
K2187 |
County Subdivision Park, Forest, or Recreation Area |
A place or area set aside for recreation or preservation of a cultural or natural resource and under the administration of a minor civil division (town/township) government. |
K2188 |
Incorporated Place Park, Forest, or Recreation Area |
A place or area set aside for recreation or preservation of a cultural or natural resource and under the administration of a municipal government. |
K2189 |
Private Park, Forest, or Recreation Area |
A privately owned place or area set aside for recreation or preservation of a cultural or natural resource. |
K2190 |
Other Park, Forest, or Recreation Area (quasi-public, independent park, commission, etc.) |
A place or area set aside for recreation or preservation of a cultural or natural resource and under the administration of some other type of government or agency such as an independent park authority or commission. |
K2191 |
Post Office |
An official facility of the U.S. Postal Service used for processing and distributing mail and other postal material. |
K2193 |
Fire Department |
Fire Department. |
K2194 |
Police Station |
Police Station. |
K2195 |
Library |
Library. |
K2196 |
City/Town Hall |
City/Town Hall. |
K2400 |
Transportation Terminal |
A facility where one or more modes of transportation can be accessed by people or for the shipment of goods; examples of such a facility include marine terminal, bus station, train station, airport and truck warehouse. |
K2424 |
Marina |
A place where privately owned, light-craft are moored. |
K2432 |
Pier/Dock |
A platform built out from the shore into the water and supported by piles. This platform may provide access to ships and boats, or it may be used for recreational purposes. |
K2451 |
Airport or Airfield |
A manmade facility maintained for the use of aircraft [including airstrip, landing field and landing strip]. |
K2452 |
Train Station, Trolley or Mass Transit Rail Station |
A place where travelers can board and exit rail transit lines, including associated ticketing, freight, and other commercial offices. |
K2453 |
Bus Terminal |
A place where travelers can board and exit mass motor vehicle transit, including associated ticketing, freight, and other commercial offices. |
K2454 |
Marine Terminal |
A place where travelers can board and exit water transit or where cargo is handled, including associated ticketing, freight, and other commercial offices. |
K2455 |
Seaplane Anchorage |
A place where an airplane equipped with floats for landing on or taking off from a body of water can debark and load. |
K2456 |
Airport—Intermodal Transportation Hub/Terminal |
A major air transportation facility where travelers can board and exit airplanes and connect with other (i.e. non-air) modes of transportation. |
K2457 |
Airport—Statistical Representation |
The area of an airport adjusted to include whole 2000 census blocks used for the delineation of urban areas |
K2458 |
Park and Ride Facility/Parking Lot |
A place where motorists can park their cars and transfer to other modes of transportation. |
K2459 |
Runway/Taxiway |
A fairly level and usually paved expanse used by airplanes for taking off and landing at an airport. |
K2460 |
Helicopter Landing Pad |
A fairly level and usually paved expanse used by helicopters for taking off and landing. |
K2540 |
University or College |
A building or group of buildings used as an institution for post-secondary study, teaching, and learning [including seminary]. |
K2543 |
School or Academy |
A building or group of buildings used as an institution for preschool, elementary or secondary study, teaching, and learning [including elementary school and high school]. |
K2545 |
Museum, Visitor Center, Cultural Center, or Tourist Attraction |
An attraction of historical, cultural, educational or other interest that provides information or displays artifacts. |
K2561 |
Golf Course |
A place designed for playing golf. |
K2582 |
Cemetery |
A place or area for burying the dead [including burying ground and memorial garden]. |
K2586 |
Zoo |
A facility in which terrestrial and/or marine animals are confined within enclosures and displayed to the public for educational, preservation, and research purposes. |
K3544 |
Place of Worship |
A sanctified place or structure where people gather for religious worship; examples include church, synagogue, temple, and mosque. |
L4010 |
Pipeline |
A long tubular conduit or series of pipes, often underground, with pumps and valves for flow control, used to transport fluid (e.g., crude oil, natural gas), especially over great distances. |
L4020 |
Powerline |
One or more wires, often on elevated towers, used for conducting high-voltage electric power. |
L4031 |
Aerial Tramway/Ski Lift |
A conveyance that transports passengers or freight in carriers suspended from cables and supported by a series of towers. |
L4110 |
Fence Line |
A man-made barrier enclosing or bordering a field, yard, etc., usually made of posts and wire or wood, used to prevent entrance, to confine, or to mark a boundary. |
L4121 |
Ridge Line |
The line of highest elevation along a ridge. |
L4125 |
Cliff/Escarpment |
A very steep or vertical slope [including bluff, crag, head, headland, nose, palisades, precipice, promontory, rim and rimrock]. |
L4130 |
Point-to-Point Line |
A line defined as beginning at one location point and ending at another, both of which are in sight. |
L4140 |
Property/Parcel Line (Including PLSS) |
This feature class may denote a nonvisible boundary of either public or private lands (e.g., a park boundary) or it may denote a Public Land Survey System or equivalent survey line. |
L4150 |
Coastline |
The line that separates either land or Inland water from Coastal, Territorial or Great Lakes water. Where land directly borders Coastal, Territorial or Great Lakes water, the shoreline represents the Coastline. Where Inland water (such as a river) flows into Coastal, Territorial or Great Lakes water, the closure line separating the Inland water from the other class of water represents the Coastline. |
L4165 |
Ferry Crossing |
The route used to carry or convey people or cargo back and forth over a waterbody in a boat. |
P0001 |
Nonvisible Linear Legal/Statistical Boundary |
A legal/statistical boundary line that does not correspond to a shoreline or other visible feature on the ground. |
P0002 |
Perennial Shoreline |
The more-or-less permanent boundary between land and water for a water feature that exists year-round. |
P0003 |
Intermittent Shoreline |
The boundary between land and water (when water is present) for a water feature that does not exist year-round. |
P0004 |
Other non-visible bounding Edge (e.g., Census water boundary, boundary of an areal feature) |
A bounding Edge that does not represent a legal/statistical boundary, and does not correspond to a shoreline or other visible feature on the ground. Many such Edges bound area landmarks, while many others separate water features from each other (e.g., where a bay meets the ocean). |
R1011 |
Railroad Feature (Main, Spur, or Yard) |
A line of fixed rails or tracks that carries mainstream railroad traffic. Such a rail line can be a main line or spur line, or part of a rail yard. |
R1051 |
Carline, Streetcar Track, Monorail, Other Mass Transit |
Mass transit rail lines (including lines for rapid transit, monorails, streetcars, light rail, etc.) that are typically inaccessible to mainstream railroad traffic and whose tracks are not part of a road right-of-way. |
R1052 |
Cog Rail Line, Incline Rail Line, Tram |
A special purpose rail line for climbing steep grades that is typically inaccessible to mainstream railroad traffic. Note that aerial tramways and streetcars (which may also be called “trams”) are accounted for by other MTFCCs and do not belong in R1052. |
S1100 |
Primary Road |
Primary roads are generally divided, limited-access highways within the interstate highway system or under state management, and are distinguished by the presence of interchanges. These highways are accessible by ramps and may include some toll highways. |
S1200 |
Secondary Road |
Secondary roads are main arteries, usually in the U.S. Highway, State Highway or County Highway system. These roads have one or more lanes of traffic in each direction, may or may not be divided, and usually have at-grade intersections with many other roads and driveways. They often have both a local name and a route number. |
S1400 |
Local Neighborhood Road, Rural Road, City Street |
Generally a paved non-arterial street, road, or byway that usually has a single lane of traffic in each direction. Roads in this feature class may be privately or publicly maintained. Scenic park roads would be included in this feature class, as would (depending on the region of the country) some unpaved roads. |
S1500 |
Vehicular Trail (4WD) |
An unpaved dirt trail where a four-wheel drive vehicle is required. These vehicular trails are found almost exclusively in very rural areas. Minor, unpaved roads usable by ordinary cars and trucks belong in the S1400 category. |
S1630 |
Ramp |
A road that allows controlled access from adjacent roads onto a limited access highway, often in the form of a cloverleaf interchange. These roads are unaddressable and do not carry a name in the MAF/TIGER System. |
S1640 |
Service Drive usually along a limited access highway |
A road, usually paralleling a limited access highway, that provides access to structures along the highway. These roads can be named and may intersect with other roads. |
S1710 |
Walkway/Pedestrian Trail |
A path that is used for walking, being either too narrow for or legally restricted from vehicular traffic. |
S1720 |
Stairway |
A pedestrian passageway from one level to another by a series of steps. |
S1730 |
Alley |
A service road that does not generally have associated addressed structures and is usually unnamed. It is located at the rear of buildings and properties and is used for deliveries. |
S1740 |
Private Road for service vehicles (logging, oil fields, ranches, etc.) |
A road within private property that is privately maintained for service, extractive, or other purposes. These roads are often unnamed. |
S1750 |
Internal U.S. Census Bureau use |
Internal U.S. Census Bureau use. |
S1780 |
Parking Lot Road |
The main travel route for vehicles through a paved parking area. |
S1820 |
Bike Path or Trail |
A path that is used for manual or small, motorized bicycles, being either too narrow for or legally restricted from vehicular traffic. |
S1830 |
Bridle Path |
A path that is used for horses, being either too narrow for or legally restricted from vehicular traffic. |
S2000 |
Road Median |
The unpaved area or barrier between the carriageways of a divided road. |
Note: The information in this table was last updated in November 2017. |
||
Standard Street Type Abbreviations
Street Name Type
Standard Abbreviation
ALLEY
ALY
ANEX
ANX
ARCADE
ARC
AVENUE
AVE
BAYOU
BYU
BEACH
BCH
BEND
BND
BLUFF
BLF
BLUFFS
BLFS
BOTTOM
BTM
BOULEVARD
BLVD
BRANCH
BR
BRIDGE
BRG
BROOK
BRK
BROOKS
BRKS
BURG
BG
BURGS
BGS
BYPASS
BYP
CAMP
CP
CANYON
CYN
CAPE
CPE
CAUSEWAY
CSWY
CENTER
CTR
CENTERS
CTRS
CIRCLE
CIR
CIRCLES
CIRS
CLIFF
CLF
CLIFFS
CLFS
CLUB
CLB
COMMON
CMN
COMMONS
CMNS
CORNER
COR
CORNERS
CORS
COURSE
CRSE
COURT
CT
COURTS
CTS
COVE
CV
COVES
CVS
CREEK
CRK
CRESCENT
CRES
CREST
CRST
CROSSING
XING
CROSSROAD
XRD
CROSSROADS
XRDS
CURVE
CURV
DALE
DL
DAM
DM
DIVIDE
DV
DRIVE
DR
DRIVES
DRS
ESTATE
EST
ESTATES
ESTS
EXPRESSWAY
EXPY
EXTENSION
EXT
EXTENSIONS
EXTS
FALL
FALL
FALLS
FLS
FERRY
FRY
FIELD
FLD
FIELDS
FLDS
FLAT
FLT
FLATS
FLTS
FORD
FRD
FORDS
FRDS
FOREST
FRST
FORGE
FRG
FORGES
FRGS
FORK
FRK
FORKS
FRKS
FORT
FT
FREEWAY
FWY
GARDEN
GDN
GARDENS
GDNS
GATEWAY
GTWY
GLEN
GLN
GLENS
GLNS
GREEN
GRN
GREENS
GRNS
GROVE
GRV
GROVES
GRVS
HARBOR
HBR
HARBORS
HBRS
HAVEN
HVN
HEIGHTS
HTS
HIGHWAY
HWY
HILL
HL
HILLS
HLS
HOLLOW
HOLW
INLET
INLT
ISLAND
IS
ISLANDS
ISS
ISLE
ISLE
JUNCTION
JCT
JUNCTIONS
JCTS
KEY
KY
KEYS
KYS
KNOLL
KNL
KNOLLS
KNLS
LAKE
LK
LAKES
LKS
LAND
LAND
LANDING
LNDG
LANE
LN
LIGHT
LGT
LIGHTS
LGTS
LOAF
LF
LOCK
LCK
LOCKS
LCKS
LODGE
LDG
LOOP
LOOP
MALL
MALL
MANOR
MNR
MANORS
MNRS
MEADOW
MDW
MEADOWS
MDWS
MEWS
MEWS
MILL
ML
MILLS
MLS
MISSION
MSN
MOTORWAY
MTWY
MOUNT
MT
MOUNTAIN
MTN
MOUNTAINS
MTNS
NECK
NCK
ORCHARD
ORCH
OVAL
OVAL
OVERPASS
OPAS
PARK
PARK
PARKS
PARK
PARKWAY
PKWY
PARKWAYS
PKWY
PASS
PASS
PASSAGE
PSGE
PATH
PATH
PIKE
PIKE
PINE
PNE
PINES
PNES
PLACE
PL
PLAIN
PLN
PLAINS
PLNS
PLAZA
PLZ
POINT
PT
POINTS
PTS
PORT
PRT
PORTS
PRTS
PRAIRIE
PR
RADIAL
RADL
RAMP
RAMP
RANCH
RNCH
RAPID
RPD
RAPIDS
RPDS
REST
RST
RIDGE
RDG
RIDGES
RDGS
RIVER
RIV
ROAD
RD
ROADS
RDS
ROUTE
RTE
ROW
ROW
RUE
RUE
RUN
RUN
SHOAL
SHL
SHOALS
SHLS
SHORE
SHR
SHORES
SHRS
SKYWAY
SKWY
SPRING
SPG
SPRINGS
SPGS
SPUR
SPUR
SPURS
SPUR
SQUARE
SQ
SQUARES
SQS
STATION
STA
STRAVENUE
STRA
STREAM
STRM
STREET
ST
STREETS
STS
SUMMIT
SMT
TERRACE
TER
THROUGHWAY
TRWY
TRACE
TRCE
TRACK
TRAK
TRAFFICWAY
TRFY
TRAIL
TRL
TRAILER
TRLR
TUNNEL
TUNL
TURNPIKE
TPKE
UNDERPASS
UPAS
UNION
UN
UNIONS
UNS
VALLEY
VLY
VALLEYS
VLYS
VIADUCT
VIA
VIEW
VW
VIEWS
VWS
VILLAGE
VLG
VILLAGES
VLGS
VILLE
VL
VISTA
VIS
WALK
WALK
WALKS
WALK
WALL
WALL
WAY
WAY
WAYS
WAYS
WELL
WL
WELLS
WLS
GUPS Tools
GUPS loads a default layer symbology established for each Census Bureau geographic partnership program. You can change the default symbology to suit your preferences. To change the default symbology for a layer in GUPS, follow the instructions in Table 50.
Table 50: Reset Layer Symbology
Step |
Action and Result |
Step 1 |
Right-click on the layer in the Table of Contents (in this example, we selected the Edges layer). The Layers drop-down menu opens.
|
Step 2 |
In the drop-down menu, choose ‘Properties’. The Layer Properties screen opens.
|
Step 3 |
In the left-hand pane, click on Style, then double-click the symbol you want to edit in the layers list. In this example, we will double-click on ‘Roads, substr (“MTFCC, 1,1) = S1100’ to select it.
The Rule Properties dialog box opens and the Label and Filter fields display the item chosen. The Symbol pane shows the current symbology (yellow line).
|
Step 4 |
Choose a new color from the Color drop-down menu, or select a different symbol for the layer altogether by double-clicking any symbol in the Symbols in Group field. Click OK. The new symbology will display in the Table of Contents and in Map View.
|
You can change the default GUPS labeling display and also restore it to the original setting. To change the default labeling for a layer, follow the steps in Table 51.
Table 51: Change Default Labeling
Step |
Action and Result |
Step 1 |
Right click on the layer (we have selected the edges layer) in the Table of Contents. The Layers drop-down menu opens.
|
Step 2 |
In the drop-down menu, choose ‘Properties’. The Layer Properties dialog box opens.
|
Step 3 |
In the far left-hand pane, click Labels. The options to change the label display properties open in the main window.
|
Step 4 |
To change the attribute field, click on the drop-down menu for ‘Label this layer with’ at the top of the screen, and select the desired option.
Text style options allow you to change the font, style, size, color, transparency, type case, and spacing of layer labels. Shown below are the drop-down options for style.
|
To restore the default labeling for a layer, follow the steps in Table 52.
Table 52: Restoring Default Labeling
Step |
Action and Result |
Step 1 |
Right-click on the layer you changed in the Table of Contents. The layer’s drop-down menu opens. |
Step 2 |
In this example, we have selected the Edges layer. In the drop-down menu, click on the arrow to the right of ‘GUPS Layer’. Four options appear: ‘Load default style’, ‘Load all default style’, ‘Load BBSP Edges style’, and ‘Load Low profile Edges style’.
|
Step 3 |
Select ‘Load default style’ to restore the selected layer’s original properties OR select ‘Load all default style’ to reset ALL the layers to their original settings. |
Using the buttons on the toolbar located at the top of the Table of Contents, you can add and remove layers or groups, manage layer visibility, filter the legend by map content, expand or contract all sections of the Table of Contents list at once, and group layers.
The Table of Contents Layers toolbar contains the items shown below
in Figure 20.
Table 53: Table of Contents Layers Toolbar Buttons
describes the function of each of the buttons on the toolbar.

Figure 20. Table of Contents Layers Toolbar
Table 53: Table of Contents Layers Toolbar Buttons
Button |
Name |
Function / Description |
|
Add Group |
Allows you to organize layers in the Table of Contents into groups. |
|
Manage Layer Visibility |
Allows you to preset views in the Table of Contents. |
|
Filter Legend by Map Content |
Removes from the Table of Contents display any layers that are not currently in the Map View extent. This feature ensures that the Table of Contents does not contain entries for items not currently in the map view. |
|
Expand All |
Expands the Table of Contents menus (+) to display all layers under each group’s menu. |
|
Collapse All |
Collapses the Table of Contents menus (-) to show only groups. |
|
Remove Layer/Group |
Allows you to remove a layer or group from the Table of Contents. |
You can add preset views
![]() in
the Table of Contents by clicking on the Manage Layer Visibility
button on the Table of Contents toolbar. You can choose to display a
layer with specific categorization and add this view to the Presets
list.
in
the Table of Contents by clicking on the Manage Layer Visibility
button on the Table of Contents toolbar. You can choose to display a
layer with specific categorization and add this view to the Presets
list.
To add a preset view click on the Manage Layer Visibility button and choose ‘Add Preset…’ from the drop-down menu.
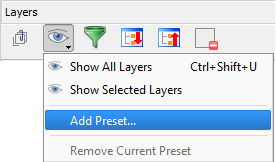
When the Visibility Presets pop-up appears, enter the name of the new preset and click OK.
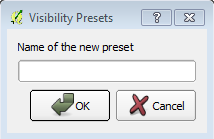
Figure 22. Visibility Presets Dialog Box
Note: By clicking on the Manage Layer Visibility button, you can view the list of all preset views that you have established and from which you can choose.
![]() Add a Layer
Add a Layer
Clicking on the Add Vector Layer button on the Add Data toolbar allows you to add shapefile and geodatabase feature classes to your GUPS project. Instructions and accompanying graphics are included in Section 5.7.1: The Add Data Toolbar.
![]() Remove a Layer or Group
Remove a Layer or Group
To remove a layer or group in the Table of Contents:
Left-click on the layer/group you want to remove, hold down the CTRL key, and click the Remove a Layer or Group button. The layer/group is removed.
Table 54: MAF/TIGER Feature Classification
MTFCC |
FEATURE NAME |
S1100 |
Interstate Highway or Primary Road with limited access |
S1200 |
Primary Road without limited access, US Highway, State Highway, or County Highway, Secondary and connecting roads |
S1400 |
Local Neighborhood Road, Rural Road, City Street |
S1500 |
Vehicular Trail (4WD) |
S1630 |
Ramp |
S1640 |
Service Drive usually along a limited access highway |
S1710 |
Walkway/Pedestrian Trail |
S1720 |
Stairway |
S1730 |
Alley |
S1740 |
Private Road for service vehicles (logging, oil fields, ranches, etc.) |
S1750 |
Private Driveway |
H3010 |
Stream/River |
H3013 |
Braided Stream |
H3020 |
Canal, Ditch or Aqueduct |
R1011 |
Railroad Feature (Main, Spur, or Yard) |
R1051 |
Carline, Streetcar Track, Monorail, Other Mass Transit Rail |
R1052 |
Cog Rail Line, Incline Rail Line, Tram |
P0001 |
Nonvisible Legal/Statistical Boundary |
L4010 |
Pipeline |
L4020 |
Power Transmission Line |
L4110 |
Fence Line |
L4121 |
Ridge Line |
L4031 |
Aerial Tramway/Ski Lift |
K2451 |
Airport or Airfield |
L4140 |
Property/Parcel Line |
L4165 |
Ferry Crossing |
State Shapefile Names
PVS_18_v2_<layername>_<SS>.shp, where <SS> is the number corresponding to the state, for example, “24” and <layername> is the abbreviation for the shapefile layer, describe in detail below.
Table 55: State Shapefiles Names
Shapefile Layer |
<layername> |
American Indian Areas (AIA) – Legal |
aial |
2010 American Indian Areas (AIA) – Legal |
aial2010 |
American Indian Areas (AIA) – Statistical |
aias |
American Indian Tribal Subdivisions (AITS) - Legal |
aitsl |
American Indian Tribal Subdivisions (AITS) - Statistical |
aitss |
Block Area Group |
bag |
Metropolitan Statistical Area/Metropolitan Statistical Area |
cbsa |
Congressional Districts |
cd |
Census Designated Place |
cdp |
Counties and Equivalent Areas |
county |
2010 Counties and Equivalent Areas |
county2010 |
Elementary School Districts |
elsd |
County Subdivisions - Legal |
mcd |
New England City and Town Areas |
necta |
Incorporated Places |
place |
2010 Public Use Microdata Areas |
puma2010 |
Secondary School Districts |
scsd |
State Legislative Districts Lower |
sldl |
State Legislative District Upper Chambers |
sldu |
State |
state |
Tribal Block Groups |
tbg |
Tribal Census Tracts |
tct |
2010 Census Tracts |
tracts2010 |
Urban Area |
uac |
Unified School District State-Based |
unsd |
County Shapefile Names
PVS_18_v2_<layername>_<SSCCC>.shp, where <SSCCC> is the number corresponding to the state and county, for example, “24001” and <layername> is the abbreviation for the shapefile layer, describe in detail below.
Table 56: County Shapefiles Names
Shapefile Layer |
<layername> |
American Indian Areas (AIA) – Legal |
aial |
American Indian Areas (AIA) – Statistical |
aias |
American Indian Tribal Subdivisions (AITS) - Legal |
aitsl |
American Indian Tribal Subdivisions (AITS) - Statistical |
aitss |
Alaska Native Regional Corporations (ANRC) |
anrc |
Area Landmark |
arealm |
Block Area Groups |
bag |
Block Groups |
bg |
Metropolitan Statistical Area/Metropolitan Statistical Area |
cbsa |
Census County Division |
ccd |
Congressional Districts |
cd |
Census Designated Place |
cdp |
Consolidated Cities |
concity |
Counties and Equivalent Areas |
county |
Census Tracts - Current |
curtracts |
All Lines |
edges |
Elementary School Districts |
elsd |
Hawaiian Home Lands (HHL) |
hhl |
County Subdivisions - Legal |
mcd |
New England City and Town Areas |
necta |
Offsets |
offset |
Incorporated Places |
place |
Point Landmarks |
pointlm |
2010 Public Use Microdata Areas |
puma2010 |
Secondary School Districts |
scsd |
State Legislative Districts Lower |
sldl |
State Legislative Districts Upper |
sldu |
Subbarrios |
submcd |
Census Blocks - Current |
tabblock |
2010 Census Blocks |
tabblock2010 |
2010 Traffic Analysis Delineation |
tad2010 |
2010 Traffic Analysis Zones |
taz2010 |
Tribal Block Groups |
tbg |
Tribal Census Tracts |
tct |
2010 Census Tracts |
tracts2010 |
Census Urban Areas |
uac |
Urban Growth Area |
uga |
Hydrography - Area |
water |
Unified School Districts |
unsd |
Relationship Tables |
|
Address Ranges |
addr |
Topological Faces (2-cells with all geocodes) |
faces |
Topological Faces - Area Landmark Relationship |
areafaces |
Topological Faces - Area Hydrography Relationship |
hydrofaces |
Linear Feature Names - Fielded |
allnames |
Table 57: Edges Shapefile (PVS_18_v2_edges)
ATTRIBUTE FIELD |
LENGTH |
TYPE |
DESCRIPTION |
STATEFP |
2 |
String |
FIPS state code |
COUNTYFP |
3 |
String |
FIPS county code |
TLID |
10 |
Double |
Permanent edge ID |
TFIDL |
10 |
Double |
Permanent face ID (left) |
TFIDR |
10 |
Double |
Permanent face ID (right) |
MTFCC |
5 |
String |
MAF/TIGER Feature Class Code |
FIDELITY |
1 |
String |
Indication to a respondent when their entity boundary has changed through spatial enhancement |
FULLNAME |
40 |
String |
Decoded feature name with abbreviated qualifier, direction, and feature type |
SMID |
22 |
String |
Spatial Theta ID |
SMIDTYPE |
1 |
String |
SMIDTYPE code |
BBSPFLG |
1 |
String |
Redistricting data project participant’s submitted request of an EDGE for selection as a block boundary |
CBBFLG |
1 |
String |
Indicates the status of an EDGE for a selection as a block boundary |
BBSP_2020 |
1 |
String |
New BBSP flag |
CHNG_TYPE |
4 |
String |
Type of linear feature update |
JUSTIFY |
150 |
String |
Justification of change |
LTOADD |
10 |
String |
Left To address |
RTOADD |
10 |
String |
Right To address |
LFROMADD |
10 |
String |
Left From address |
RFROMADD |
10 |
String |
Right From address |
ZIPL |
5 |
String |
Left zip code |
ZIPR |
5 |
String |
Right zip code |
EXTTYP |
1 |
Char |
Extension type |
MTUPDATE |
10 |
Date |
Date of last update to the edge |
ATTRIBUTE FIELD |
LENGTH |
TYPE |
DESCRIPTION |
OID |
8 |
STRING |
Object ID |
TLID |
22 |
Integer |
TIGER Line ID |
STATEFP |
2 |
String |
FIPS State Code |
COUNTYFP |
3 |
String |
FIPS County Code |
FROMHN |
12 |
String |
From House Number |
TOHN |
12 |
String |
To House Number |
SIDE |
1 |
String |
Side Indicator Flag |
ZIP |
5 |
String |
5-digit ZIP Code |
PLUS4 |
4 |
String |
ZIP+4 Code |
LFROMADD |
10 |
String |
Left From Address |
LTOADD |
10 |
String |
Left To Address |
RFROMADD |
10 |
String |
Right From Address |
RTOADD |
10 |
String |
Right To Address |
ZIPL |
5 |
String |
Left 5-digit ZIP Code |
ZIPR |
5 |
String |
Right 5-digit ZIP Code |
ZIP4L |
4 |
String |
Left ZIP+4 Code |
ZIP4R |
4 |
String |
Right ZIP+4 Code |
Table 58: Address Ranges Attribute File (PVS_18_v2_addr)
Table 59: Census Block Shapefile (PVS_18_v2_tabblock2010)
ATTRIBUTE FIELD |
LENGTH |
TYPE |
DESCRIPTION |
BLKSZIND |
1 |
String |
Block Size Indicator |
BLOCK |
4 |
String |
Block Number |
BLOCKCE |
4 |
String |
Tabulation Block Number |
BLOCKID |
15 |
String |
FIPS State Code, FIPS County Code, Census Tract Code, Block Number |
COUNTYFP |
3 |
String |
Census County FIPS code |
COUNTYFP10 |
3 |
String |
FIPS County Code |
FID |
10 |
Integer |
Permanent Face ID |
NCELIGBLE |
1 |
String |
New Construction Program eligible |
PARTFLG |
1 |
String |
Part Flag Indicator |
Shape |
7 |
String |
Type of shape |
STATEFP |
2 |
String |
Census state FIPS code |
STATEFP10 |
2 |
String |
FIPS State Code |
SUFFIX1CE |
2 |
String |
Census Block Suffix 1 |
SUFFIX2CE |
2 |
String |
Census Block Suffix 2 |
TRACTCE10 |
6 |
String |
Census tract code |
ATTRIBUTE FIELD |
LENGTH |
TYPE |
DESCRIPTION |
CHNG_TYPE |
2 |
String |
Type of area update |
COUNTYFP |
3 |
String |
FIPS County Code |
EFF_DATE |
8 |
String |
Effective Date or Vintage |
FID |
10 |
Integer |
Permanent Face ID |
JUSTIFY |
150 |
Char |
Justification |
NAME |
100 |
String |
Name |
NEW_CODE |
2 |
String |
New Congressional District Code |
RELATE |
120 |
String |
Relationship Description |
Shape |
7 |
String |
Type of shape |
STATEFP |
2 |
String |
FIPS State Code |
TRACTCE |
6 |
String |
Census Tract Code |
TRACTID |
11 |
String |
FIPS State Code, FIPS County Code, Census Tract Code |
TRACTLABEL |
7 |
String |
Tract number used for LUCA geocoding |
TRACTTYP |
1 |
String |
Tract Characteristic Flag |
VINTAGE |
2 |
String |
Vintage updated with returned data |
Table 60: Census Tract Shapefile (PVS_18_v2_curtracts)
Table 61: American Indian Areas Shapefile (PVS_18_v2_aial)
ATTRIBUTE FIELD |
LENGTH |
TYPE |
DESCRIPTION |
AIANNHCE |
4 |
String |
Census AIANNH Code |
AIANNHFSR |
1 |
String |
Flag Indicating Level of Recognition of an AIA |
AIANNHNS |
8 |
String |
ANSI numeric identifier for AIA areas |
AREA |
10 |
Double |
Acreage of Area Update |
AUTHTYPE |
1 |
String |
Authorization Type (O – Ordinance, R – Resolution, L – Local Law, S – State Level Action, X – Other) |
CHNG_TYPE |
2 |
String |
Type of Area Update |
CLASSFP |
2 |
String |
FIPS 55 Class Code Describing an Entity |
COMPTYP |
1 |
String |
Indicates if Reservation, Trust Land, or both are Present |
COUNTYFP |
3 |
String |
FIPS County Code |
DOCU |
120 |
String |
Supporting Documentation |
EFF_DATE |
8 |
Date |
Effective Date |
FID |
10 |
Integer |
Permanent Face ID |
FORM_ID |
4 |
String |
(MTPS and Web BAS Only) |
FUNCSTAT |
1 |
String |
Functional Status |
JUSTIFY |
150 |
Char |
Justification |
LSAD |
2 |
String |
Legal / Statistical Area Description |
NAME |
100 |
String |
AIA name |
NAMELSAD |
100 |
String |
Name with Translated LSAD |
PARTFLG |
1 |
String |
Part Flag Indicator |
RELATE |
120 |
String |
Relationship description |
SHAPE |
7 |
String |
Type of shape |
STATEFP |
2 |
String |
FIPS State Code |
VINTAGE |
2 |
String |
Vintage of the Data |
Table 62: County and Equivalent Areas Shapefile (PVS_18_v2_county)
ATTRIBUTE FIELD |
LENGTH |
TYPE |
DESCRIPTION |
STATEFP |
2 |
String |
FIPS state code |
COUNTYFP |
3 |
String |
FIPS county code |
COUNTYNS |
8 |
String |
ANSI feature code for the county or equivalent feature |
NAMELSAD |
100 |
String |
Name with translated LSAD code |
LSAD |
2 |
String |
Legal/Statistical Area Description code |
FUNCSTAT |
1 |
String |
Functional status |
CLASSFP |
2 |
String |
FIPS 55 class code describing an entity |
CHNG_TYPE |
2 |
String |
Type of area update |
EFF_DATE |
8 |
Date |
Effective date or vintage |
AUTHTYPE |
1 |
String |
Authorization type (O – Ordinance, R – Resolution, L – Local Law, S – State Level Action, X – Other) |
DOCU |
120 |
String |
Supporting documentation |
FORM_ID |
4 |
String |
Record ID (GUPS only) |
AREA |
10 |
Double |
Area of update |
RELATE |
120 |
String |
Relationship description |
JUSTIFY |
150 |
String |
Justification of change |
NAME |
100 |
String |
Entity name |
VINTAGE |
2 |
String |
Vintage of the data |
Table 63: County Subdivisions Shapefile (PVS_18_v2_mcd)
ATTRIBUTE FIELD |
LENGTH |
TYPE |
DESCRIPTION |
STATEFP |
2 |
String |
FIPS state code |
COUNTYFP |
3 |
String |
FIPS county code |
COUSUBFP |
5 |
String |
FIPS 55 county subdivision code |
NAMELSAD |
100 |
String |
Name with translated LSAD |
COUSUBNS |
8 |
String |
ANSI feature code for the county subdivision |
LSAD |
2 |
String |
Legal/Statistical Area Description |
FUNCSTAT |
1 |
String |
Functional status |
CLASSFP |
2 |
String |
FIPS 55 class code describing an entity |
CHNG_TYPE |
2 |
String |
Type of area update |
EFF_DATE |
8 |
Date |
Effective date or vintage |
AUTHTYPE |
1 |
String |
Authorization type (O – Ordinance, R – Resolution, L – Local Law, S – State Level Action, X – Other) |
DOCU |
120 |
String |
Supporting documentation |
FORM_ID |
4 |
String |
Record ID (GUPS only) |
AREA |
10 |
Double |
Area of update |
RELATE |
120 |
String |
Relationship description |
JUSTIFY |
150 |
String |
Justification of change |
NAME |
100 |
String |
Entity name |
VINTAGE |
2 |
String |
Vintage of the data |
Table 64: Incorporated Place Shapefile (PVS_18_v2_place)
ATTRIBUTE FIELD |
LENGTH |
TYPE |
DESCRIPTION |
STATEFP |
2 |
String |
FIPS state code |
COUNTYFP |
3 |
String |
FIPS county code |
PLACEFP |
5 |
String |
FIPS 55 place code |
NAMELSAD |
100 |
String |
Name with translated LSAD |
PLACENS |
8 |
String |
ANSI feature code for the place |
LSAD |
2 |
String |
Legal / Statistical Area Description |
FUNCSTAT |
1 |
String |
Functional status |
CLASSFP |
2 |
String |
FIPS 55 class code describing and entity |
PARTFLG |
1 |
String |
Indicates if only part of a feature is represented |
CHNG_TYPE |
2 |
String |
Type of area update |
EFF_DATE |
8 |
Date |
Effective date or vintage |
AUTHTYPE |
1 |
String |
Authorization type (O – Ordinance, R – Resolution, L – Local Law, S – State Level Action, X – Other) |
DOCU |
120 |
String |
Supporting documentation |
FORM_ID |
4 |
String |
Record ID (GUPS only) |
AREA |
10 |
Double |
Area of update |
RELATE |
120 |
String |
Relationship description |
JUSTIFY |
150 |
String |
Justification of change |
NAME |
100 |
String |
Entity name |
VINTAGE |
2 |
String |
Vintage of the data |
| File Type | application/vnd.openxmlformats-officedocument.wordprocessingml.document |
| File Title | BAS_GUPS_Respondent_Guide |
| Author | Jill Darlene Snider (CENSUS/GEO CTR) |
| File Modified | 0000-00-00 |
| File Created | 2021-01-20 |
© 2026 OMB.report | Privacy Policy
 Quality
Control and File Submission