M. Nonresponse Bias Analysis (2017 Nyts)
M_Nonresponse Analysis_2017NYTS.docx
National Youth Tobacco Surveys (NYTS) 2015-2017
M. NONRESPONSE BIAS ANALYSIS (2017 NYTS)
OMB: 0920-0621
Submitted
to:
Nonresponse
Bias Analysis
2017
National Youth Tobacco Survey


Division
of Adolescent and School Health
Centers for Disease Control and
Prevention
November 2017
Kate
Flint, Ronaldo Iachan, Alice Roberts, Lee Harding, Yangyang Deng ICF
Table of Contents
Section 2. School-Level Nonresponse 3
Figure 1. Historical NYTS Participation Rates 3
2.2 Association with School Characteristics 4
Table 1a. Definitions of Primary Characteristics Used for Nonresponse Analysis 4
Table 1b. Definitions of Secondary Characteristics Used for Nonresponse Analysis 5
Table 2. School Participation Rates by Census Region 5
Table 3. School Participation Rates by School Type 6
Table 4. School Participation Rates by School Size 6
Table 5. School Participation Rates by Urban Status 7
Table 6. Secondary Characteristics Assessed for Nonresponse Analysis 7
Section 3. School Participation by Student Population Characteristics 8
Table 7. Definitions of Student Population Characteristics Used for Nonresponse Analysis 8
Table 8. Student Population Characteristics Used for Nonresponse Analysis 9
Section 4. Modeling Participation Rates 10
Section 5. Item Nonresponse 11
Table 9. Distribution of the Percentage of Item Nonresponse by Questionnaire Section 12
This report assesses the response rates and potential nonresponse bias associated with the 2017 National Youth Tobacco Study (NYTS). Nonresponse bias refers to the potential for systematic under-representation and consequent bias in survey estimates due to nonresponse. Nonresponse bias is a function of the amount of nonresponse and differences between the non-respondent and respondent subgroups with respect to characteristics estimated by the survey. The analysis of nonresponse bias can inform statistical adjustments to the response data, inform users about the representativeness of the data, change how institutions or individuals are recruited, and modify fielding procedures.
Consistent with previous years, the 2017 NYTS used a three-stage cluster sampling design to produce a nationally representative sample of students in middle (grades 6-8) and high (grades 9-12) schools who attend public and private schools. Briefly, primary sampling units (PSUs) were selected at the first stage, schools were selected at the second stage, and students were selected from intact classrooms at the third stage. For more information on the sampling design see the Methodology Report for the 2017 National Youth Tobacco Survey. Although nonresponse can occur at both the school and student level, the nonresponse analysis is based on school characteristics because the differences between participating and nonparticipating students cannot be measured through this survey. We also analyze aggregate demographic and socioeconomic characteristics of the student population available at the school level. Along with school and student nonresponse bias analysis, the 2017 nonresponse analysis also assesses the potential for item nonresponse bias.
The first step in the assessment of nonresponse bias is to determine whether nonresponse rates pose a potential problem overall or for certain population subgroups. High levels of nonresponse would indicate that more intensive efforts are needed to attain participation overall or for certain subgroups. Even in surveys where nonresponse does not reach these levels, efforts may be suggested to reduce or to adjust for the residual bias that may be induced by nonresponse. For the 2017 NYTS, these analyses were used to identify lower responding subgroups and compensate for potential nonresponse bias in the weighting process with the use of weighting class adjustments.
Section 2 of this report looks at the participation rates achieved in the 2017 NYTS survey in the context of historical participation rates at the student and school levels. Section 3 contrasts participating and non-participating schools along student population characteristics, such as racial/ethnic and socio-economic characteristics. Section 4 considers multiple regression models that assess the independent effects of these school and student population characteristics on school participation. Section 5 assesses the level of item nonresponse across NYTS survey questions. This section is followed by a brief conclusion.
Section 2. School-Level Nonresponse
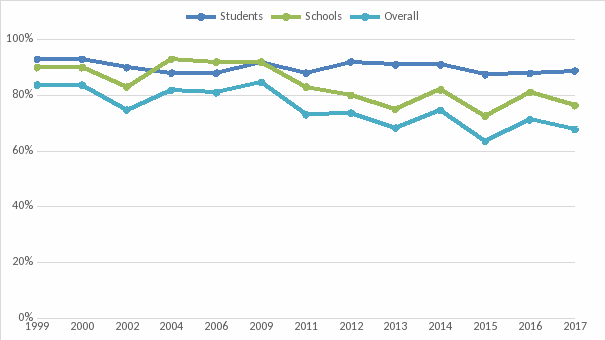
The final 2017 NYTS sample consisted of 241 schools, of which 185 participated, for a school participation rate of 76.8%.[1] The survey yielded 17,872 completed student questionnaires out of a sample of 20,144 students for a student participation rate of 88.7%. Among the nonresponding students, 113 students refused to participate, 789 students’ parents refused to allow their student to participate and 85 students failed to return permission forms (from schools using an active parental permission form). The remaining 1,983 nonresponding students were classified as other non-takers. The overall participation rate, the product of the school-level and student-level participation rates, was 68.1%.
As shown in Figure 1, the overall participation rate for the 2017 survey was lower than the rate achieved in the 2016 NYTS and both the school (76.8%) and student (88.7%) participation rates are still lower than historical averages from 1999-2016 (84% and 90%, respectively).
These figures suggest a downward trend in school participation rates, from the low 90% range in 2006 to the 70% range observed during the 2017 cycle. Previous nonresponse bias analysis reports suggests that this drop is due to declining response rates among non-public schools, but that data quality was not compromised. Similar to the pervious cycles, non-public schools responded at a significantly lower rate than public schools during the 2017 cycle (56.0% and 78.8%, respectively). There was no statistical difference in school response by school level, High Schools (78.2%) participated at about the same rate as Middle Schools (75.0%) in 2017.
Figure 1. Historical NYTS Participation Rates
In this section, responding and nonresponding schools are compared on a variety of dimensions that may be relevant for determining the potential for nonresponse bias. Results are shown over the past 3 survey years to assess trends and for historical comparisons.
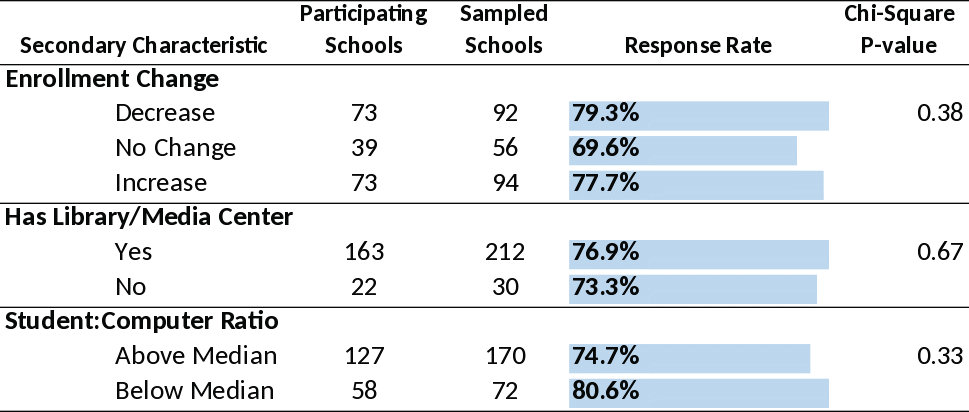
An important question for data interpretation is whether schools that participated in the NYTS are systematically different from non-participating schools based on characteristics that may be relevant to survey outcomes. To answer this question, several characteristics available for both participating and non-participating schools were compared. In addition to the primary characteristics presented in Table 1a, as an exploratory analysis we also assessed potential differences by enrollment change, the presence of a library or media center, and the student to computer ratio (Table 1b).
Table 1a. Definitions of Primary Characteristics Used for Nonresponse Analysis
School Characteristics |
|
Census Region |
The Census region in which each school is located: Northeast (CT, MA, ME, NH, NJ, NY, PA, RI, and VT), Midwest (IA, IL, IN, MI, MN, MO, ND, NE, OH, SD, and WI), South (AL, AR, DC, DE, FL, GA, KY, LA, MD, MS, NC, OK, SC, TN, TX, VA, and WV), or West (AK, AZ, CA, CO, HI, ID, KS, MT, NM, NV, OR, UT, WA, and WY).
|
School Type |
This classification collapses a three-category “control” variable (Public, Private, and Catholic) into a two category variable (Public and Non-Public) by combining private and Catholic schools.
|
School Size |
Large schools have an estimated enrollment of 28 students or more at each grade. Small schools have an estimated enrollment fewer than 28 students at any grade. This is the same classification used for stratification of the NYTS sample schools. These data come from the NCES and MDR databases used for sample design and weighting.
|
Urban Status |
Urban schools are those within one of the 54 largest MSAs in the U.S., and rural schools are those outside these areas. This is the same classification used for stratification of the NYTS sample schools.
|
Table 1b. Definitions of Secondary Characteristics Used for Nonresponse Analysis
School Characteristics |
|
Enrollment Change |
School enrollment decreased, increased or remained the same from the previous school year. |
Library/Media Center |
School has a library or media center (Yes/No) |
Student: Computer Ratio |
Ratio of number of students to number of computers (Above/Below Median) |
Table 2 compares school participation rates by Census region. This table shows that participation was not significantly different across Census regions during the 2017 cycle. The previous two cycles had some variation in school participation rates across Census regions. It is worth noting that the total numbers of sample and participating schools may vary slightly across tables due to missing data for the classification variables.
Table 2. School Participation Rates by Census Region
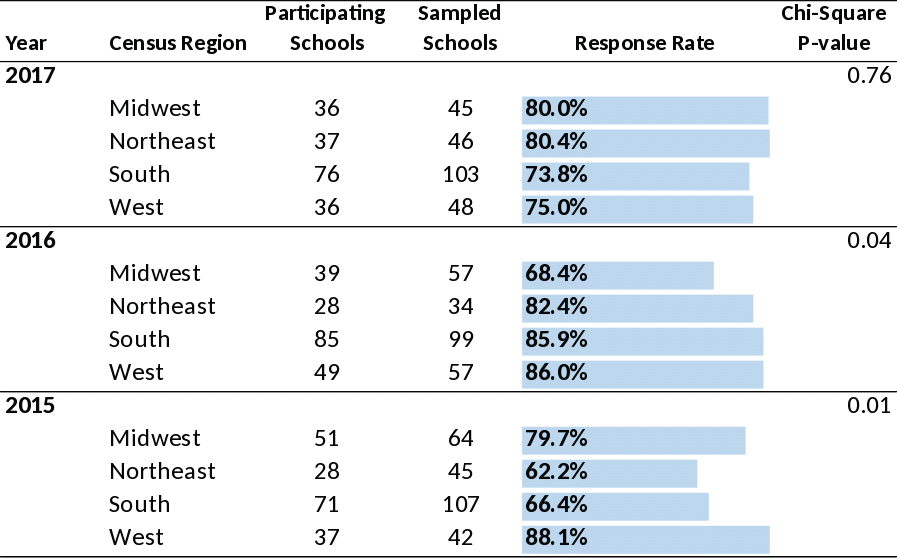
Table 3 compares school participation rates by school type (public vs. non-public). The table show that school participation rates are consistently and significantly higher for public schools compared to non-public schools. While 78.8% of public schools participated in the 2017 NYTS, only 56% of non-public schools participated. However, non-public schools comprise about 10% of the total school sample and have a small impact on participation rates overall.
Table 3. School Participation Rates by School Type
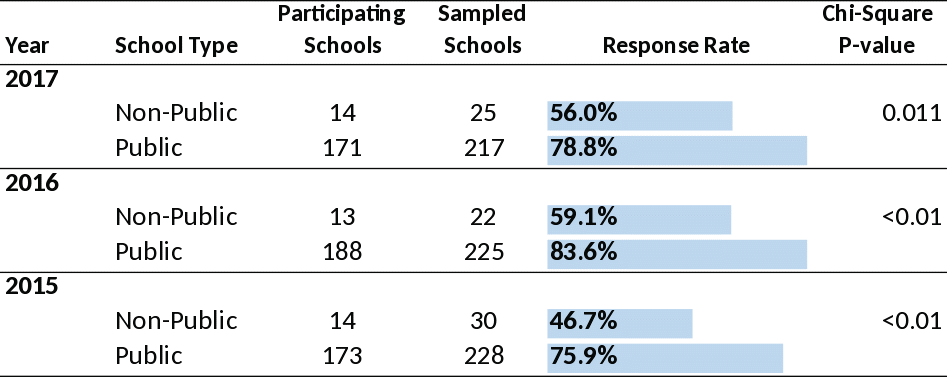
Table 4 compares school participation rates by school size (large vs. small). During the previous two survey years, participation rates tended to be higher in large schools compared to small schools. However during the 2017 survey cycle, school size was not a significant predictor of school response
Table 4. School Participation Rates by School Size
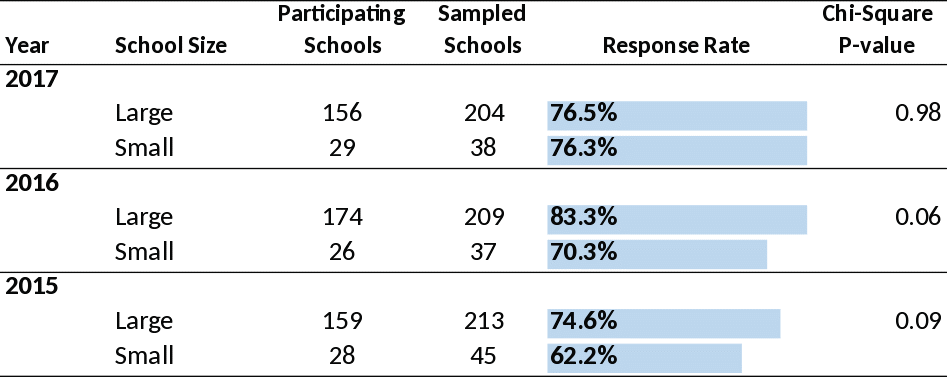
Table 5 compares school participation rates by urban status (urban vs. non-urban). Similar to the 2016 cycle, urban status was not statistically significant in predicting school nonresponse in 2017.
Table 5. School Participation Rates by Urban Status
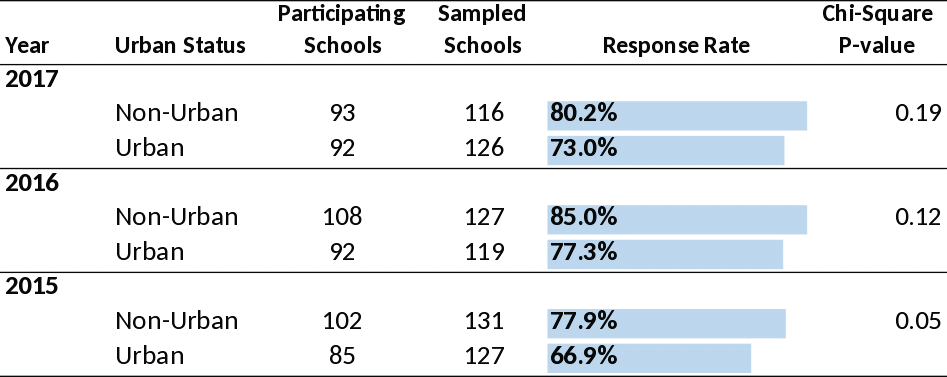
When we explored possible differences in other characteristics of the schools (enrollment change, library/media center, student-computer ratio), we did not find any significant differences in participation (Table 6).
Table 6. Secondary Characteristics Assessed for Nonresponse Analysis
Section 3. School Participation by Student Population Characteristics
As the incidence of many of the health and health risk behaviors measured by the NYTS correlates with race/ethnicity and socioeconomic status (SES), one protection against non-response bias is the assurance that participating schools do not differ from non-participating schools in terms of these basic demographic characteristics. Therefore, in addition to school characteristics, we assessed potential difference by the demographic characteristics of the student population. As mentioned above, because we do not have individual student characteristics for students that did not participate, we rely on the aggregate student population statistics at the school level. This section compares the racial/ethnic and socioeconomic composition of student populations between participating and nonparticipating schools. While the measurement of SES is a complicated endeavor, we compared proxy measures of SES by participation status: per-student Title I spending, a school affluence indicator, percent receiving free lunch, and percent college-bound. The variables are described in Table 7.
Table 7. Definitions of Student Population Characteristics Used for Nonresponse Analysis
Student Population Characteristics |
|
School Percent Black |
The percentage of students in the school who are reported as black.
|
School Percent Hispanic |
The percentage of students in the school who are reported as Hispanic.
|
School Percent Asian |
The percentage of students in the school who are reported as Asian.
|
Per-Student Title I Spending |
Title I, Part A (Title I) of the Elementary and Secondary Education Act, as amended (ESEA) provides financial assistance to local educational agencies (LEAs) and schools with high numbers or high percentages of children from low-income families to help ensure that all children meet challenging state academic standards. Federal funds are currently allocated through four statutory formulas that are based primarily on Census poverty estimates and the cost of education in each state (U.S. Department of Education). |
School Affluence |
Supplied by MDR as a variable on the NYTS sampling frame, the Affluence Indicator is computed using a proprietary algorithm developed to rank a school’s socioeconomic status. The index augments the U. S. Census Bureau’s Socioeconomic Status* (SES) with a variety of data points including but not limited to: Instructional Expenditures per Pupil, Instructional Materials Expenditures, Student-to-Computer Ratio, Title I Percent of Students, Title I Funds, and Total Expenditures per Pupil. The result is a five category index, which was collapsed for the current analyses into three categories coded as: 1(Low/Below Average), 2 (Average), and 3 (Above Average/High). |
Free Lunch |
Percent of students in school receiving free or assisted meals |
School Percent College Bound |
Percent of students in the school reportedly going to college |
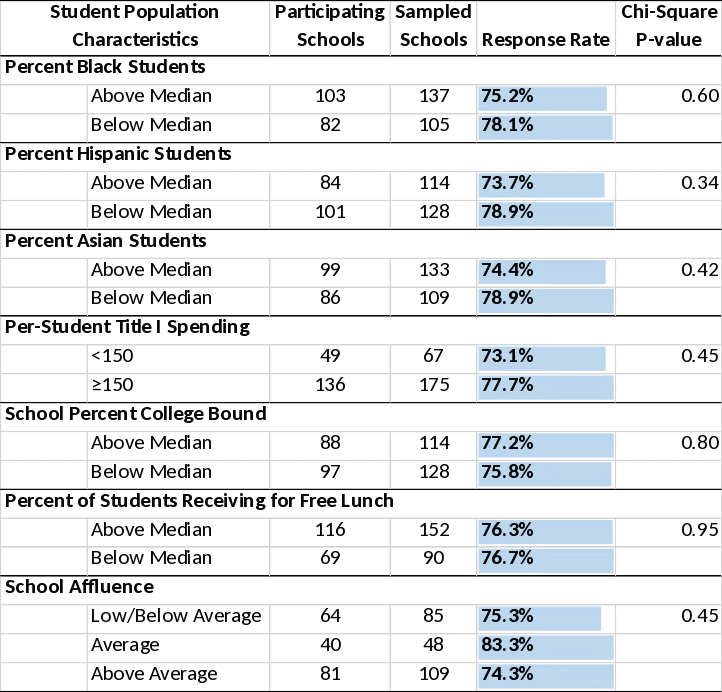
Table 8 compares participation by the selected racial/ethnic and SES variables. There were no significant differences by the racial/ethnic composition of the student population. By SES characteristics, there were no statistically significant results for per-student Title I spending, percent college bound, percent students receiving free lunch and school affluence.
Table 8. Student Population Characteristics Used for Nonresponse Analysis
Section 4. Modeling Participation Rates
During the recent NYTS cycles, the school nonresponse analysis and nonresponse adjustment methods were refined to minimize nonresponse bias potential. Previously the nonresponse analysis was conducted but the nonresponse adjustments used weighting class adjustment cells based on sampling strata. During the 2017 NYTS cycle, the nonresponse analysis was used to inform the creation of the nonresponse adjustment cells. This process is described in more detail in the 2017 NYTS Methods Report. The new method defines nonresponse adjustment cells in a more tailored and systematic approach stemming from the nonresponse analysis. Specifically, the definition of the most appropriate nonresponse adjustment weighting cells followed these steps:
Conduct bivariate analysis to identify key predictors of school nonresponse and student nonresponse;
Conduct multivariate logistic regression analysis, or response propensity models, including the subset of key predictors identified in #1 to identify significant predictors of nonresponse at both levels;
Develop nonresponse adjustment weighting cells based on the significant predictors while incorporating information about cell sizes and correlations between predictors.
During the 2017 cycle only school type (public versus non-public) was found to be predictive on nonresponse in the bivariate analysis (step 1). With only one predictive variable, multivariate analysis was not needed.
Nonresponse adjustment cells were created using school type and region. Because of the small number of sample non-public schools, they were included as their own category in the nonresponse adjustment cells.
Multivariate logistic regression models are typically developed to examine the independent effects of a range of school characteristics on school participation. Variables found to be significant predictors of nonresponse in the bivariate analysis are used in the multivariate logistic regression models.
Typically with multiple variables associated with school nonresponse, the subset of variables selected for defining weight adjustment cells is effectively reduced in two ways: a) by eliminating variables with high pairwise correlations, and b) limiting to variables and cells with adequate representation of participating schools. These steps were not needed in 2017 given that only school type was significant.
Item nonresponse occurs when individual survey respondents fail to provide data on particular questions. When item nonresponse is minimal, researchers typically ignore the item nonresponse during the analysis. As an initial assessment of the potential impact of item nonresponse, this section quantifies non-response in terms of the percentage of missing data on a particular question.
The percentage of missing was calculated differently for different types of questions. Missing was assessed as the cross tabulation for questions that were “mark all that apply” or “select one or more” like questions Q5a – Q5e “What race or races do you consider yourself?” If only Q5e was treated as an independent question the percentage of missing would be 41% but when considering all Q5 questions the percentage of missing drops to 8.9%. Questions with only one answer options were treated as unique questions. Overall the average percentage of missing data on all 2017 NYTS questions was 2.73%. There were two questions with higher percentages of missing. However, these items are not really survey questions, as they capture date of administration rather than behavioral data [i.e., month and day of the survey administration (27.31% and 30.01% missing, respectively)]. These two questions are not included in the analysis of item nonresponse.
Table 9 presents the distribution of item nonresponse across the sections of the NYTS questionnaire in the order they appear in the questionnaire. The table, which also includes calculated variables, shows the average, minimum and maximum of percent missing data in each section.1 The average item nonresponse among the questionnaire sections range from less than 1% missing (0.99 for cigarette smoking) to 4.9% missing (home experiences). The percentage of item nonresponse tends to increase in the later questionnaire sections.
Our analyses of potential bias due to item nonresponse also looked at the item nonresponse rates for key analytic subgroups. Appendix A presents item nonresponse rates for each item in the subgroups defined by school level (middle school and high school) and by race/ethnicity. Race/ethnicity subgroups were defined using the multiple race category and assigned respondents to four subgroups: Hispanics, Blacks, Whites and Other Race. The tables also include the standard error associated with the estimated nonresponse rate (or percentage missing data) and a chi-square test of association between item nonresponse and the subgroups.
We note that differential rates of item nonresponse would only lead to potential bias if the outcome measures also vary substantially by subgroup for those completing and those not completing the specific item or variable. For example, differential bias could occur for the estimated prevalence of ever smoking cigarettes only if all those conditions are observed: black students completing and not completing the item(s) have different prevalence, black students have different prevalence than other racial subgroups; and item nonresponse rates are significantly different for blacks and students of other races. We caution that given the large numbers of subgroup differences being tested, across all questionnaire items, significant differences may be found by chance. We advise using very low significance thresholds such as p< 0.01 or even < 0.001.
Table 9. Distribution of the Percentage of Item Nonresponse by Questionnaire Section
Questionnaire Section Headings |
Percentage of Item Nonresponse |
||
Minimum |
Average |
Maximum |
|
Demographics |
0.53 |
2.93 |
8.87 |
Smoking cigarettes |
0.54 |
0.99 |
1.61 |
Use of cigars, cigarillos or little cigars |
0.88 |
1.18 |
1.72 |
Use of chewing tobacco, snuff, or dip |
1.32 |
1.82 |
2.76 |
E-cigarettes |
1.08 |
1.76 |
5.60 |
Hookah use |
1.43 |
1.95 |
2.42 |
Other Tobacco |
2.29 |
2.44 |
2.58 |
Past 30 day use of any tobacco product |
2.24 |
2.24 |
2.24 |
Flavored tobacco products |
2.44 |
2.59 |
2.74 |
Urges to use tobacco products |
2.06 |
2.06 |
2.06 |
Quitting |
2.30 |
2.76 |
3.17 |
Getting tobacco products |
3.87 |
4.11 |
4.48 |
Issues related to tobacco |
3.10 |
3.34 |
3.49 |
Thoughts on tobacco products |
3.26 |
4.13 |
7.33 |
Tobacco Ads |
3.72 |
4.14 |
4.86 |
E-cigarette Ads |
4.39 |
4.85 |
5.06 |
Second hand smoke |
4.33 |
4.42 |
4.58 |
Second hand e-cigarette vapor |
4.54 |
4.54 |
4.54 |
Experiences at home |
4.60 |
4.89 |
5.09 |
Calculated Variables |
0.53 |
2.84 |
8.87 |
Section 6. Conclusion
Nonresponse bias is a function of two factors: a) the amount of nonresponse and b) differences between participants and non-participants in terms of characteristics measured by the survey. The present report examined nonresponse in the 2017 NYTS by school characteristics and student population demographic characteristics. The nonresponse analysis identified differences in participation by school type. Importantly, the information learned from this analysis is applied to the weighting process with a nonresponse adjustment to reduce the impact on the final weighted data. The 2017 nonresponse adjustment used the variables school type (public versus non-public) and region.
The 2017 NYTS non-response weight adjustments used the regional variable (4 U.S. Census Regions) as a lesson learned from the 2016 NYTS data. For the 2016 data, some variables (e.g., use of e-cigarettes) showed some potential bias due to the combination of two factors:
Differential school response rates across regions
Differential outcomes (e-cig prevalence) across regions
Note that our non-response analyses generally look at the first type of differences but not at the second. Obviously, obtaining high levels of participation among schools and students is the most important factor in minimizing potential bias from differential participation. Despite decreasing school participation since the early 2000’s, response rates at the school and student level in 2017 both remained above 70%.
With regard to school-level nonresponse, consistent with previous cycles, school type (public vs. non-public) was associated with school participation in the bivariate analysis; public schools appear to be more likely to participate. Because private schools make up a small percentage of schools in the sample, this difference is unlikely to lead to potential biases. To mitigate against such potential biases, school non-response adjustments take into account school type and school size. By student population characteristics, there were no differences by the racial/ethnic makeup of the students. In fact there were no statistically different findings for any of the student population characteristic in 2017.
Given that only one variable was found to be a statistically significant predictor of nonresponse in the bivariate analysis of the 2017 survey data, multivariate models were not necessary in the 2017 nonresponse analysis. The analyses also considered item nonresponse rates by section and by subgroup. Item nonresponse rates are very small and are not expected to lead to potential biases.
The current analysis found some evidence of differential nonresponse. National weighted estimates are not impacted in a meaningful way from nonresponse in the 2017 NYTS, however, because of the limited contribution of private schools to the sample, the adjustment for nonresponse in the weighting process, and a school response rate over 76%. The new methods used for school nonresponse weight adjustment linked to this nonresponse analysis help reduce the potential for bias due to these differences.
[1][1] The number of participating schools differs by one school from the number in the Sampling and Weighting Report due to one high school being considered as two sampling units in that report as it had separate 9th grade center.
1 Note that the section average is the mean of the percent missing across the items in the section. This may be distinguished from an average item nonresponse that could be computed by pooling the items within a section and looking at the aggregate missing data.
| File Type | application/vnd.openxmlformats-officedocument.wordprocessingml.document |
| File Title | Nonresponse Bias Analysis |
| Subject | 2017 National Youth Tobacco Survey |
| Author | Kate Flint, Ronaldo Iachan, Alice Roberts, Lee Harding, Yangyang |
| File Modified | 0000-00-00 |
| File Created | 2021-01-20 |
© 2026 OMB.report | Privacy Policy
