Supporting Statement B
SUPPORTING STATEMENT B.docx
Estimating the Economic Burden of Vibrio parahaemolyticus in Washington State Aquaculture
OMB: 0648-0787
SUPPORTING STATEMENT B
Estimating the Economic Burden of Vibrio parahaemolyticus in Washington State Aquaculture
OMB CONTROL NO. 0648-XXXX
COLLECTIONS OF INFORMATION EMPLOYING STATISTICAL METHODS
Describe (including numerical estimate) the potential respondent universe and any sampling or other respondent selection methods to be used. Data on the number of entities (e.g., establishments, State and local government units, households, or persons) in the universe covered by the collection and in the corresponding sample are to be provided in the tabular form for the universe as a whole and for each of the strata in the proposed sample. Indicate expected response rates for the collection as a whole. If the collection had been conducted previously, include the actual response rates achieved during the last collection.
From our project partners, we have developed a contact list of 90 growers, 18 managers (including project partners), and 20 restaurants. This is all oyster growers registered with either or both Pacific Coast Shellfish Growers Association or the Department of Natural Resources, all managers that deal with Vibrio as part of their job description, and all restaurants who have had Vibrio traceback investigations in the last year. We plan to include the whole respondent universe, and expect a 75% response rate based on previous interviews and surveys with a similar population (studies by Jonathan van Senten and Stephanie Moore, as described in part A, question 4). The universe will be divided as follows:
-
Managers
Washington State agencies
4 individuals, 2 agencies
County agencies
14 individuals, 6 counties
Growers
X-small (<10 acres)
55 individuals
Small (10 to <100 acres)
25 individuals
Medium (100 to <500 acres)
8 individuals
Large (>= 500 acres)
2 individuals
Restaurants/Retail
20 individuals
Describe the procedures for the collection of information including:
Statistical methodology for stratification and sample selection
Estimation procedure
Degree of accuracy needed for the purpose described in the justification
Unusual problems requiring specialized sampling procedures, and
Any use of periodic (less frequent than annual) data collection cycles to reduce burden
This collection will be a census because the overall target population is well-defined and small and a census rather than sampling will reduce sample bias.
The strata listed in question 1 mirror work by Jonathan van Senten and will be used to contextualize our findings in other regulatory and industry costs calculated as part of his study. The count per category among growers will also be confirmed by the first question in the interview, as farm size is under-reported in official documentation. This is also mirrors the Van Senten study, and was recommended by the Pacific Shellfish Growers Association as a preferred methodology. The strata also correspond to industry-relevant thresholds, each of which represents a scale of business requiring more training, equipment, and staff, which has implications for the costs associated with dealing with Vibrio. For example, an extra-small operation will have a single boat and is generally a two-person, household-based business, so costs would be restricted to a smaller set of possible purchases.
We understand that there are other ways that nonresponse bias may be introduced (for example, age of business or demographics of the respondents) but it is the one we are choosing to control for because the larger businesses are likely to have many more ways of responding to Vibrio. For example, they may have more equipment at hand to choose from, multiple oyster leases on which to place their crop or relay infected oysters in order to avoid bacterial growth, or enough distributors to choose from that one case won’t disrupt the product chain. Given our relatively small sample size, it is only practical to stratify along one metric in order to have enough respondents per category.
Describe methods to maximize response rates and to deal with issues of non-response. The accuracy and reliability of information collected must be shown to be adequate for intended uses. For collections based on sampling, a special justification must be provided for any collections that will not yield “reliable” data that can be generalized to the universe studied.
In order to maximize response rates, we are offering phone or in-person options for participation, which members of the respondent pool have told us are the preferred form of contact, so that they can continue with daily activities while answering questions. This flexibility has been shown to boost response rates in a variety of settings1. In addition, we will tell respondents the topics of the questions and that we will be asking about expenses so that they can adequately prepare beforehand, either by referencing purchase records or taking time to remember.
We are planning a census of the relevant population. For non-response cases, we will impute the average cost of their sampling strata. For example, if a medium-sized farmer does not participate, we will calculate that farm’s expenses based on the average costs for each expense category in the other medium-sized farms.
Describe any tests of procedures or methods to be undertaken. Testing is encouraged as an effective means of refining collection of information to minimize burden and improve utility. Tests must be approved if they call for answers to identical questions from 10 or more respondents. A proposed test or set of tests may be submitted for approval separately or in combination with the main collection of information.
We consulted with someone for each of the modules who works in that field as part of the interview guide creation process, performing the interview and then asking for feedback after completion. Two staff from the Phillips Wharf Environmental Center (who are part of a grower’s education program), one restaurant manager from a seafood restaurant, one former restaurant supplier, and one member of a surveillance program laboratory all reviewed the interview guide. Each suggested minor wording changes to the relevant portion of the interview guide, confirmed the timing was reasonable, and that the topic was relevant to current concerns.
Provide the names and telephone number of individuals consulted on statistical aspects of the design and the name of the agency unit, contractor(s), grantee(s), or other person(s) who will actually collect and/or analyze the information for the agency.
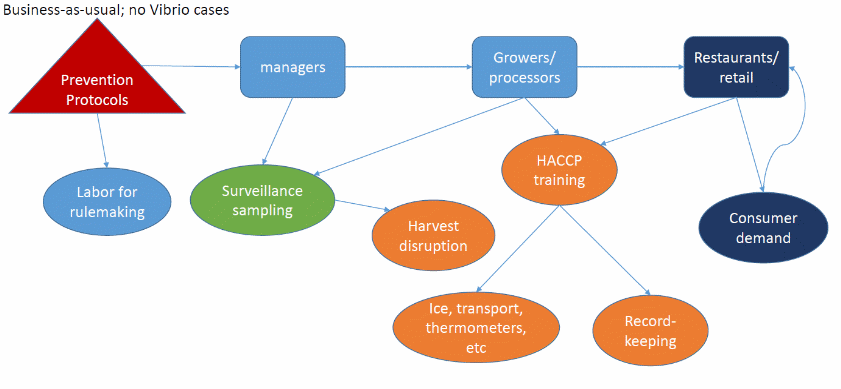
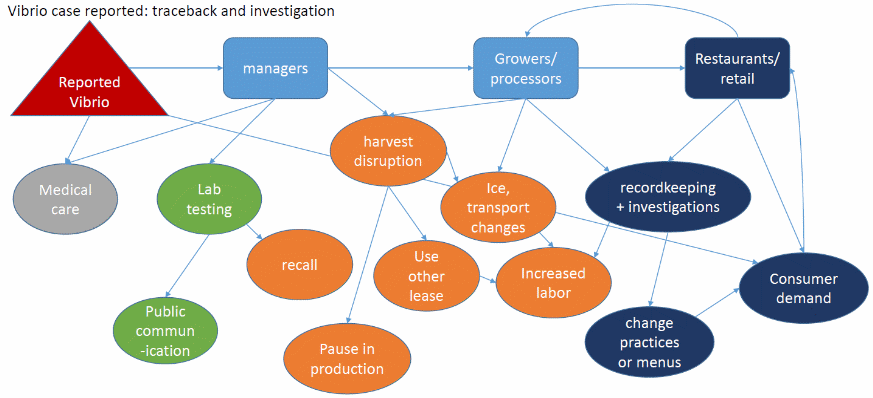
Our conceptual model of costs of Vibrio was thoroughly reviewed during a workshop at the 2018 Pacific Coast Shellfish Growers Association. We used a conceptual modeling approach because it is a good way for stakeholders from multiple sectors to put their ideas in a shared model2. The workshop was attended by about 40 people, including shellfish managers, growers, distributors, and researchers. We provided a draft model and facilitated a participatory model-building exercise to add components to the model and restructure it according to their perceptions of how costs are laid out. They suggested a two-part model to be able to compare the costs of a successful year of Vibrio management (i.e., no cases reported) with the costs of a year where a consumer gets sick with Vibrio. These completed models are shown in Figures 1 and 2; these are additive models.

Figure 1 Cost model part 1: daily prevention practices and expenses. Colors represent respondent pools: green is managers, orange is growers, dark blue is restaurants.

Figure 2 Cost model part 2: traceback and investigation when a Vibrio case reported. Colors represent respondent pools: gray is literature review, green is managers, orange is growers, dark blue is restaurants.
We had a number of NOAA project partners and social science team members each review the interview guide and conceptual model, including Leif Anderson, PhD (Northwest Fisheries Science Center), Chloe Fleming (NCCOS), Seann Regan (NCCOS), Jarrod Loerzel (NCCOS), Matt Gorstein (NCCOS), and Sarah Gonyo (NCCOS). Each suggested minor wording changes to questions, and splitting a few of the questions for easier understanding.
We also requested external review of the draft interview guide and this supporting statement by to methods experts. Jonathan van Senten, PhD (Virginia Tech, [email protected]) has direct experience with our desired respondent pool, as he has conducted a survey in the region on the economic burden of regulation. His review suggested a number of wording changes to help with specificity of answers as well as emphasizing the importance of the flexibility in the question order in order to accommodate non-sequential lines of thought. The second reviewer, Luke Fairbanks, PhD (Colorado State University, 774-644-1425), has a research portfolio focusing on aquaculture policy and economic development. His biggest overall comment was about the level of recall required for a few of the questions, and that a heads up that we’ll be asking such things might be useful in the invitation so they can be prepared. Other comments were about question specificity and possibly breaking them apart to be several, shorter, questions rather than one bigger one. Both thought expected burden seemed reasonable, given options for response format and promises of confidentiality.
The interviews will be conducted by the project team:
John Jacobs, PhD: NCCOS, Cooperative Oxford Laboratory
Amy Freitag, PhD: NCCOS, Biogeography Branch, CSS Inc.
Leif Anderson, PhD: Northwest Fisheries Science Center
TBD student under Leif Anderson, Northwest Fisheries Science Center
In order to ensure consistency across interviewers, we will follow the training protocol of the Northwest Fisheries Science Center (author Stephanie Moore) and have regular team check-ins to address issues as they arise and ensure consistent methodology over the course of the project. Leif will be the local point-person for questions that need addressing between check-ins. This same team will analyze the data, bringing in project partner Erika Atherly (Washington Department of Health).
1 De Leeuw, E. 2005. To Mix or Not to Mix Data Collection Modes in Surveys. Journal of Official Statistics 21(2): 233-255.
2 Freitag, A., H. Townsend, J. Vasslides. 2019. Are you thinking what I’m thinking? A conceptual modeling approach to understand stakeholders’ assessment of the fate of Chesapeake Oysters. Marine Policy 99: 99-110.
| File Type | application/vnd.openxmlformats-officedocument.wordprocessingml.document |
| Author | Adrienne Thomas |
| File Modified | 0000-00-00 |
| File Created | 2021-01-20 |
© 2026 OMB.report | Privacy Policy