Part B - Speeding education 20200828_Revised
Part B - Speeding education 20200828_Revised.docx
Effects of Education on Speeding Behavior
OMB: 2127-0747
Information Collection Request Supporting Statement: Section B
Effects of Education on Speeding Behavior
Abstract: The National Highway Traffic Safety Administration (NHTSA) of the U.S. Department of Transportation is seeking approval to collect information from licensed drivers who were recently cited for speeding for a one-time, voluntary study of the effects of an education course on speeding behavior. NHTSA proposes to approach up to 500 drivers appearing at the Wake County, NC district court because of speeding infractions to ascertain their interest in participating in the study after their case has been adjudicated. Wake County, NC was chosen because of the contractor’s knowledge of the area and district court procedures. Of the 500 drivers, we expect to collect information from 300 potential participants to determine their eligibility for the study with the goal of recruiting 200 voluntary participants. Participants will be randomly assigned so that half will be in the experimental group, which receives the education course, and half will be in the control group that does not receive the training. The 200 participants will complete an informed consent form and a sensation-seeking questionnaire to measure psychological factors related to risky behaviors. Participants will also complete driver speeding questionnaires at the beginning, middle, and end of the study to explore any changes in their attitudes and beliefs regarding speeding as well as their self-reported tendency to speed during the study period. The experimental group will also complete a course evaluation after taking the training course. The sensation-seeking questionnaire will be used as a control in predicting speeding behaviors as sensation-seeking has been related to speeding in the past. In addition, NHTSA will collect naturalistic driving data, which involves unobtrusive observation of driving in a natural, on-road setting using a vehicle instrumented with position, speed, and other sensors. This collection is solely reporting to the research team, and there are no record-keeping costs to the respondents. NHTSA will use the information to produce a technical report that presents the results of the study. The technical report will provide aggregate (summary) statistics and tables as well as the results of statistical analysis of the information, but it will not include any personal information. The technical report will be shared with State highway offices, local governments, and those who develop driver education and traffic safety communications that aim to reduce speed-related crashes. The technical report will also be available to the public. The total estimated burden for recruiting: for approaching 500 participants to describe study (83 hours), for screening 300 participants (45 hours) and for 200 participants to complete the study (842 hours) is 969 total hours.
B.1. Describe the potential respondent universe and any sampling or other respondent selection to be used.
The objective of this data collection is to explore the effects of a driver education course about vehicle speeds, laws, and speeding risks for improving driver knowledge and changing driver attitudes and behaviors, including reducing post-education speeding recidivism. The study will gather a complete set of data from up to 200 adult (age 18 or older) participants who recently received a speeding citation but were not diverted to a traffic school or an education course involving speeding. The participants will be randomly assigned to either an experimental or a control group and further divided into two subgroups based on age (younger vs. more experienced adult drivers). A speeding education course that takes up to 3.5 hours will be used in this study. The study follows a basic before-and-after design with a control. Data will be collected for one month before the drivers in the experimental group take the education course. Following the education course, data will be collected for another month. Differences between the before/after periods in terms of the amount of speeding will be tested to assess effects of the education course. We will collect data on the drivers in the control group for the same two-month period as the experimental group, but the control group will not take the training course.
The potential respondent universe is licensed adult drivers that attend traffic court in Wake County, North Carolina who recently received a speeding citation. The primary criterion for site selection for this project was finding a local jurisdiction within a State that was willing to work with the research team to recruit drivers. The sample will be screened to include only adults who: (a) drive often enough to provide sufficient driving data for the study, (b) have a valid driver’s license and are fully insured, (c) have a primary vehicle that only they drive most of the time, and (d) were attending court for a recent speeding citation. This population will not generalize to the entire driving population, but this study is a pilot study to examine the effects of targeted speeding education and to learn more about the target group, speeders. Drivers who are currently taking or plan on taking driving education courses will be excluded. The study aims to recruit a sample that will be evenly divided between younger drivers (18-39) and older drivers (40+). While speeders do tend to be younger, there are many older drivers that also speed and pose the same risks to themselves and other road users, therefore, we will examine both younger and older age cohorts in this study of known speeders. As this is a pilot study and we have a limited sample size, and because NHTSA’s recently published analysis of SHRP2 naturalistic driving speeding data (Richard, et al., 2020) showed only a small and insignificant difference per gender, we will not stratify the sampling by gender in this study. Based on the results of this study, however, we will consider including gender as a factor for any follow-up studies.
Given that the typical number of violators in the Wake County Traffic Court ranges from 200 to 500 per day, the recruitment period is expected to last 3-4 weeks to enroll 200 participants. Based on similar recruiting efforts, the recruiters expect to describe the study to 500 people to find 300 people interested in participating and who complete the screening questionnaire to find 200 eligible people for the study.
B.2. Describe the procedures for the collection of information.
After responding to the screening questionnaire to determine their eligibility, selected participants will go through the Informed Consent Process to learn about the study procedure and potential risks. They will go through the Informed Consent Process at the courthouse or set up a separate visit based on their schedule. The consent process will include requesting participant permission and information to obtain the participant’s driving record. Following this, participants will complete questionnaires about their attitudes, beliefs, knowledge, and behaviors regarding speeding while researchers install the Data Acquisition System (DAS) in their vehicle. Participants will then drive as they normally would for two months, while the DAS passively records the vehicle speed during all trips.
After the first month, participants in the experimental group will go to the research facility to attend the speeding education course. After finishing the course, participants will complete an education course evaluation questionnaire. Participants will then resume driving as they normally would for one more month (the post-intervention period), while the DAS continues to passively record the vehicle speed during all trips. Participants in the control group will drive for two continuous months without taking the education course.
Finally, two months after beginning the study, participants will return to the study facility so that researchers can remove the DAS from the vehicle. During this time, participants will complete the questionnaire on attitudes, beliefs, knowledge, and behaviors regarding speeding for the second and last time. They will also complete questionnaires about personality traits (e.g., sensation seeking) that may be associated with speeding. The sensation seeking instrument has proven to be a consistent measure that does not vary much over time for respondents, therefore, we will only conduct this measure once during the study. It will be placed at the end of the data collection to better balance the time required for the information being collected at the initial and closing data collection points to reduce the burden on respondents. After completion of the equipment removal and questionnaires, participants will be debriefed about the study before being dismissed.
All data will be protected as confidential according to IRB requirements and best practices for protecting participant information. Participant contact information will be retained only for the duration of the study and used to schedule facility visits and provide appointment reminders. Contact information will be stored separately from study data and destroyed after study completion.
Driving data will be processed to create a reduced data set for analysis. The data will be cleaned
to mitigate noise in the data, detect and repair errors and missing values, and de-identify any PII, such as trip origins or destinations. De-identification will be accomplished by linking all output data to a participant ID number and removing name and other directly identifiable information from the dataset. The cleaned data will be reduced into a form that can be efficiently analyzed.
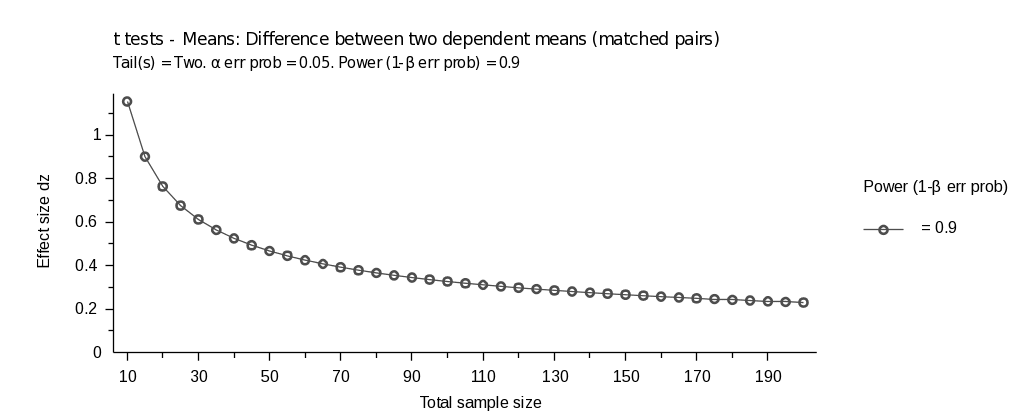
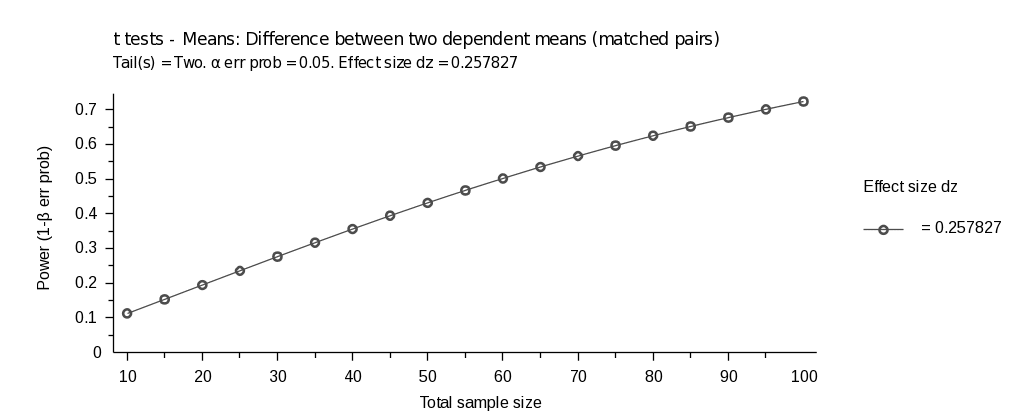
For the purpose of the power analysis, we are assuming 200 enrolled participants will yield 160 analyzable cases after accounting for attrition and data loss. A statistician conducted two power analyses to estimate effect sizes required for the t-test that will be used to answer the primary research objective. Each power analysis estimated sample size, effect size, and statistical power based on the indicated assumptions. Note that since the sample size was predetermined, the statistician conducted a “sensitivity” power analysis, which is used when the sample size is constrained, instead of “a priori” power analysis which computes sample size given alpha, power, and effect size. Therefore, Figures 1 and 2 should be interpreted as indicating the size of effect that the analysis could detect given the expected sample size for the pilot study.
To address the primary research question about overall effects of the education course, the analysis would involve a two-tailed, paired t-test to examine the difference in mean outcome measures between treatment and control groups. At a significance level of 0.05 and a desired power of 0.9, a study with 160 participants is expected to be sensitive to detect an effect size of approximately 0.26 (Faul, Erdfelder, Buchner, & Lang, 2009) (See Figure 1 and Figure 2).

Figure 1. Range of effect sizes as a function of total sample size for a paired t-test.

Figure 2. Range of statistical power as a function of total sample size for a paired t-test.
The experimental design (see Table 1) has two between-subjects factors: Treatment Group (2 levels, Treatment vs. Control) and Age Group (2 levels, Young vs. Old). The number of participants will be counterbalanced among all four resulting groups (see Table 1).
Table 1. Experimental design including treatment (training) and control groups.
Treatment Group |
Age Group |
N Participants |
Treatment |
Younger |
40 |
Control |
Younger |
40 |
Treatment |
Older |
40 |
Control |
Older |
40 |
Total: |
160 |
|
The participants in the Control group will not be administered the speeding education training, but they will be measured using the same pre-/post-criteria as the participants in the Treatment Group. To test if there is a post-treatment difference between the Treatment and Control groups, and to test if Age Group mediates the observed performance before and after treatment, we will conduct a between-subjects, repeated measures ANOVA.
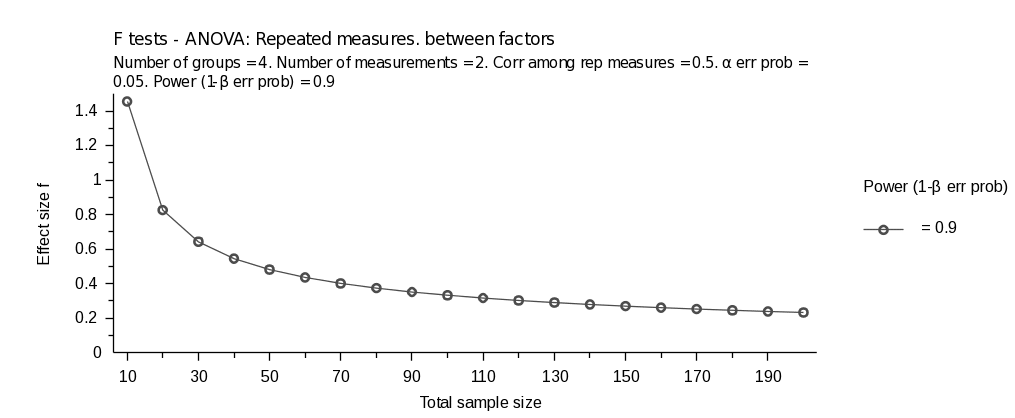
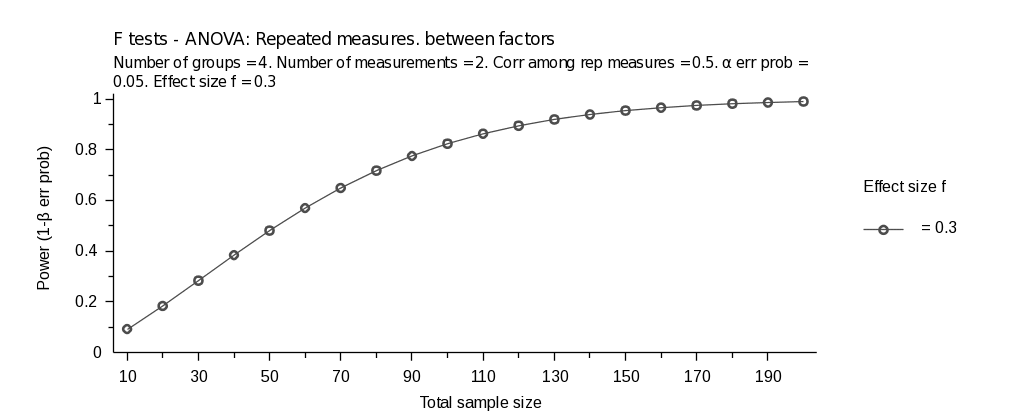
The power analysis conducted based on this experimental design indicates that a total sample size of 160 participants is sufficient to provide us with power of 0.9, assuming a low-medium effect size of f=0.3 (Figure 1). The power analysis was performed using the G* Power application (Faul, Erdfelder, Buchner, & Lang, 2009) and corroborated using the WebPower package in R (Zhang & Yuan, 2018). Figure 3 and Figure 4 plot the detectable effect size and the expected power as functions of the sample size, and desired power or assumed effect size, respectively

Figure 3. Detectable effect size as a function of total sample size for a repeated measure, between-factors ANOVA at desired power of 0.9.

Figure 4. Expected statistical power as a function of total sample size for a repeated measure, between-factors ANOVA with an assumed low-medium effect size of 0.3.
B.3. Describe methods to maximize response rates.
To increase the efficiency of the before and after comparison, it is important to maximize the number of regular speeders enrolled in the study. We addressed this challenge by analyzing previously-obtained SHRP2 naturalistic driving study (NDS) data related to speeding. These data are comparable to data that will be collected in the current study, and they were used to identify predictors of speeding based on demographic characteristics and responses to certain questionnaire items.
Following a previous approach (Richard et al., Under Review), the current study will segment individual trips into two different units—Free-Flow Episodes and Speeding Episodes—and will use these as key measures for drivers’ speeding behavior. Free-Flow Episodes (FFEs) represent when the vehicle is traveling fast enough that the speed could plausibly represent the driver’s chosen speed for those roadway conditions. Speeding Episodes (SEs) represent when the vehicle is traveling fast enough relative to the Posted Speed Limit (PSL) to be classified as speeding (e.g., 10 mph above the PSL). Table 2 shows North Carolina (NC) drivers’ trip and SE summary statistics from a previous study using SHRP2 NDS data (Richard et al., Under Review). The previous study sampled a subset of trips that had a high proportion of travel on high-speed roads. In this sample, individual drivers in NC averaged around 88 trips and their averaged trip duration was 20 minutes (=1,200 seconds). Average speed above PSL in NC was around 13.65 mph.
Table 2. SHRP2 NDS Trip/SE summary for North Carolina (Source: Richard et al., Under Review)
Total Trips Obtained |
33,666 |
Mean Trips per Driver |
87.90 |
Mean Trip Duration (sec) |
1204.70 |
Mean Availability of PSL Data (%) |
75.7 |
Mean Number of SEs per trip |
0.28 |
Mean SE Duration (sec) |
64.55 |
Mean SE Speed (mph) |
71.36 |
Mean SE Speed over PSL (mph) |
13.65 |
Mean of Maximum Speed over PSL (mph) |
17.26 |
To estimate how many speeding events can be collected within a one-month period in NC, the average number of trips, FFEs, and SEs per driver were calculated using various grouping methods (see Table 3). In the previous study (Richard et al., 2020), “speeders” were classified by using their driving data (e.g., time spent on each speeding type and FFEs). Note that the SHRP2 study used a sample of trips not the actual number of trips taken. Thus, to estimate the measures, the statistician calculated SE and FFE rates on a per trip basis, and extrapolated to expected numbers assuming that drivers took two trips per day. Applying this approach to the SHRP2 data indicated that during the first two-month period, NC drivers would average 28.8 SEs in the first 60 days (i.e., 120 trips). Younger drivers’ (16-24 years old) statistics were similar to the entire sample. “Speeders”—drivers classified as either “long-duration speeders” or “high speeders”—showed relatively more frequent SEs compared to other groups. Younger drivers within the “Speeder” group showed a lower SE count compared to general “Speeders,” but a higher SE count compared to other samples. The bottom parts of Table 2 show the same statistics from the second two-month period to examine potential changes after the first month. While overall patterns are consistent between the two periods, an increased number of SEs was observed, especially from “Speeders” and young “Speeders.”
Table 3. Average number of trip/FFE/SE per driver in SHRP2 North Carolina data (Richard et al., Under Review).
Days in study (1-60) |
||||||
|
All drivers (n = 326) |
Female drivers (n = 179) |
Male drivers (n = 146) |
Young drivers (n = 138) |
Speeders (n = 45) |
Young speeders (n = 26) |
Number of trips |
17.92 |
17.71 |
18.26 |
16.78 |
16.87 |
14.31 |
Number of FFEs |
53.66 |
53.84 |
53.71 |
51.65 |
45.31 |
38.01 |
Number of SEs |
4.26 |
4.63 |
3.83 |
4.51 |
13.2 |
9.85 |
SEs per trip |
0.24 |
0.26 |
0.21 |
0.27 |
0.78 |
0.69 |
Estimated number of FFEs within 60 days |
359.33 |
364.81 |
352.97 |
369.37 |
322.30 |
318.74 |
Estimated number of SEs within 60 days* |
28.8 |
31.2 |
25.2 |
32.4 |
93.6 |
82.8 |
* Assuming an average of two trips per day Days in study (61-120) |
||||||
|
All drivers (n = 335) |
Female drivers (n = 175) |
Male drivers (n = 159) |
Young drivers (n = 138) |
Speeders (n = 44) |
Young speeders (n = 25) |
Number of trips |
15.5 |
15.59 |
15.47 |
14.95 |
16.34 |
14.92 |
Number of FFEs |
48.42 |
49.42 |
47.56 |
46.74 |
44.39 |
39.64 |
Number of SEs |
4.69 |
4.52 |
4.90 |
4.86 |
14.89 |
12.2 |
FFE-trip ratio |
3.12 |
3.17 |
3.07 |
3.13 |
2.72 |
2.66 |
SE-trip ratio |
0.30 |
0.29 |
0.32 |
0.33 |
0.91 |
0.82 |
Estimated number of FFEs within 60 days |
374.86 |
380.40 |
368.92 |
375.17 |
326.00 |
318.82 |
Estimated number of SEs within 60 days |
36.31 |
34.79 |
38.01 |
39.01 |
109.35 |
98.12 |
* Assuming an average of two trips per day
The results suggest that recruiting regular “speeders” will be important for maximizing the number of speeding episodes during the study. Collecting and analyzing participants’ driving data before determining enrollment in the study is not feasible for the current sampling approach. However, the SHRP2 study also revealed that drivers with violations/crashes in past three years were more likely to be classified as “speeders” (Richard et al., 2020). In this respect, the current sampling approach (i.e., recruiting drivers from the court) should have higher probability of sampling regular speeders because of the recruiting requirement to have at least one previous speeding citation.
Participant compensation will also be structured so that it incentivizes participant to complete data collection steps. This strategy will involve providing payments at key milestones (including the enrollment visit) and is based on the compensation approach that we implemented at the WA site of the SHRP2 NDS study.
B.4. Describe any tests of procedure or methods to be undertaken.
Table 4 shows some of the main research questions of interest and the analysis approaches the research team will use to formally test each question. For example, to address the primary research question about whether participants who take the speeding education course have fewer speeding episodes (or smaller magnitude of speeding exceedance) after the education course compared to before taking the course, the research team will use paired t-test to examine the longitudinal difference using speeding data. A similar analytic approach will be applied to participant responses to the questionnaire about attitudes, beliefs, knowledge, and behaviors regarding speeding, which will repeatedly collect participant responses to see if their responses change at different periods relative to taking the training course.
The research team will also examine magnitude of differences in the amount of speeding between pre- and post-training periods by applying independent means t-test for the two age groups. This will test whether the effect of speeding course vary across the age groups. Also, a multivariate regression model using driver characteristic data (demographic and personality attributes) will be applied to predict the magnitude of pre/post-training differences in the amount of speeding.
Table 4. Main research questions and statistical tests for each question.
Research Questions |
Population |
Dependent Variable |
Independent Variables |
Analysis Method |
Data Source |
Does taking a speeding course decrease speeding? |
All participants (N = 80+) |
Proportion of speeding episodes, number of speeding episodes, speed exceedance |
Within-subjects: time period (pre-training vs. post-training) |
Paired t-test,
|
Speeding data
|
Does effect of speeding course vary across the age group? |
All participants (N = 80+) |
Changes in proportion of speeding episodes, number of speeding episodes, speed exceedance |
Between-subjects: Age group (younger group vs. older group) |
Repeated measures ANOVA |
Speeding data
|
Does taking a speeding course change self-reported driving/speeding behavior? |
All participants (N = 80+) |
Self-reported driving/speeding behavior |
Within-subjects: time period (pre-training vs. post-training) |
Paired t-test |
Primary questionnaire (driving/speeding behavior, knowledge of speeding and stopping distance) |
Which driver characteristics are associated with greater effect of training? |
All participants (N = 80+) |
Magnitude of the pre/post-training differences in the amount of speeding |
Between-subjects: driver characteristics (education, sex, sensation seeking, violation, etc.) |
Multivariate regression |
Enrollment questionnaire (demographic information), Driver attribute questionnaires (SSS, DBQ) |
B.5 Provide the names and telephone numbers of individuals consulted on statistical aspects of the design.
Stacy Jeleniewski, Ph.D.
NHTSA Project Manager / COR
Research Psychologist
National Highway Traffic Safety Administration
1200 New Jersey Ave SE, W46-491
Washington, DC 20590
E-mail: [email protected]
Randolph Atkins, Ph.D.
NHTSA Program Manager
Chief, Behavioral Research Division
National Highway Traffic Safety Administration
1200 New Jersey Ave SE, W46-307
Washington, DC 20590
(202) 366-5597
E-mail: [email protected]
Christian Richard, Ph.D.
Principal Investigator (Contractor)
Senior Research Scientist
Battelle Center for Human Performance and Safety
1100 Dexter Avenue N., Suite 350
Seattle, Washington 98109-3598
Phone: (206) 528-3249
E-mail: [email protected]
Joonbum Lee, Ph.D.
Principal Investigator (Contractor)
Research Scientist
Battelle Center for Human Performance and Safety
1100 Dexter Avenue N., Suite 350
Seattle, Washington 98109-3598
Phone: (206) 528-3152
E-mail: [email protected]
References
Faul, F., Erdfelder, E., Buchner, A., & Lang, A.G. (2009). Statistical power analyses using G*Power 3.1: Tests for correlation and regression analyses. Behavior Research Methods, 41, 1149-1160.
Richard, C. M., Joonbum, L., Brown, J. L., & Landgraf, A. (2020, January). Analysis of SHRP2
speeding data (Report No. DOT HS 812 858). Washington, DC: National Highway Traffic Safety Administration.
Zhang, Z., & Yuan, K.-H. (2018). Practical Statistical Power Analysis Using Webpower and R (Eds). Granger, IN: ISDSA Press.
| File Type | application/vnd.openxmlformats-officedocument.wordprocessingml.document |
| Author | Jessica Cicchino |
| File Modified | 0000-00-00 |
| File Created | 2021-01-14 |
© 2026 OMB.report | Privacy Policy