1 - Emergency Supply Kits_SSB_20210108
1 - Emergency Supply Kits_SSB_20210108.docx
Availability, Use, and Public Health Impact of Emergency Supply Kits among Disaster-Affected Populations
OMB: 0920-1344
Supporting Statement B: Emergency Supply Kits
Availability, Use, and Public Health Impact of Emergency Supply Kits among Disaster-Affected Populations
OMB Control No. 0920-NEW
New
Supporting Statement Part B
Title: Epidemiologist
Phone: 770.488.3422
Email: [email protected]
Fax: 770.488.3450
Date: 8 January 2021
Table of Contents
B.1. Respondent Universe and Sampling Methods 3
B.2. Procedures for the Collection of Information 7
B.3. Methods to Maximize Response Rates and Deal with No Response 10
B.4. Test of Procedures or Methods to be Undertaken 10
B.1. Respondent Universe and Sampling Methods
Respondents includes residents of a house that is within the community or geographic area that recently experienced a natural disaster. The respondent can be any member of the household who is 18 years and older and living in the selected areas at the time of the disaster. Participants will provide survey data that describe disaster‐related experiences among all household members.
Inclusion of Pregnant Woman – Adult respondents can be pregnant and participate in the survey. We do not anticipate any harm to the pregnant mother or her fetus when completing the survey.
We will select a city or county impacted by a disaster based on the following criteria:
Continental United States ‐ Issues with infrastructure, language, and administrative clearance can impede study design and execution. In addition, the standard emergency supply kit recommendations are largely for the general population of the continental United States and do not account for unique circumstances that may extend the length of time before response efforts are in place, such as being on an island. Site selection will therefore be limited to the contiguous United States for generalizability.
Type of Disaster – Site selection is limited to natural disasters that put the general population of a well‐defined geographical area at risk as opposed to human‐induced disasters (i.e., technological, terrorism) which tend to affect more defined groups such as employees or passersby. Natural disasters include all types of severe weather that have the potential to pose a significant threat to human health and safety, property, critical infrastructure, and homeland security.1 Using this definition will include winter storms, floods, tornados, hurricanes, wildfires, earthquakes, or any combination thereof.
Declaration of Disaster ‐ Emergency management in the United States begins at the local level, then moves up through county, state, and federal governments. A disaster declaration is a formal statement by a jurisdiction’s chief public official that a disaster or emergency exceeds their response capabilities. Disaster declarations are tailored to include only the areas impacted by the disaster. CDC will use the state‐level declaration as criteria for site selection because a governor will concurrently execute the region’s emergency plan, determine what local resources are committed to disaster relief, estimate the damage to public and private sector assets, and give an estimate of what resources are needed.2 Using this level as criteria will permit quicker site selection than waiting on federal approval for a governor’s request for assistance.
Population Affected ‐ CDC will examine estimated population affected in the declared disaster area as another criteria for site selection. Areas selected should have at least mid‐ to high‐density or a population of 100,000 people. The rationale for this recommendation is to strike a balance between including as many geographic locations for site selection as possible and ensuring that there is infrastructure in place as needed to analyze the experiences of the population affected. Operationally, this criterion will also assist with ensuring a robust sample for the cross‐sectional survey.
We will select survey participants via address‐based sampling (ABS) in the defined geographic area impacted by the disaster. Participants will have the choice to complete the survey via paper survey (Attachment 1) or online via a web‐based instrument (Attachment 2). The paper survey and online survey ask the same questions in the same order. Survey participants may also be recruited using an internet‐recruited, nonprobability web panel directed to the online, web‐based instrument to create a larger, more cost‐effective dataset if a panel is available (Attachment 3). Panel availability is not guaranteed because some geographic locations (e.g., rural areas) may not have enough web panel participants from which to draw. All recruitment language is written in plain language based on the introductory letter (Attachment 4). Focus group participants will be randomly selected among survey respondents and/or recruited via targeted social media (e.g., Facebook, Craigslist). Focus group participants will be tracked via a password-protected Microsoft Excel file completed and maintained by the RTI focus group task lead (Attachment 7C).
Selected households will receive a survey packet with instructions for the survey to be completed by an adult 18 years of age or older most aware of the household’s experience during the recent disaster. The survey packet will include the introductory letter (Attachment 4), informed consent (Attachment 5 or 5A) and the questionnaire (Attachment 1 or 2).
Study power. CDC will select two post‐disaster sites. Given the unpredictability of disaster occurrence, the survey will likely be in the field during different time periods (e.g., several months apart) and for different disasters. Each site will experience a unique set of circumstances. For this reason, we will analyze the data by site. The computation of a target number of completed interviews per site that balances costs and maximizes power to analyze the research questions related to efficacy of emergency supply kit usage (i.e., no difference in self‐sufficiency, no difference in exacerbation of health) necessitates a sample of 1,000 completed surveys per site (Figures 1‐3).
Since the proportion of emergency supply kit users can range widely and is unknown before site selection, alternate scenarios are presented in Figures 1‐3. To make these power calculations, the following assumptions are made:
The percent of sample members that will report emergency supply kit usage will range from 10% to 50% of the total sample,
Fifty percent of the population with an emergency supply kit is either “self‐sufficient” or has experienced “decreased symptoms” from a health condition. Setting the proportion to 50% is the most conservative estimate and it gives the greatest sample size, all other things being equal,
A detectable difference of 10%
The target sample is 1,000 (e.g. n1(ESK users) + n2(non‐ESK user) = 1,000), and
The ABS and web panel sample designs will be simple random sampling without clustering with a low design effect.
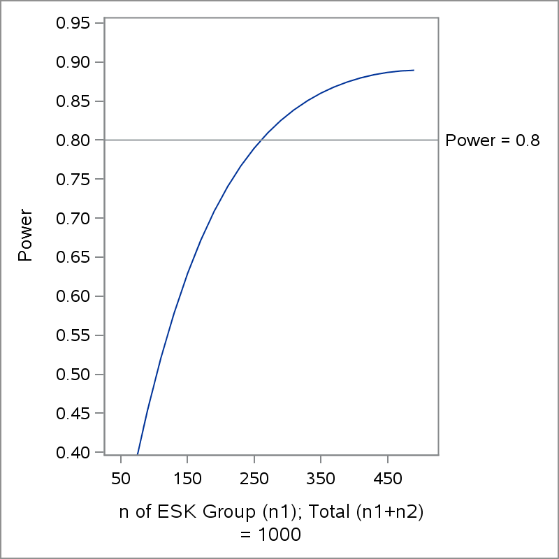
Figure B.1.1. shows the change in power as the sample size of the emergency supply kit group increases, with a total sample size of 1,000 respondents. Since we do not know the proportion of households with emergency supply kit use within a disaster zone, we estimate that to range from 10‐50%. Ideally, we desire a power of 0.8, which requires a sample comprised of approximately 27% who report emergency supply kit use (n1=265).
Figure B.1.1. Power Plots for Different Sample Sizes (n1) of Emergency Supply Kit (ESK) Use1
1 Assumes 50% Self-Sufficiency in ESK Group, Detecting 10% Difference
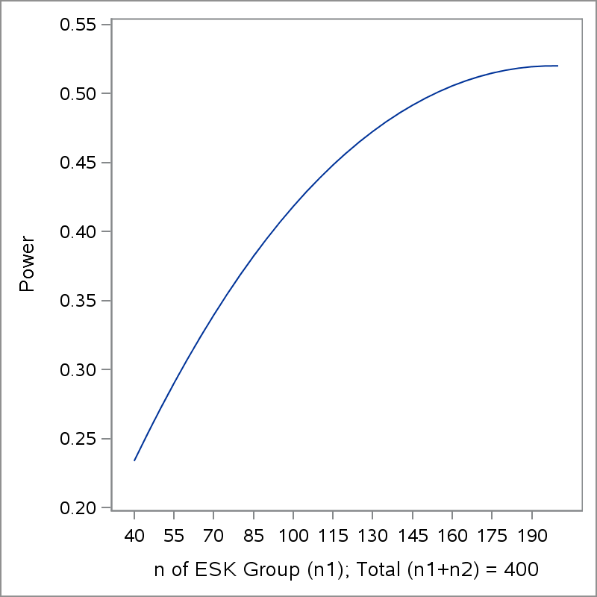
With regards to the reporting of pre‐disaster health conditions, a higher proportion of emergency supply kit users in the sampled subpopulation with a health condition will yield higher powered analyses. To demonstrate this, B.1.2 assumes 60% (.6 * 1,000 = 600) of the sampled population has a health condition and can be compared to Figure 3 which assumes 40% (.4 * 1,000 = 400). We selected these proportions for power analyses based on CDC estimates that 60% adults report at least one chronic health condition and 40% report two or more. Assuming similar proportions of emergency supply kit users ranges from 10 to 50%, in B.1.2. power ranges from
0.25 to 0.70, respectively. In Figure B.1.3, power is less than 0.4. Given power constraints, we will create an explanatory variable of chronic diseases for analyses that categorizes anyone who reports a pre‐disaster chronic condition as “yes” and others as “no”.
Figure B.1.2. Power Plots for Different Sample Sizes (n1) of Emergency Supply Kit Use, with 60% Prevalence of Health Condition in Sample
1 Assumes 50% Decreased Symptoms in ESK Group, Detecting 10% Difference
Figure B.1.3. Power Plots for Different Sample Sizes (n1) of Emergency Supply Kit Use, with 40% Prevalence of Health Condition in Sample
1 Assumes 50% Decreased Symptoms in ESK Group, Detecting 10% Difference
B.2. Procedures for the Collection of Information
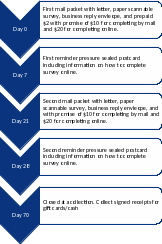
A concurrent dual-mode method will be employed for administration of the cross-sectional survey with additional incentive for the web-response to maximize response rates (Figure B.2.1). We will offer multiple mode options for response because one mode may be accessible to and preferable for most respondents while another may be more cost-effective or well-suited to provide high-quality data. For address-based-sampling surveys with paper and web options, respondents may prefer the straightforward task of responding to the survey using the paper instrument received in study packets, but the web-based mode reduces cost and takes advantage of the quality features built directly into the online instrument. Some research shows that most respondents select paper when provided a choice between paper and web surveys.4 However, research has also demonstrated that providing a differential monetary incentive for respondents to reply by web, will achieve a higher response rate overall and a majority responding by web rather than paper.
As illustrated in Figure B.2.1, multiple mailings include survey packets and reminder postcards (Attachment 6). A prepaid $2 incentive has been shown to improve response rates and will be used for this data collection. Differential incentives ($20 for web completion and $10 for paper completion), combined with the ease of utilizing a web‐based instrument, will also maximize response rates (see Incentives section). A careful analysis of non‐response will be completed using demographic and economic data available for addresses in the address‐based‐ sample so that participation bias can be assessed.
Figure B.2.1. Data collection flow for the cross-sectional survey includes options with differential monetary incentives over a 10-week data collection period

The paper mail survey is created and programmed using a TeleForm booklet and data capture system. TeleForm questionnaires will be processed by scanning to contain costs and eliminate error associated with manual data entry. Items in the questionnaire will be mostly closed-form questions that are easily machine readable and ideal for TeleForm. The web survey will be hosted on a web-based Voxco platform. We will thoroughly test both versions of the questionnaire before launch to ensure that the data collection process works smoothly, reducing the risk of delays during the data collection period. Table B.2.2 lists out the content areas in the cross-sectional survey instrument.
These survey methods may be augmented by also administering the survey to a sample from a nonprobability web-panel. However, without knowing exact survey locations until disaster occurrence, this option will only be considered if there are enough web panel participants from which to draw. For example, rural areas in the United States may have no web-panel participants, while larger counties may be several thousand from which to sample. Table B.2.2 lists out the content areas of the cross-sectional survey.
Table B.2.2. Survey Content Areas
Content Area |
# of Questions |
Analytical Purpose |
Screener |
4 |
Ensures adult with knowledge of household experience completes survey and that selected household was exposed to disaster |
Household type |
4 |
Characterizes household size and housing type |
Disaster impact on home |
6 |
Determines level of damage and loss of services to household during and shortly after disaster |
Household needs |
5 |
Collects information on items that were needed and/or available to household members at the time of the disaster |
Evacuation |
3 |
Collects information on whether household members needed to leave the home during the disaster and where they went |
Health needs |
35 |
Collects information at the household level (i.e., any household member, not just the participant) on symptoms of illness or injury during the first two weeks after the disaster; Also collect health status at the household level by type of chronic condition (e.g., heart disease in any household member) to determine whether medically-frail individuals lived in the household |
Preparedness |
12 |
Determines whether the household had ever discussed and/or implemented preparedness plans before disaster impact. Determines whether household created an emergency supply kit and what specific items were included in the kit. Collects additional information on knowledge, attitudes, and beliefs related to the importance of disaster preparedness and emergency supply kits as a method of self-sufficiency during disasters |
Prior exposure to natural disasters |
3 |
Collects information on whether household members ever experienced other disasters to determine whether this experience is associated with preparedness |
Demographics |
8 |
Collections information to assess generalizability and to use as potential confounders in tests of association |
Focus group participants will be randomly selected among survey respondents and/or recruited via targeted social media (e.g., Facebook, Craigslist) to provide context and enhancement to the survey (Attachment 7A).
B.3. Methods to Maximize Response Rates and Deal with No Response
The concurrent dual-mode method for the cross-sectional survey is designed to maximize response rates. As illustrated in Figure B.2.1, multiple mailings include survey packets and reminder postcards (Attachment 6). A prepaid $2 incentive has been shown to improve response rates and will be utilized for this data collection. Differential incentives ($20 for web completion and $10 for paper completion), combined with the ease of utilizing a web-based instrument, will also maximize response rates. A careful analysis of non-response will be completed using demographic and economic data available for addresses in the address-based-sample so that participation bias can be assessed.
B.4. Test of Procedures or Methods to be Undertaken
We conducted cognitive interviews on the survey with eight adult civilians who lived in New Hanover County, NC and had exposure to at least one recent severe hurricane (i.e., Hurricane Florence in 2017). Results from these cognitive testing indicated that respondents were able to understand their study rights and instructions for survey completion. Minor edits related to vocabulary were made from the original draft, but substantive content was not altered.
B.5. Individuals Consulted on Statistical Aspects and Individuals Collecting and/or Analyzing Data
Table B.4.1 External and internal consultations for this data collection.
Name |
Title |
Affiliation |
Phone |
|
Consultations outside the agency |
||||
Laura DiGrande |
Research Scientists |
RTI International |
917.583.5262 |
|
Stirling Cummings |
Research Statistician |
RTI International |
|
|
Consultations inside the agency |
||||
Stephanie Kieszak |
Statistician |
CDC National Center for Environmental Health |
770.488.3407 |
|
References
1. United States Department of Homeland Security (USDHS), Disasters https://www.dhs.gov/topic/disasters
2. Anda HH, Braithwaite S. EMS, Criteria for Disaster Declaration. StatPearls Publishing. https://www.dhs.gov/natural-disasters
3. Biemer P, Murphy J, Zimmer S, Berry C, Lewis K, Deng G. Choice+ Survey Protocol: White paper RTI International 2017 http://abs.rti.org/atlas/choice/paper
4. Biermer P, Murphy J, Zimmer S, Berry C, Deng G, Lewis K. A test of web/PAPI protocols and incentives for the Residential Energy Consumption Survey. Presented at the annual meeting of the American Association of Public Opinion Research, Austin, TX. 2016
http://www.aapor.org/AAPOR_Main/media/AnnualMeetingProceedings/2016/E6-5-Biemer.pdf
| File Type | application/vnd.openxmlformats-officedocument.wordprocessingml.document |
| Author | Richardson, Tony (CDC/OD/OADS) |
| File Modified | 0000-00-00 |
| File Created | 2021-02-14 |
© 2026 OMB.report | Privacy Policy


