Attachment B - Field Test Analysis
Attachment B - Field Test Analysis.docx
American Time Use Survey-Eating and Health Supplement
Attachment B - Field Test Analysis
OMB: 1220-0187
Maximizing Respondent Contact in the American Time Use Survey
Karen Piskurich, Dawn V. Nelson, DSD, U.S. Bureau of the Census, Room 3357-3, Washington, D.C., 20233-9150
Diane E. Herz, Bureau of Labor Statistics, 2 Massachusetts Avenue, N.E., Room 4675, Washington, DC, 20212
Key words: Time use, response rate, incentives, Priority Mail, experimental design
Overview
As the Bureau of Labor Statistics (BLS) and the US Census Bureau (Census) prepared to launch the new American Time Use Survey (ATUS), questions arose regarding expected response rates. Both the restrictive survey characteristics (e.g., the survey requires response by a designated person on a designated day of the week) and potential respondent unwillingness to provide a list of their daily activities presented concerns. Previous research sponsored by the BLS showed that both contact and response rates can be problematic in a telephone time-use survey. Assuming contacting the designated person and achieving high response rates remain the primary challenges, three independent field tests were designed to explore how best to maximize contact and to increase response rates. A variety of contact methods were incorporated into the three field tests: incentives, advance notification mailing options, mode of data collection, field duration, and calling strategies. In addition, the field test included the administration of a reduced time-use diary, in order to examine whether reporting daily activities leads to respondent breakoffs. This paper describes the field tests and discusses the findings and implications for the 2003 survey launch.
Introduction
In the United States, the Universities of Maryland and Michigan have done periodic studies on time use. However, the BLS survey will be the first continuous, federal survey on the subject. Time-use studies have also been done –or are about to be done—by statistical agencies in about 50 other countries, including Canada, Australia, and South Africa, among others.
The BLS' interest and involvement in time-use data collection began in 1991 when the Unremunerated Work Act was introduced to Congress and called for the BLS “to conduct time-use surveys of unremunerated work performed in the United States and to calculate the monetary value of such work.” The legislation was not made into law, but the BLS began to discuss the prospect of collecting such data.
In 1997, The BLS conducted a feasibility study with Westat to determine if a telephone time-use study could be used to measure nonmarket work activities. From this pilot study, the BLS learned that both contacting the designated person (DP) and securing response might be problematic. To address the contact issue, the study recommended researching a more robust call back strategy and a longer field period (Stinson et. al, 1998). The BLS began working with Census in the fall of 1999 to design and plan for production in 2003. The field tests described in this paper are the methods they explored to help maximize contact rates and ultimately response rates.
Purpose and Operations
Three separate field tests were designed. The tests were kept separate to keep cell sizes large enough to make comparisons between methodologies. The tests were run concurrently from April 23rd through June 24th , 2001. They together examined the impact of six contact methods:
Standard of mail (U.S. Priority Mail versus first class mail).
Number of eligible interviewing days per week (one versus two).
Proactive appointment setting (advance scheduling of interviews versus no advance scheduling).
Data collection duration (4 vs. 8 weeks)
Mode of data collection (telephone vs. in-person)
Incentives ($0, $20, $40, $60).
A secondary purpose of these tests was to determine if Current Population Survey (CPS) households for whom no telephone number was available could be induced to call into a Census telephone center to complete an interview. Field costs were unknown given the designated person/designated day contact protocol. Thus, it was possible that the BLS would not be able to afford field visits to each of these homes, perhaps requiring their exclusion from the ATUS sample. As an alternative protocol, one of the field tests examined whether these "non-telephone number" households could be encouraged to call in to the telephone center to complete the interview.
For the 3 tests, a sample frame of 3,396 cases was drawn from recently retired CPS sample. A total of 117 cases with incomplete names and/or addresses were purged from the sample file, with the final sample file containing 3,279 cases. The field test sample was purposefully concentrated in metropolitan areas of 8 of the Census Bureau’s 12 Regional Offices (ROs). However, the cases within the designated Primary Sampling Units were randomly selected. In each of the three tests, a designated person from each household was pre-selected, as were the days on which the designated person could be interviewed.
Use of retired CPS sample enabled more control over sample demographics and enabled greater demographic analysis than would a random digit dial (RDD) or similar sample. However, these cases were already interviewed 8 times in the prior 16 months, possibly leading to some respondents’ unwillingness to participate in another Census survey.
Each respondent received an advance letter package prior to the start of the field tests. It included a personalized cover letter introducing the survey and informing them of the day Census would be calling, an ATUS brochure, and, for incentive cases, an Automated Teller Machine (ATM) debit card enclosed in a mailer. Follow-up postcards were mailed to non-responders after the 2nd and 4th weeks of data collection.
Because the field tests were to be done only once, the BLS and Census decided against automating the questionnaire. The call scheduling for some of the contact protocols was different than for other surveys and could not use the existing call scheduler system. As a result, a paper and pencil questionnaire and a paper control system were used.
The paper questionnaire was designed to take approximately 15 minutes to administer, and included household address verification and a roster check, as well as a shorter time diary (8 hours: 4am-12 noon) than is planned for full production (4am to 4am). Several questions concerning absences from home, a respondent debriefing section, a respondent thank you section, and a very brief interviewer observation section followed. (Copies of the questionnaire are available upon request.)
The control system was comprised of several parts: a paper control card used by telephone interviewers and field representatives (FRs) to identify respondents' telephone numbers and addresses, and to record all call attempts; a paper tracking system used by the FRs and RO Supervisors to monitor the whereabouts of survey materials; and an electronic database used by the telephone center for case management and staffing.
Test Design
Taking into consideration what the BLS learned from the pilot study, an 8-week data collection period was used for all 3 tests.
Test 1
Test 1 focused on the use of incentives and of recycling cases to the field after 4 weeks in the telephone center. In addition to testing these methods, Test 1 cases were sent advance materials by Priority Mail and calls included Proactive Appointment Setting (PAS) which is described below for Test 2 (Abreau and Winters, 1999). (See Table 1 for sample cell sizes.)
The Office of Management and Budget (OMB) requires that incentives be tested before approving their use (Kirkendall, 1999). Test 1 incorporated three incentive levels- - $0, $20 and $40. ATM debit cards were mailed to the respondent with his or her advance letter. Personal Identification Numbers (PINs) to activate the cards were not given to respondents until after the interview was completed.
Table 1. Test 1 Design – Incentives and Recycling

Finally, all cases in Test 1 were assigned one eligible interviewing day (EID) per week. For instance, if the EID was Monday, April 23rd (about activities on designated day Sunday, April 22nd) and the respondent was not interviewed on the 23rd, their next EID was one week later, on Monday, April 30th.
Test 2
Test 2 focused on evaluating proactive appointment setting (PAS) and substitution contact strategies.
PAS was used to call a respondent on any day of the week to make an appointment to conduct the interview on the next eligible interviewing day. Because of the limited number of days to contact the Designated Person, PAS increased the chances of contacting the respondent. The counter method to PAS was calling a respondent only on an eligible interviewing day. This is called No-PAS.
Cases that used substitution had 2 eligible interviewing days (EID) per week while those without substitution had one EID per week. In Test 2, all interviews were done on Tuesday-Friday about Monday through Thursday. (See Table 2 for cell sizes.)
Table 2: PAS and Substitution

In addition to Substitution and PAS, advance letters were sent via regular first class mail. All Test 2 cases remained in the JTC for the 8-week interview period; i.e., there was no recycling of Test 2 cases to the field.
Test 3
To encourage non-telephone number households to call in, the most aggressive tactics were implemented. All advance materials were sent by Priority Mail, substitution was used, respondents could schedule an appointment to complete the interview at a later date (PAS) and respondents received a $60 debit card as an incentive. Finally, all unresolved cases were recycled to the field after 4 weeks.
In the advance letter, respondents were given a toll-free number to call the Census telephone center to set an appointment or to conduct the interview.
Findings
Test 1
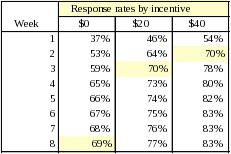
Of the original 1,896 cases in Test 1, 1,287 either completed the interview in its entirety or at least through the diary portion (sufficient partial interviews). Findings indicate that incentives increased response significantly: the response rate for no incentive cases was 69%, for $20 cases was 77% and for $40 cases was 83%. Incentives did not appear to affect demographic groups differently: those who completed the interview had similar profiles to the original cases, regardless of incentive group.
In the first 4 weeks of data collection, there was a substantial gain in response each week depending on incentive level. The gain in weeks 5-8 was small regardless of incentive level. The BLS 70% response rate target was reached in 2 weeks with $40 incentives, in 3 weeks at $20, and was not quite reached at 8 weeks with no incentive.
Table 3: Response Rate by Incentive Levels

Test 1 results showed that recycling cases to the field increases response rates. The response rate for cases that remained in JTC for all 8 weeks was 74%, versus 79% for cases that were recycled to the field after 4 weeks.
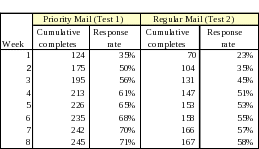
To analyze the effectiveness of using Priority Mail, cases were examined across Tests 1 and 2. Test 1 used PAS and did not use substitution, and respondents were interviewed all seven days of the week. To determine the effect of Priority Mail, only Test 1 cases that had EIDs Tuesday through Friday were compared to Test 2 PAS cases. From this comparison, it appears that priority mail had a significant, positive impact on response rates--71% when advance materials were sent by Priority Mail as opposed to 58% sent by regular mail.
T able
4: Response rates by mail type and weeks in the field
Test 2
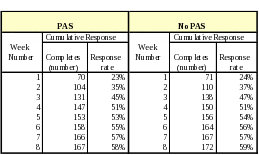
Of the 1,218 original cases in Test 2, there were 699 completes. Results showed that PAS did not increase response rates, but did increase cost. Costs are driven by call attempts, and PAS cases required 70% more calls than No-PAS cases. The average number of calls to complete a PAS case was 3.5 while the average number for No-PAS cases was 2.2.
Table 5: Cumulative Response Rates – PAS versus No PAS

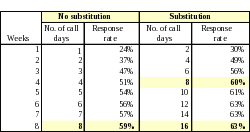
Test 2 results also showed that substitution slightly increases response rates. The effect appears to be due to the greater number of contact attempts when substitution is allowed. Response rates are equivalent after 8 attempts whether or not substitution was used. Substitution did affect the day of week on which people report: a disproportionately high number reported on Wednesday (31%) and a disproportionately low number reported on Friday (17%).
T able
6: Substitution response rates, by number of call days
Test 3
Among households for whom Census has no telephone number, response after 4 weeks in the call center was 41%. These respondents were induced to call in and complete the interview. After 4 additional weeks with field representatives visiting their homes, response increased to 83%.
Incentives probably affect response for these households as well as for those with telephones, but a test of this effect was not possible given the small numbers of such households in the sample. Members of these non-telephone number households were more likely to be black, to have less education and to have lower household incomes than those that provided telephone numbers (respondents in Tests 1 and 2).
In the respondent debriefing, 68% of these non-telephone number households reported that they had a working telephone. Of those reached in the field who had working telephones, 41% said they would do the interview by telephone. Some had not received the advance materials, and others had chosen not to call the toll-free number to complete the interview.
Respondent debriefing
It appears that respondents are willing to report their daily activities to the government. There were a minimal number of respondent breakoffs across all three tests – less than 1% (e.g., 13 for Test 2, 4 for Test 1 and 0 for Test 3.) An overwhelming majority of respondents, 92%, didn’t think the questions they were asked were too personal or too sensitive.
The survey allowed respondents to give an estimate of how much they think the government should pay people to do the survey. The most frequent response when asked “What is the smallest amount people should be paid to do this survey?” was $20. The most frequent response when asked “What is the most people should be paid to do this survey?” was $50. The choice of $40 incentives for non-telephone number households in full production was influenced by these results.
Discussion
To determine which methodologies to implement in the survey, each method's impact on response and cost was considered. Some methods were cost prohibitive to implement, while others fit within the ATUS budget. The following decisions were made and will be implemented pending OMB approval.
Standard of mail. Priority Mail appears to have had a substantial positive effect on response rates. It is relatively inexpensive to administer, particularly when compared to the costs of recycling and incentives. As a result, Priority Mail will be used for ATUS production.
Census FRs working in the New York office pointed out in a debriefing that several cases had not received their advance materials. They hypothesized that this was because the large priority mail envelopes did not fit into apartment mailboxes. Thus, letter-size envelopes may be used in ATUS full production.
Substitution. Cases that used the substitution methodology had twice as many EIDs on which to complete the interview. As mentioned previously, substitution increased overall response from 59% to 63% (in Test 2) after 8 weeks. However, substitution also negatively affected day-of-week representation of responses.
Allowing flexibility in reporting led to overreporting on Wednesday (about Tuesday) and underreporting on Friday (about Thursday). Costs of substitution were the same per-attempt as without substitution. Because of the negative affect on day-of-week representativeness, the BLS decided not to implement substitution in full production.
Proactive appointment setting. PAS--the advance scheduling interviews--did not increase response rates. In a debriefing, JTC interviewers indicated that some respondents used the technique to "string along" interviewers, but ultimately did not complete the interview. In addition, PAS cases required more calls per completed case, and were, therefore, more expensive. For these reasons, PAS will not be used in full production.
Mode of data collection. As has been found in other surveys, ATUS field Test 1 showed that recycling cases to the field led to higher response rates - 74% versus 79% after 8 weeks. Because the ATUS sample is small and therefore limits economies of scale in production, and because designated persons must be reached on pre-assigned days, the cost of recycling to the field was prohibitively high. As a result, all interviews will be done using telephone interviewing.
Incentives. Incentives significantly increased response at $20 and $40. And a $60 incentive induced 41% of the non-telephone-number households to call JTC and complete the interview. Providing incentives to all projected 2,000 interviews/month in full production is beyond the program budget.
Targeted incentives for nonrespondents were considered but rejected, as even at $40, the demographic composition of respondents appears to be the same as the overall demographic distribution of cases.
Because field visits were ruled out, and because there could be unobserved differences (such as time-use patterns) between those who did not provide phone numbers and those who did, a $40 debit card will be mailed with the advance letter to non-telephone number households. Respondents will receive the PIN after they complete the interview.
Data collection duration. The optimal field period length varied depending on whether an incentive was provided. Without an incentive, an 8-week period is needed to approach the 70% target response rate. Gains in response in weeks 5 through 8 are not large, but nor are they expensive. Only about one quarter of all calls is made during those weeks. In addition, new sample cases will be introduced in the first 4 weeks of every month during full production, so interviewer down time should not be problematic.
Table 7: Utilizing Methods - Field test versus Production
Method |
Field Test |
Production |
Standard of Mail |
Priority Mail & Regular Mail
|
Priority Mail |
Substitution |
Yes and No |
No |
PAS |
Yes and No |
No |
Data Collection Duration |
8 weeks |
8 Weeks |
Mode of Data Collection |
Telephone and In-person |
Telephone only |
Incentives |
$20, $40 for phone households $60 for "non-telephone number" households |
$40 for "non-telephone number" households only |
References
Abreu, D.; Winters, F. (1999). “Using Monetary Incentives to Reduce Attrition in the Survey of Income and Program Participation.” Proceeding of the American Statistical Association.
Butler, D; Greene, L.; McNeeley, M.; Montemarano, D; Groves, R.; Wissoker, D. (2000). “Mode Effects on Calling Efficiencies in Household Surveys.” Paper presented at AAPOR 2000.
Kirkendall, N. (1999) “Incentives – Perspective of OMB.” Presentation at Washington Statistical Society Seminar.
Mack, S.; Huggins, V.; Keathley, D.; Sundukchi, M. (1998 ). “Do Monetary Incentives Improve Response Rates in the Survey of Income and Program Participation?”. Proceedings of the American Statistical Association.
Singer, E.; Van Hoewyk, J.; Maher, M. (2000). “Experiments with Incentives in Telephone Surveys.” Public Opinion Quarterly 64:174-188.
Stinson, L.; Becher, K.; Forsyth, B.; Levin, K. (1998). “Using a Time-Use Approach to Measure the Frequency and Duration of Non-Market Work.” BLS Pilot Report.
| File Type | application/vnd.openxmlformats-officedocument.wordprocessingml.document |
| File Title | Maximizing Respondent Contact in the American Time Use Survey |
| Author | DSD |
| File Modified | 0000-00-00 |
| File Created | 2021-10-05 |
© 2026 OMB.report | Privacy Policy