Report: 50-50 Study of Two Questions on Sexual Orientation
ATT-D4-NSFG_ORIENT50-50study_Apr21.docx
National Survey of Family Growth
Report: 50-50 Study of Two Questions on Sexual Orientation
OMB: 0920-0314
NSFG OMB Attachment D4 OMB No. 0920-0314
Comparison of Sexual Orientation Distributions in 2015-2019 NSFG ACASI,
based on NSFG and NHIS Question Wording
This report was originally prepared based on 2015-2017 NSFG data, in response to one of the terms of OMB clearance received on 6/24/18 for our revision package, which was slated to expire 6/30/21. Due to the timing of our next NSFG data collection, after the award of a new 10-year contract in September 2020, we discontinued the prior clearance in April 2021 and are submitting a reinstatement package based on plans for the new data collection scheduled to begin in January 2021. As part of this reinstatement package, we have updated our prior analyses of the 50-50 sexual orientation question study using combined public-use data for 2015-2019 and the appropriate case weights and design variables for these four years of data.
Background
Since 2002, the NSFG has included a question on sexual orientation, asked for all male and female respondents aged 15-44 (and 15-49 since 2015) in the self-administered portion of the survey (Audio Computer-Assisted Self-Interview, or ACASI). Detailed reports on sexual behavior, sexual orientation and sexual attraction, based on NSFG data from 2002, 2006-2008, 2006-2010, and 2011-2013 have been published (Mosher et al., 2005; Chandra et al., 2011, 2012a; Copen et al., 2016). Other reports using NSFG data have examined sexual orientation as one of several correlates of other sexual and reproductive health related behaviors such as HIV testing, self-report of STI in lifetime and other STI/HIV risk behaviors, STI treatment, HPV vaccination, and contraceptive method type (Chandra et al., 2012b; Copen et al., 2015; Agénor et al, 2019; Paschen-Wolff et al., 2019. Porsch et al., 2020a; Porsch et al., 2020b).
Since a question on sexual orientation was first included in the NSFG ACASI in 2002, several changes have been made to the NSFG question wording to minimize response error – specifically to reduce item refusal and responses of “don’t know.” The 2002 question was patterned directly on the 1992 National Health and Social Life Survey, conducted by University of Chicago (Laumann et al. 1994), and basic statistics were published (Mosher et al., 2005). For reasons fully described in the technical notes of a prior NCHS report (Chandra et al., 2011), in 2006 more commonly known terms for sexual orientation were added to the response categories used in the 2002 NSFG. Instead of ‘‘heterosexual,’’ the response was changed to ‘‘heterosexual or straight’’ for both men and women. Similarly, instead of ‘‘homosexual,’’ men were offered ‘‘homosexual or gay,’’ and women were offered ‘‘homosexual, gay, or lesbian.” Furthermore in both 2002 NSFG and 2006-2008, respondents were given the option of responding “something else,” and in 2006-2008 respondents who chose this category received a follow-up question (“When you say ‘something else,’ what do you mean?”) where they typed in a verbatim response. The modification of category labels for heterosexual and homosexual was seen to significantly reduce the reporting of “something else” between 2002 and 2006-2008 (see Table I in Chandra et al., 2011), but no change was seen in the percentage that “did not report” sexual orientation (refusal or “don’t know” responses; see Table II in Chandra et al., 2011). Detailed analysis of the verbatim follow-up responses on the “something else” category in 2006-2008 showed that backcoding into existing categories was possible for 37 of 87 verbatim responses among women and 20 of 39 verbatim responses among men (see Table II). Also, this backcoding of “something else” verbatims did not significantly alter the percentage distribution by sexual orientation, perhaps due to the lower reporting of “something else” in 2006-2008, relative to 2002. Based on these results, the “something else” category and its follow-up verbatim question were deleted from the NSFG ACASI in July 2008.
Since the inclusion of a sexual orientation question in the National Health Interview Survey (NHIS) in 2013, there have been efforts to harmonize sexual orientation questions across NCHS surveys. After several years of cognitive and operational testing (Dahlhamer, 2014) the NHIS introduced a question on sexual orientation that was recommended as the NCHS-wide standard. NSFG was asked to adopt the NHIS question beginning in 2015, as part of our OMB renewal for 2015-2018 and also with our ERB protocol for 2015-2019 fieldwork. However, given the NSFG’s longer history of asking about sexual orientation in the ACASI mode and acknowledging that the recommended NHIS question was being asked by field interviewers, NCHS and OMB approved the inclusion of a 50-50 randomized study to compare the distributions of sexual orientation obtained using the two question approaches. Also, this 50-50 study permitted an assessment of the two questions in a similar placement in the questionnaire, that is, in the same position in ACASI after all sexual behavior items had been asked. This approach would potentially “equalize” any contextual effects seen when comparing NSFG and NHIS questions directly, as NHIS asks sexual orientation in an interviewer-administered format and much earlier in the interview. Over the course of NSFG fieldwork from September 2015 through September 2019, all NSFG ACASI respondents were randomized so that half would be asked the NSFG question and half would be asked the NHIS question for sexual orientation. The NSFG and NHIS questions are shown below, and they differ in the question stem and the order and wording of response categories offered:
NSFG question:
Do you think of yourself as ...
Heterosexual
or straight
Homosexual,
gay, or lesbian
Bisexual
NHIS question:
Which of the following best represents how you think of yourself?
Lesbian or gay
Straight, that is, not lesbian or gay
Bisexual
Something else
Note that the NHIS question includes the “something else” option that was dropped from the NSFG question in 2008. The other key differences are in the order of the response categories and the inclusion of the terms “heterosexual” and “homosexual” in the NSFG categories.
Results of the 50-50 Randomized Study of the NSFG & NHIS Questions for Sexual Orientation
Table 1 shows unweighted sample numbers and weighted percent distributions for the NSFG and NHIS sexual orientation questions among 10,529 women and 8,609 men aged 18-49 interviewed between September 2015 through September 2019. Note that the category labels used in these tables follow the order and wording of the NSFG question, and besides the “something else” category used by NHIS, the categories align sufficiently closely.
For women aged 18-49, 88.3% who received the NSFG question identified as “heterosexual or straight,” which was higher than the 86.0% who received the NHIS question (Table 1). Similar percentages of women (2.7% using NSFG question and 2.0% using NHIS question) identified as “homosexual, gay, or lesbian.” The percentages identifying as bisexual were also similar (7.6% using NSFG question and 7.4% using NHIS question). No differences were seen between the two questions in refusals and reporting of “don’t know.”
For men aged 18-49, the percentage who identified as “heterosexual or straight” with the NSFG question was higher (94.5%) than with those who received the NHIS question (91.8%) (Table 1). Similar percentages of men (2.5% using NSFG question and 2.9% using NHIS question) identified as “homosexual/gay.” The percentage identifying as “bisexual” was the same for both question types (2.1-2.2%). No differences were found between the two questions in refusals and reporting of “don’t know.”
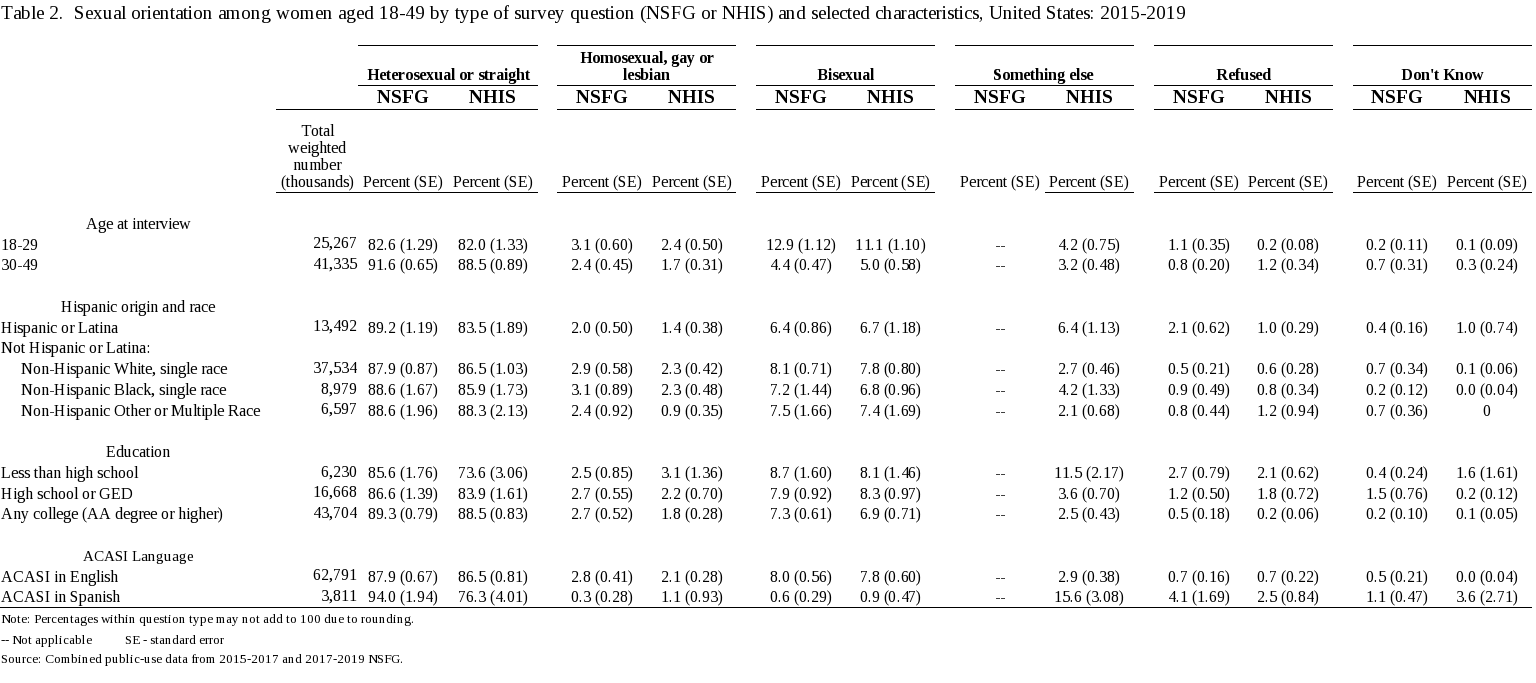
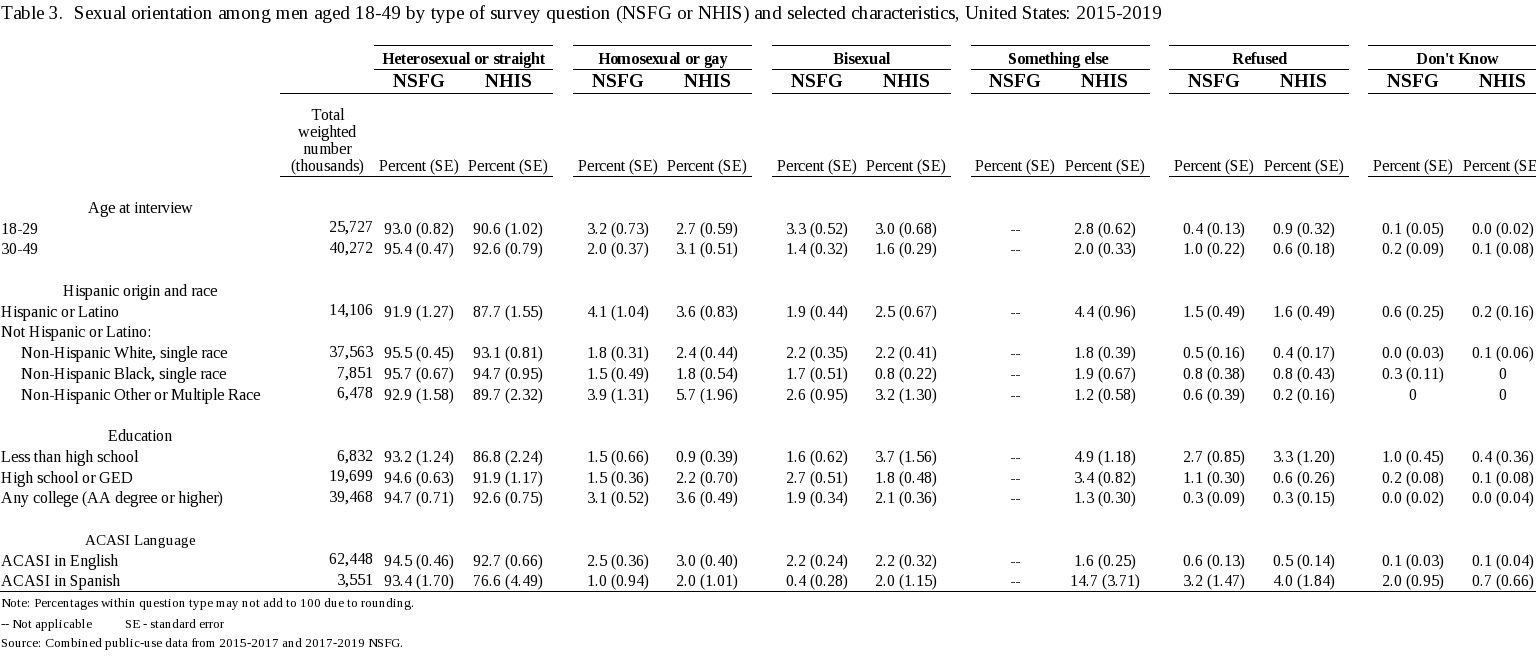
Tables 2 and 3 show the weighted sample numbers and percent distributions by sexual orientation, separately by question type for women and men. These distributions are further shown by age, Hispanic origin and race, education, and language in which ACASI was completed. While there were some significant differences seen in the sexual orientation distributions by demographic variables and ACASI language, both the NSFG and NHIS question showed similar patterns, suggesting that question wording did not impact the responses. The primary differences seen in the distributions by question type appear to be related to the offering of “something else” option in the NHIS question. This response category impacted the reporting of “heterosexual/straight” particularly for those respondents who completed ACASI in Spanish and those with less than a high school education, as described below. It may also have affected reporting of the other sexual orientation categories.
ACASI language: For women completing ACASI in Spanish, 15.6% identified as “something else,” compared with 2.9% of women completing ACASI in English. For men completing ACASI in Spanish, 14.7% identified as “something else,” compared with 1.6% of men completing ACASI in English. This difference in reporting of “something else” by ACASI language for the NHIS version of the sexual orientation question reduced the percentage identifying as “heterosexual/straight,” compared with the percentages obtained with the NSFG question where the “something else” option was not offered. Among women answering the NHIS question in Spanish, 76.3% identified as “straight” compared with 94.0% of women answering the NSFG question in Spanish. No such difference was seen among women answering the ACASI questions in English (86.5% and 87.9%, respectively). A similar pattern was seen for men: 76.6% of men who answered the NHIS question in Spanish identified as “straight,” compared with 93.4% of men who answered the NSFG question in Spanish.
Education: Among women with less than a high school degree, 11.5% identified as something else, compared with 3.6% of high school graduates and 2.5% of women with any college degree. As with ACASI language, this higher reporting of “something else” among women with less than a high school degree also reduced the percentage identifying as “heterosexual/straight,” compared with the NSFG version that did not offer the “something else” option. Among women with less than a high school degree answering the NHIS question, 73.6% identified as “straight” compared with 85.6% answering the NSFG question.
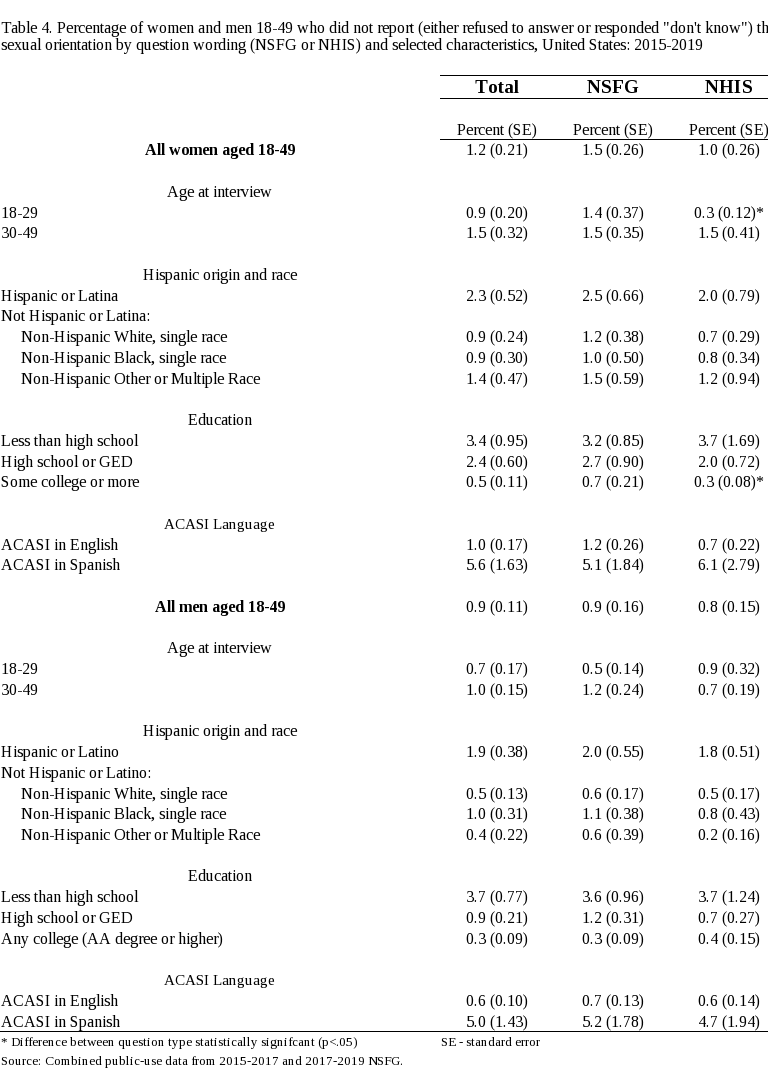
Table 4 shows the percentages of men and women age 18-49 that “did not report” their sexual orientation, a category which combines those who responded “don’t know” or who refused to answer this question. (Tables 2 and 3 showed these percentages separately.) The percentages are shown overall and by question type, according to age, Hispanic origin and race, education, and ACASI language. For men, no difference was seen by question type, both overall and for demographic groups and ACASI language. However, among women age 18-29 those who received the NSFG question were more likely to not report their sexual orientation than those who received the NHIS question. Among women with at least some college, those who received the NSFG question were more likely to not report their sexual orientation than those who received the NHIS question.
Summary
While some differences were noted in the distributions of sexual orientation using the NSFG and NHIS question type, these variations seem to be artifacts of the inclusion of the “something else” option in the NHIS question. When examining the percentages who “did not report” sexual orientation, due to “don’t know” or “refused” responses, few significant differences were seen between question types. Similar patterns were seen in the percentages not reporting sexual orientation by age, Hispanic origin and race, education, and ACASI language, regardless of question type. Going forward into future NSFG data collection, the standard NHIS question will be used for all respondents.
References
Agénor M, Murchison GR, Chen JT, Bowen DJ, Rosenthal MB, Haneuse S, Austin SB. Impact of the Affordable Care Act on human papillomavirus vaccination initiation among lesbian, bisexual, and heterosexual U.S. women. Health Serv Res. 2019. DOI: 10.1111/1475-6773.13231.
Chandra A, Billioux VG, Copen CE, Sionean C. HIV Risk-Related Behaviors in the United States Household Population Aged 15–44: Data from the National Survey of Family Growth, 2002 and 2006–2010. National health statistics reports; no 46. Hyattsville, MD: National Center for Health Statistics. 2012.
Chandra A, Copen CE, Mosher, WD. Sexual Behavior, Sexual Attraction, and Sexual Identity in the United States: Data from the 2006–2010 National Survey of Family Growth. In Amanda Baumle (Ed.) International Handbook on the Demography of Sexuality. New York, NY. Springer Publishing Company. 2012.
Chandra A, Mosher WD, Copen C, Sionean C. Sexual behavior, sexual attraction, and sexual identity in the United States: Data from the 2006–2008 National Survey of Family Growth. National health statistics reports; no 36. Hyattsville, MD: National Center for Health Statistics. 2011.
Copen CE, Chandra A, Febo-Vazquez I. Sexual behavior, sexual attraction, and sexual orientation among adults aged 18–44 in the United States: Data from the 2011–2013 National Survey of Family Growth. National health statistics reports; no 88. Hyattsville, MD: National Center for Health Statistics. 2016.
Copen CE, Chandra A, Febo-Vazquez I. HIV testing in the past year among the U.S.household population aged 15–44: 2011–2013. NCHS data brief, no 202. Hyattsville, MD: National Center for Health Statistics. 2015.
Dahlhamer JM, Galinsky AM, Joestl SS, Ward BW. Sexual orientation in the 2013 National Health Interview Survey: A quality assessment. Vital Health Stat 2(169). 2014.
Laumann EO, Gagnon JH, Michael RT, Michaels S. The Social Organization of Sexuality: Sexual Practices in the United States. Chicago, IL. University of Chicago Press. 1994.
Miller, K, Ryan, JM. Design, development and testing of the NHIS sexual identity question. Available online at: https://wwwn.cdc.gov/qbank/report/Miller_NCHS_2011_NHIS%20Sexual%20Identity.pdf. 2011.
Mosher WD, Chandra A, Jones J. Sexual behavior and selected health measures: Men and women 15–44 years of age, United States, 2002. Advance data from vital and health statistics; no 362. Hyattsville, MD: National Center for Health Statistics. 2005.
Paschen-Wolff MM, Kelvin E, Wells BE, Campbell ANC, Grosskopf NA, Grov C. Changing trends in substance use and sexual risk disparities among sexual minority women as a function of sexual identity, behavior, and attraction: Findings from the National Survey of Family Growth, 2002–2015. Arch Sex Behav 48(4):1137-1158. 2019. DOI: 10.1007/s10508-018-1333-1.
Porsch L, Zhang H, Paschen-Wolff M, Grosskopf N, Grov C. Dimensions of sexual orientation as predictors of sti-related outcomes among women: An Examination of 2011-2017 National Survey of Family Growth Data [published online ahead of print, 2020 Jun 30]. J Womens Health (Larchmt). 2020. DOI: 10.1089/jwh.2019.8289.
Porsch L, Zhang H, Paschen-Wolff M, Grosskopf N, Grov C. Contraceptive Use by Women Across Multiple Components of Sexual Orientation: Findings from the 2011-2017 National Survey of Family Growth. LGBT Health. Sep 2020. DOI: 10.1089/lgbt.2020.0013.
Table 1. Sexual orientation among women and men aged 18-49, by survey question used in 2015-2019 NSFG ACASI |
||||
|
NSFG Question |
NHIS Question |
NSFG Question |
NHIS Question |
|
Unweighted n's |
Weighted Percentages (SE) |
||
|
|
|
|
|
|
|
|
|
|
All women aged 18-49 |
5,382 |
5,147 |
100.0 |
100.0 |
Heterosexual or straight /1 |
4,700 |
4,364 |
88.3 (0.64) |
86.0 (0.81) |
Homosexual, gay or lesbian /2 |
144 |
120 |
2.7 (0.39) |
2.0 (0.27) |
Bisexual |
459 |
409 |
7.6 (0.53) |
7.4 (0.57) |
Something else |
-- |
201 |
-- |
3.6 (0.43) |
Refused |
56 |
47 |
0.9 (0.19) |
0.8 (0.22) |
Don't Know |
23 |
6 |
0.6 (0.20) |
0.2 (0.15) |
|
|
|
|
|
All men aged 18-49 |
4,374 |
4,235 |
100.0 |
100.0 |
Heterosexual or straight 3/ |
4,090 |
3,862 |
94.5 (0.44) |
91.8 (0.64) |
Homosexual or gay 4/ |
113 |
132 |
2.5 (0.35) |
2.9 (0.38) |
Bisexual |
111 |
105 |
2.1 (0.23) |
2.2 (0.32) |
Something else |
-- |
103 |
-- |
2.3 (0.30) |
Refused |
46 |
29 |
0.8 (0.15) |
0.7 (0.15) |
Don't Know |
14 |
4 |
0.2 (0.06) |
0.1 (0.05) |
-- Not applicable SE - standard error |
|
|
|
|
Notes: NSFG is National Survey of Family Growth. NHIS is National Health Interview Survey. Due to breakoffs before reaching this question in ACASI, 45 female cases and 27 male cases were assigned "not ascertained" codes for the sexual orientation question. Since it cannot be known which version of the question these respondents would have receieved, this category is coded as sysmis. |
||||
1/ This category label reflects the NSFG question. The NHIS category was labeled as "Straight, that is, not lesbian or gay." |
||||
2/ This category label reflects the NSFG question. The NHIS category was labeled as "Lesbian or gay." |
|
|||
3/ This category label reflects the NSFG question. The NHIS category was labeled as "Straight, that is, not gay." |
||||
4/ This category label reflects the NSFG question. The NHIS category was labeled as "Gay." |
|
|||
Source: Combined public-use data from 2015-2017 and 2017-2019 NSFG. |
|
|
||


| File Type | application/vnd.openxmlformats-officedocument.wordprocessingml.document |
| Author | Copen, Casey E. (CDC/OPHSS/NCHS) |
| File Modified | 0000-00-00 |
| File Created | 2021-10-04 |
© 2026 OMB.report | Privacy Policy