Appendix G_MIHOPE-K Power calculations
Appendix G_MIHOPE-K_Power calculations.docx
Mother and Infant Home Visiting Program Evaluation (MIHOPE): Kindergarten Follow-Up (MIHOPE-K)
Appendix G_MIHOPE-K Power calculations
OMB: 0970-0402
Appendix G
MIHOPE-K: Power Calculations
Minimum Detectable Differences for the Full MIHOPE Sample
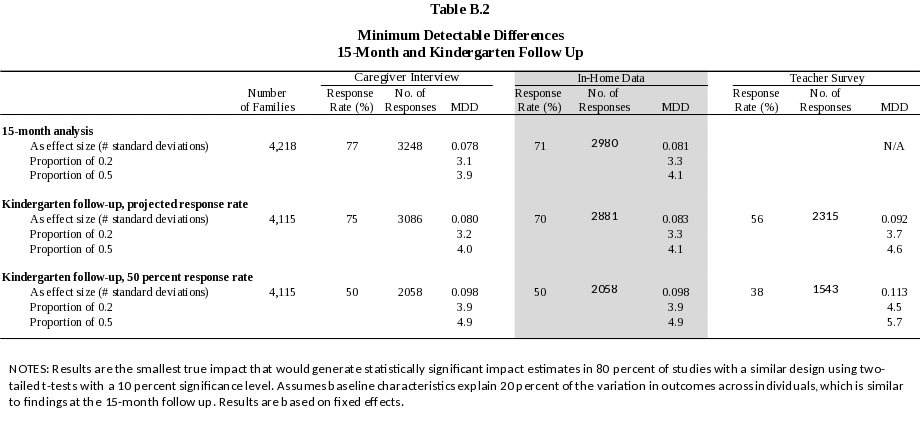
Table G.1 shows the minimum detectable differences of the study for analyses involving the full sample (subgroup analyses are shown in Table G.2). For reference, we have included the fielded sample, actual response rates, and minimum detectable differences for the 15-month follow-up.
For MIHOPE-K, minimum detectable differences are shown for three types of data that will be collected at kindergarten that may have different response rates:
(1) the one-hour caregiver interview,
(2) in-home assessments, and
(3) teacher surveys.
For the caregiver survey and in-home assessments, we show two different response rate scenarios:
a 75 percent response rate for the caregiver survey and a 70 percent response rate for in-home data collection. Both are calculated among the fielded sample (as described above, the sample available to be fielded at kindergarten is 4,115), and
a 50 percent response rate among the fielded sample.
As noted elsewhere, the use of in-person locating in kindergarten data collection makes it similar to the 15-month follow-up, and we therefore expect response rates at kindergarten to be similar to the 15-month follow-up. By contrast, the 2.5 and 3.5-year surveys generally did not include in-person locating, which is why response rates were only about 50 percent. More information about expected response rates is available in Section B.5 of Supporting Statement B.
The teacher survey is assumed to be completed with 75 percent of families who complete the caregiver survey, resulting in a 56 percent response rate under the expected scenario and a 38 percent response rate under a scenario with a 50 percent caregiver response rate.
The results shown in Table G.1 are the smallest true impact that would generate statistically significant impact estimates in 80 percent of studies with a similar design using two-tailed t-tests with a 10 percent significance level. We have assumed that baseline characteristics explain 20 percent of the variation in outcomes across individuals, which is similar to findings at the 15-month follow-up.
The minimum detectable differences shown for the full sample are the minimum detectable differences between the program and control group estimates, which is the main effect of interest in this study.
Minimum detectable differences are shown in three ways:
For an outcome that would be true for 20 percent of the control group. An example of an outcome with that sort of distribution in the MIHOPE sample is whether the caregiver is experiencing depressive symptoms at the time of the survey.
For an outcome that would be true for 50 percent of the control group. An example of an outcome with that sort of distribution in the MIHOPE sample is whether the caregiver is receiving SNAP benefits at the time of the survey.
As a percentage of the outcome’s standard deviation, which is commonly referred to as an effect size. The effect size can apply to any outcome measured through one of these data sources. Whether a given effect size is policy relevant depends on the context since small movements in some outcomes may be more meaningful than for other outcomes.
The minimum detectable differences for the full sample show the following:
Caregiver interview. At the 15-month follow up, the minimum detectable effect is 0.078 standard deviations, which translated into impacts of 3.1 and 3.9 percentage points for outcomes with a 20 prcent and 50 percent prevalence rate. At the kindergarten follow-up, the minimum detectable effect size is 0.080 with a 75 percent response rate and 0.098 with a 50 percent response rate. For an outcome with a 20 percent prevalence rate, this translates into differences of 3.1-3.9 percentage points while for an outcome with a 50 percent prevalence, they translate into differences of 4.0-4.9 percentage points.
In-home data collection. At the 15-month follow up, the minimum detectable effect was 0.081 standard deviations, which translated into impacts of 3.3 and 4.1 percentage points for outcomes with a 20 percent and 50 percent prevalence rate. At the kindergarten follow-up, the minimum detectable effect size would range from 0.83 with a 70 percent response rate to 0.098 with a 50 percent response rate. For an outcome with a 20 percent prevalence rate, this translates into effects of 3.3-3.9 percentage points while for an outcome with a 50 percent prevalence, they translate into effects of 4.1-4.9 percentage points.
Teacher surveys. Since teacher surveys were not part of the 15-month follow-up, the table shows only the minimum detectable effects for the two kindergarten response rate scenarios. As discussed in Appendix F: Maximizing Response Rates, we have assumed a 56 percent response rate for the teacher survey (assuming 75 percent of teachers respond
for the 75 percent of families who complete other parts of family data collection). The minimum detectable effect size ranges from 0.092 to 0.113, depending on the response rate. For an outcome with a 20 percent prevalence rate, this translates into effects of 3.7-4.5 percentage points while for an outcome with a 50 percent prevalence, they translate into effects of 4.6-5.7 percentage points.
Table G.1: Minimum Detectable Differences at 15-Month and Kindergarten Follow Up:

A major goal of the MIHOPE kindergarten follow-up is to examine school readiness. Since measures of child development are typically scale scores without a natural interpretation, it is common to analyze results in terms of effect sizes. From that perspective, these minimum detectable effect sizes are in line with those found in randomized trials examining academic skills in elementary school, which range from 0.07 to 0.23 standard deviations.1 They translate into nearly 3-4 weeks of additional growth in oral language development. During the transition to kindergarten, children are learning language rapidly and three weeks of additional language development represents substantial growth in foundational skills over what would have been expected in the absence of the intervention.2 Given the importance of early language for literacy development and later academic outcomes,3 school districts have begun to implement resource-intensive 6-week programs to support children's developmental gains across the summer between academic years.4 The minimum detectable effect in the current study is equivalent to half the time spent in an additional summer program, over and above typical instruction during the academic year. In addition, early interventions may have the ability to help close achievement gaps between lower- and higher-income children that begin in early childhood and tend to stay stable throughout childhood and adolescence. The minimum detectable effect in the current study is equivalent to closing the gap in early language skills between lower- and middle-income children by about 20%.5
Another goal of the long-term follow-up in MIHOPE is to conduct a benefit-cost analysis of the home visiting programs included in the study. In past studies of home visiting, benefits to the government have come from increased maternal earnings and reductions in public assistance receipt. A common source of public assistance in MIHOPE is SNAP benefits, which is expected to have a prevalence range of 50 percent. For such an outcome, the study would be powered to detect impacts of 4.0-4.9 percentage points using information from the parent survey. The average SNAP recipient receives about $250 in benefits each month, a 4 percentage point reduction in SNAP benefits would translate into savings of about $120 per year, which, accumulated over a period of time, would be sufficient to contribute to findings about whether home visiting is an investment that provides long-term benefits to the government.
Minimum Detectable Differences for Subgroups
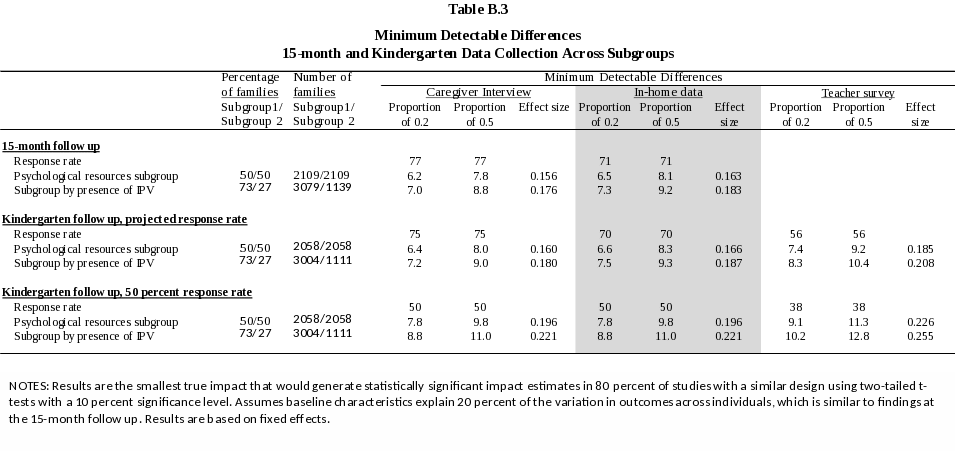
The MIHOPE design calls for an analysis of whether impacts differ across subgroups. To illustrate the statistical power regarding subgroups, Table G.2 presents the minimum detectable differences in effects between subgroups. Results are presented for two sets of subgroups, which were chosen because they illustrate how the statistical power varies with the size of a subgroup.
By maternal psychological resources. The concept of “psychological resources” is taken from the Nurse-Family Partnership, which found in two studies that effects were concentrated among for parents with low psychological resources.6 It is based on a composite of (1) mental health, (2) mastery (the extent to which a person thinks life chances are under her control), and (3) verbal abstract reasoning. By construction, half the sample is considered to have low psychological resources.
By presence of intimate partner violence (IPV). When most of the sample is in one subgroup, differences in impacts have to be somewhat larger for them to generate statistically significant differences. To illustrate this, Table G.2 shows power calculations for subgroups defined by whether there is IPV in the caregiver’s relationship, a subgroup comparison that is being made in the MIHOPE 15-month analysis.
Similar to Table G.1, Table G.2 contains three panels, showing statistical power for
The 15-month follow-up
The kindergarten follow-up with a 75 percent response rate for the caregiver survey
The kindergarten follow-up with a 50 percent response rate for the caregiver survey
Also like Table G.1, Table G.2 shows results for the three main data sources: the caregiver interview, in-home data collection, and the teacher survey. For each row, the table shows how the sample is split between the two subgroups and the number of families in the fielded sample for each subgroup. It then shows minimum detectable differences in the effects across subgroups in three ways:
For an outcome with a prevalence of 20 percent
For an outcome with a prevalence of 50 percent
Expressed as an effect size (that is, as the number of standard deviations of the outcome)
The minimum detectable differences across subgroups show the following:
Caregiver interview. At the 15-month follow up, the minimum detectable difference in effect sizes was 0.156 across the psychological resource subgroup and 0.176 across the IPV subgroups. These translate into differences of 6.2-7.0 percentage points for an outcome with a 20 percent prevalence (like maternal depression) and 7.8-8.8 percentage points for an outcome with a 50 percent prevalence (like SNAP receipt). At the kindergarten follow-up, the minimum detectable difference in terms of effect sizes is 0.160-0.180 standard deviations with a 75 percent response rate and 0.196-0.221 with a 50 percent response rate. For an outcome with a 20 percent prevalence rate, this translates into effects of 6.4-7.2 percentage points with a 75 percent response rate and 7.8-8.8 percentage points with a 50 percent response rate. For an outcome with a 50 percent prevalence rate, this translates into effects of 8.0-9.0 percentage points with a 75 percent response rate and 9.8-11.0 percentage points with a 50 percent response rate.
In-home data collection. The minimum detectable differences are slightly larger for in-home data collection than for the caregiver interview because the expected response rates are slightly lower. For example, for an outcome with a prevalence of 50 percent, data collect in the home could detect differences across subgroups ranging from 8.3 to 11.0 percentage points.
Teacher surveys. Depending on the response rate and subgroup, the minimum detectable differences range from 0.185 to 0.225 when expressed as effect sizes, 7.4
to 10.2 percentage points for an outcome with 20 percent prevalence, and 9.2 to 12.8 for an outcome with 50 percent prevalence.
Table G.2: Minimum Detectable Differences at 15-Month and Kindergarten Data Collection Across Subgroups

1 Hill et al., 2008.
2 Bowne, Yoshikawa, & Snow, 2017
3 Duncan et al., 2007; Silva & Cain, 2015
4 Quinn & Polikoff, 2017
5 Reardon & Portilla, 2016
6 Kitzman et al., 1997.
| File Type | application/vnd.openxmlformats-officedocument.wordprocessingml.document |
| Author | Nerenberg, Laura (ACF) |
| File Modified | 0000-00-00 |
| File Created | 2021-12-01 |
© 2026 OMB.report | Privacy Policy