Classroom Video Analysis (CVA) Assessment
Visual Representations for Proportional Reasoning: Impacts of a Teacher Professional Development Program for Multilingual Learners and Other Students
NE 5.1.1 CT CVA instrument
Classroom Video Analysis (CVA) Assessment
OMB: 1850-0978
According to the Paperwork Reduction Act of 1995, no persons are required to respond to a collection of information unless such collection displays a valid OMB control number. The valid OMB control number for this information collection is 1850-xxxx. Public reporting burden for this collection of information is estimated to average 30 minutes per response, including time for reviewing instructions, searching existing data sources, gathering and maintaining the data needed, and completing and reviewing the collection of information. The obligation to respond to this collection is voluntary. If you have any comments concerning the accuracy of the time estimate, suggestions for improving this individual collection, or if you have comments or concerns regarding the status of your individual form, application or survey, please contact Janelle Sands at the Institute of Education Sciences (IES) at [email protected] directly.
Thank you for participating in the Regional Educational Laboratory Northeast and Islands’ evaluation of the Visual Access to Mathematics Professional Development (“VAM PD”) program. The following set of questions is expected to take 30 minutes to complete.
VAM Classroom Video Analysis (CVA) measure to assess teacher ability to analyze student thinking related to proportional reasoning
Instructions for each
video clip
There are 6 video clips in this exercise. Once you start the task, the arrows in the upper right corner will help you to navigate through the video clips. The arrow pointing up will take you back to this page.
(1) Start by reading the short clip description above the video player before you watch each video.
(2) Use the play icon to start the video clip. The pause and play icons and the slider under the video clip allow you to pause, watch, or rewatch the video clips.
(3) Answer the prompt. Save your response by clicking Save Draft. You may edit saved responses. Please check the box Mark as Final once you are ready to submit your response. Once you have submitted your response as final, you are not able to go back and change it at a later time.
(4) Use the red forward arrow in the upper right corner of the page to navigate to the next video. Please note that some clips might take a few minutes to load. You may click on the Start tab and see your progress in the red circle diagram on the upper right corner of the page.
(5) Once you have marked all of your responses as final, you have completed the video analysis task and you will receive a completion email.
To start, click on Clip 1 in the list on the right.
We really appreciate your participation and look forward to reading your responses. Thank you!
Prompt for each video clip:
Please comment on what mathematical ideas the student(s) in the clip might or might not understand. Be specific.
Clips:
Clip 1

Description:
The students are working in small groups and were asked to solve the following problem: “A pelican can hold 3 gallons of water in its mouth and a gallon of water in its stomach. If you were like a pelican and you could fit half a gallon of liquid in your stomach, how much liquid could you fit in your mouth?” The clip shows the teacher helping one group that is working on this problem.
Clip 2

Description:
In this lesson, students compare two lemonade recipes (the 1st recipe has 3 lemons to 2 cups water, and the 2nd recipe has 6 lemons to 3 cups water). The students have already written several conjectures about which recipe is “more lemony:; the clip picks up during the discussion about whether one conjecture is correct or incorrect. After some students claim one conjecture is not correct, the teacher provides another two recipes to add to the conversation.
Clip 3

Description:
In this lesson students learn how to solve a proportion. They are working on the following problem: “How many students need to hold hands to cover the distance from LA to Long Beach (99,845 feet)?” To help solve the problem, the teacher had them determine that it takes five students to cover a 20-foot rope. The clip begins with the teacher checking on the progress of one of the students.
Clip 4

Description:
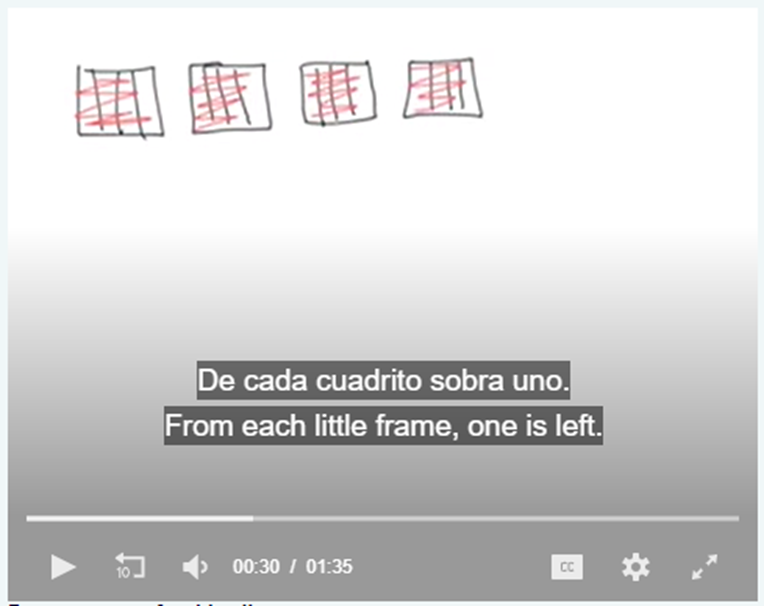
In this screencast clip, a sixth-grade student is working with a teacher on the following task: “Maureen ordered 4 bags of soil for her flower gardens. Each garden needs 3/4 of a bag of soil. She wants to know how many gardens she can fill completely and how much soil she has left over.” The clip begins as the student draws a visual representation to help her solve the problem. There are two rows of subtitles in this clip; the first row of subtitles is in Spanish, and the second row of subtitles is an English translation.
Clip 5

Description:
After a conversation about how much sugar is needed to bake a cake, and the more ingredients you use the more people you can serve, the teacher poses the following problem: “If 2 cups of sugar are needed for 4 people and 4 cups of sugar for 8 people, how many cups of sugar are needed for 12 people and how many cups are needed for 15 people?” One student explains her answer.
Clip 6

Description:
The lesson is to consider two different lemonade recipes that use different amounts of lemon and water, conjecture which recipe makes the more lemony lemonade, and then prove or disprove these conjectures. The students have already worked in small groups to provide conjectures. The clip picks up during the whole class discussion while the students are analyzing the correctness of these conjectures. Two students share how they are now thinking about the problem.
Scoring Guide for the VAM Classroom Video Analysis measure
Overview of measure. The VAM Classroom Video Analysis (CVA) measure includes six clips showing students and a teacher working on tasks on ratio or proportional reasoning. Teachers are asked to view the clips and respond to the following prompt: “Please comment on what mathematical ideas the student(s) in the clip may or may not understand. Be specific.”
Overview of scoring.
The VAM CVA scoring rubric was developed in consultation with the author of the CVA and is based on the author’s Student Thinking scoring rubric (Kersting, 2008; Kersting et al., 2010; Kersting et al., 2012). We code teachers’ responses to each item for the presence of (a) a claim about students’ understandings of specific mathematical concepts or ideas, and (b) evidence to support the claim. Teachers’ responses can receive a score of 0, 1, or 2 for each item. A teacher’s average score for all items represents the teacher’s ability to analyze students’ understandings of ratio and proportional reasoning content as it is displayed in video clips of classroom learning activities. Rubric scores for each item represent the following:
A score of zero: The response does not include a claim about what a student understands or does not understand about a specific mathematical idea or concept related to ratio and proportional reasoning in the clip. A score of zero may include unclear or incomplete claims, a blank response, or a description of students’ verbal and/or written output that does not connect to any claim. Without such a claim, it is not possible for the response to have evidence to support the claim.
A score of 1: The response includes a claim about what a student understands or does not understand about a key mathematical idea or concept related to ratio and proportional reasoning in the clip but does not include evidence to support the claim.
A score of 2: The response includes a claim about what a student understands or does not understand about a key mathematical idea or concept related to ratio and proportional reasoning in the clip and includes evidence to support the claim. The evidence must come from a description of students’ verbal and/or written output that makes a clear and logical connection to the claim.
Table I summarizes the conditions under which raters assign a score of 0, 1, or 2 to a teacher’s response. Table II provides additional details about how the creators of the measure define claims and evidence in this exercise.
Table I. Scoring rubric for the VAM CVA exercise
Score to assign |
When participant response includes the following: |
|
a. A claim about what students understand or do not understand about a specific mathematical idea or concept related to ratio and proportional reasoning content in the clip. |
b. Specific and relevant evidence for the claim (from a) with a description of students’ verbal and/or written output linked to the claim. |
|
0 |
No |
No |
1 |
Yes |
No |
2 |
Yes |
Yes |
Note: Rubric adapted from Kersting et al., 2012, and used in a prior study of VAM PD (DePiper et al., 2021b)
Table II. Scoring rubric details on claims and evidence in teacher responses to the VAM CVA exercise
The response includes: |
Coding notes |
|
Definition of a “claim” in this exercise:
A claim is a conclusion or assertion about what a student understands or does not understand about the ratio and proportional reasoning content in the video clip.
Notes about possible claims:
Possible qualifying and non-qualifying claims by clip (Examples for three clips shown below)
Clip 1 (pelican mouth/stomach water-holding ratio)
Clip 3 (lemon/water – conjecture about more lemons = more lemony)
Clip 5 (3/4 bag of soil for each flower garden, 4 bags of soil)
Examples:
|
|
Definition of “evidence” in this exercise:
A description of student (or students’) work that relates to and supports the claim.
To receive a “Yes” for this criterion, the response must:
|
Note: Rubric adapted from Kersting et al. (2012), and used in a prior study of VAM PD (DePiper et al., 2021b)
| File Type | application/vnd.openxmlformats-officedocument.wordprocessingml.document |
| Author | Battal, Jill |
| File Modified | 0000-00-00 |
| File Created | 2023-09-29 |
© 2026 OMB.report | Privacy Policy