2023 NSCG QR Code Experiment Report (DRAFT)
Appendix_L_2023 NSCG QR Code Report.docx
National Survey of College Graduates (NSCG)
2023 NSCG QR Code Experiment Report (DRAFT)
OMB: 3145-0141
APPENDIX L
2023 National Survey of College Graduates QR Code Experiment Report (DRAFT)
Note: The Census Bureau has reviewed this data product to ensure appropriate access, use, and disclosure avoidance protection of the confidential source data used to produce this product (Data Management System (DMS) number: P-7533594, Disclosure Review Board (DRB) approval number: CBDRB-FY25-POP001-0001).
Table of Contents
2.3.4 Characteristics of Respondents 5
3. Assumptions and Limitations 6
4.4 Characteristics of Respondents 8
Appendix B: Device Use Rates 15
Appendix C: Demographic Variables 16
Appendix E: NSCG Mailing Schedule and Mailing Materials 24
Appendix G: Mailings from Other Weeks that Included Additional Differences than just the QR code 32
Appendix H: Minimum Detectable Differences Equation and Definitions 51
Table of Tables
Table 1: 2023 NSCG QR code experimental groups 4
Table 3: Mean days to complete online 7
Table 4: Mobile device as the first device use rate 8
Table 5: Percent of respondents that in the younger category 9
Table 7: Disposition codes for eligible and ineligible respondents 12
Table 8: Mobile device as the longest device use rate 15
Table 9: Demographic variables 16
Table 10: Weighted respondent distributions for race 17
Table 11: Weighted respondent distributions for highest degree 18
Table 12: Weighted respondent distributions for science and engineering occupation 18
Table 13: Weighted respondent distributions for citizenship status 18
Table 14: Weighted respondent distributions for disability status 19
Table 15: Weighted respondent distributions for Hispanic origin 19
Table 16: Weighted respondent distributions for broad occupation category 19
Table 17: Weighted respondent distributions for oversample indicator 21
Table 18: Weighted respondent distributions for sex 22
Table 19: Weighted respondent distributions for work status 22
Table of Figures
Executive Summary
The 2023 National Survey of College Graduates (NSCG) included an experiment that tested the effect of including quick response (QR) codes in mail materials on response and demographic representation. The control group was only offered a URL, while the treatment group received both a QR code and URL to access the survey instrument in their letters. The experiment was conducted only on the new cohort sample to limit operational complexities.
The addition of a QR code in the mail materials led to an increase in the proportion of mobile respondents and a decrease in survey breakoffs. However, this addition did not influence other key engagement rates or affect the demographic composition of respondents. That is, there was no evidence that the QR code brought in younger respondents or caused any shifts in the demographic distribution. Additionally, there was no evidence to suggest that QR code recipients completed the survey earlier. Overall, our analysis reveals that the inclusion of QR codes had minimal impact. However, given the rise in mobile responses, it is necessary to look into how the mobile push could affect data quality beyond breakoff rates. Therefore, we do not recommend implementing the QR code at full scale until we can confirm that it will not negatively affect data quality.
The 2023 National Survey of College Graduates (NSCG) included a QR code experiment to test the impact of incorporating quick response (QR) codes in the mail materials. This report documents the results of the 2023 QR code experiment and recommendations for data collection procedures for future cycles.
The NSCG is a repeated cross-sectional survey, conducted every two years, designed to provide data on the number and characteristics of individuals with a college degree living in the United States. The U.S. Census Bureau implements the survey on behalf of the National Center for Science and Engineering Statistics (NCSES) within the National Science Foundation (NSF). The 2023 NSCG sample consisted of approximately 161,000 new and returning cases that had previously responded to the American Community Survey (ACS). Data collection spanned 26 weeks and used a multi-mode approach of self-administered web and paper questionnaires and Computer-Assisted Telephone Interviewing (CATI).
The NSCG typically sees low response rates among the population aged 25-34 (U.S. Census Bureau, 2021). In the 2021 NSCG, as a last-ditch effort to boost response rates, QR codes were used in the week 25 mailing for all remaining sampled cases. While the overall gain in response was low, as is expected at the end of the data collection, there were more young people (i.e., ages 25-34) who responded to the QR code mailing than the standard mailing sent two weeks earlier (U.S. Census Bureau, 2022). This suggests QR codes may provide a new way to reach these cases.
While early QR code research suggested they had either no impact or a negative impact (Lugtig & Luiten, 2021; Marlar, 2018; Smith, 2017) on response rates, there is good reason for these less-than-positive results. Android phones did not have automatic QR code readers through the camera application, so users had to download an application to scan the code. Additionally, their overall use in day-to-day life was rare. However, both Android1 and Apple2 phones now have automatic QR code readers, and the COVID-19 pandemic made the use of QR codes much more ubiquitous as restaurants and other businesses went touchless (Gostin, 2021). The normalization of the QR code has opened the door to revisit their impact on survey recruitment.
Lugtig & Luiten (2021) did not find that QR codes had a significant effect on response rates but found that they pushed survey respondents to use smartphones. Additionally, they found that those who used the QR code were younger and no more likely to break off than those who accessed the survey with a URL. Endres et al. (2023) found a positive impact on response rates when a QR code was offered alongside a URL to access the survey. These studies suggest that the QR code likely will not depress response and may increase it or bring in younger respondents.
This experiment tested the theory that QR codes will increase response among younger respondents, decrease the time to respond, and result in equivalent or better response rates. We also evaluated whether there was a higher survey breakoff rate due to the anticipated increase in mobile device use.
This section details the experimental design, research questions and the methods that were used to answer them. The main goal was to measure the impact of including the QR code on response rates, the timing of response, the effect on mobile device use, whether it increased response from younger people, and whether survey breakoffs increased.
The NSCG uses Successive Difference Replication (SDR) methods to construct replicate weights and calculate variance estimates. Like previous analyses, we used a jackknife variance estimator with a jackknife coefficient of 0.05 because of its similarities to the SDR method and because SDR is not supported using SAS software (Opsomer, Breidt, White, & Li, 2016). Jackknife replicates include 80 replicates for the new cohort. Experimental base and replicate weights were provided by Survey Statistics for Poverty, Health, Expenditures, and Redesign (SSPHER) staff in DSMD and used for most analyses, including weighted response rates. When possible, recommendations for future NSCG cycles are based on weighted estimates and statistical tests because they provide inferences about the NSCG population. We used a significance level of 0.1 for all analyses in this report.
A systematic random sample of approximately 7,500 cases were selected for the treatment group and 47,000 cases were selected for the control group. NSCG sampling sort variables were used to ensure the population within both groups was similar.3 Table 1 summarizes the treatment and control groups with their respective sample sizes.
Table 1: 2023 NSCG QR code experimental groups
Experimental Group |
Treatment |
Estimated Sample Size |
Control |
URL only |
47,000 |
Treatment |
URL and QR Code |
7,500 |
Source(s):
U.S. Census Bureau, 2023 National Survey of College Graduates QR code Experiment
We will answer the following research questions to determine the effects of offering QR codes:
How does including a QR code affect the response rates?
Does including a QR code decrease the time to response?
Does including a QR code increase mobile device responses?
Does including a QR code increase response rates of younger people?
Does including a QR code affect response rates of other demographic groups?
Does including a QR code increase breakoffs?
The following section outlines the methods that we used to answer each research question. We used experimental base weights and replicate weights for each estimate to account for the small treatment group sample size compared to the control, as well as to make inferences about the NSCG new cohort population. The experimental weights took the sampling base weights and applied an expansion factor that adjusts both experimental groups to weight up to the population eligible for the experiment. We verified the output using double programming, a verification process in which multiple staff develop program code independently to produce results. This practice helps ensure the quality of deliverables.4
To determine whether adding a QR code affected the response rate, we calculated the overall weighted response rate for each experimental group using Equation 1 in Appendix A. This equation is the same as the final response rate calculated for NSCG in production.
Before data collection, we calculated a minimum detectable difference (MDD) of approximately four percentage points for comparisons of response rates.5 We compared the overall response rates between the control and treatment groups using statistical t-tests with an alpha of 0.10.
We also measured whether offering QR codes led to an earlier response which could reduce the number of follow-up contacts. Among those who responded online, we compared the number of days it took for cases in both experimental groups to respond. We used a one-sided t-test to evaluate whether it took the treatment group fewer days (Equation 2 in Appendix A) to respond compared to the control group with an alpha of 0.10.
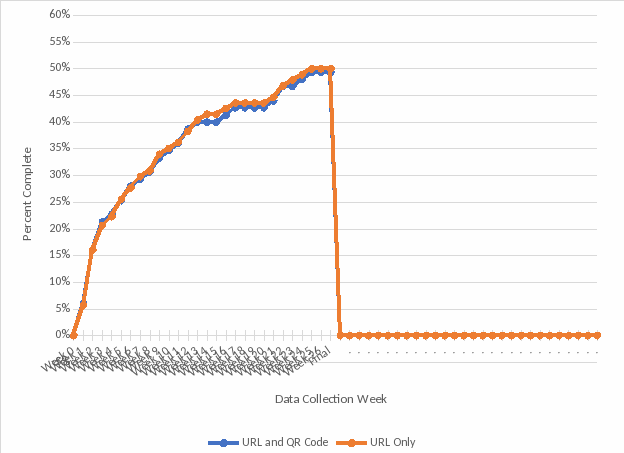
For a visual comparison of response timing, we graphed the weekly, cumulative, unweighted completion rates,6 calculated by Survey Statistics for Poverty, Health, Expenditures, and Redesign (SSPHER), for the experimental groups. Graphing the unweighted rates provided insight into how the experimental groups behaved alone and in relation to each other throughout the data collection period.
Online users may use a computer, smartphone, or a tablet to access the survey. Due to the small percentage of tablet users, we collapsed smartphone and tablet users to a mobile device category. We used a one-sided t-test to evaluate whether there was more mobile device usage among the treatment group compared to the control group. We investigated whether mobile devices were used more frequently to first access the survey instrument (Equation 3 in Appendix B) and whether mobile devices were used the longest to engage with the instrument (Equation 4 in Appendix B).
With lower response rates among young sample cases in the previous cycles, we are especially interested to see if offering QR codes resulted in more younger people (i.e., less than 40 years old) responding. We used a one-sided t-test to evaluate whether there were more younger respondents in the treatment group compared to the control group.
We also evaluated the effect of QR codes on other demographic groups listed in Appendix C. To determine if QR codes impacted response rates for the subpopulations of interest, we calculated chi-square tests of response distributions using the demographic characteristics listed in Appendix C. If any significantly different distributions were found in the subpopulations, pairwise t-tests were calculated between the treatment and control groups with a Bonferroni adjustment for multiple comparisons.
We defined a breakoff as any web instrument user who successfully logged into the survey but did not complete the survey. Users who began the survey, logged off at some point, but then returned to the survey and finished it are not considered breakoffs. We used a one-sided t-test to evaluate whether the overall breakoff rate for the treatment group was higher than the overall breakoff rate for the control group (Equation 5 in Appendix D).
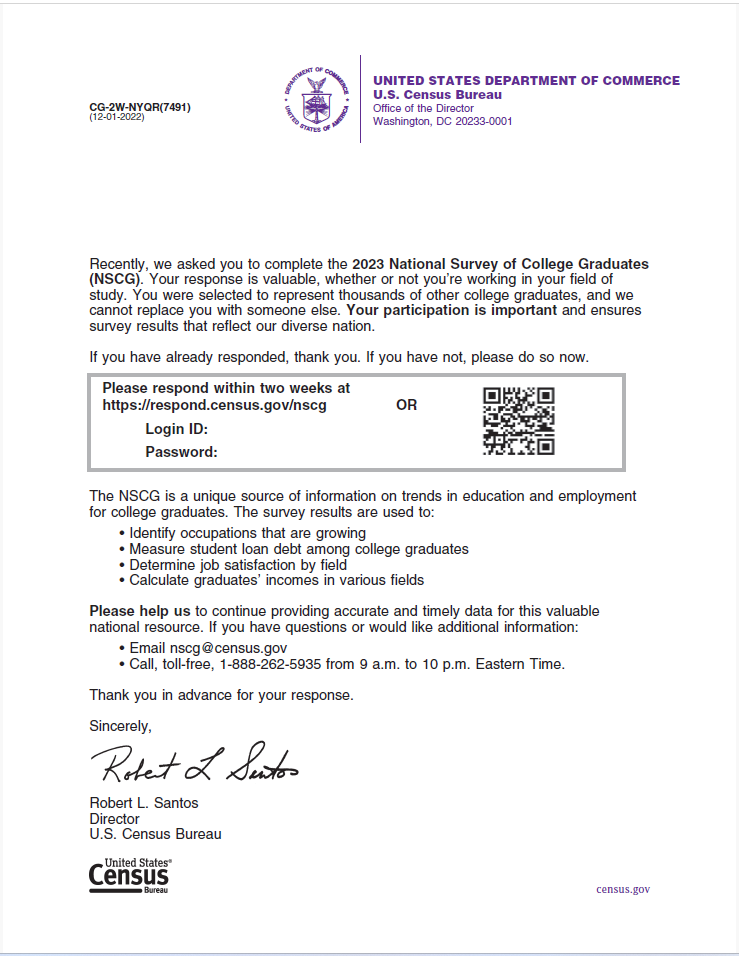
We had to consider the policy and privacy constraints when designing the experiment; while it would be ideal to have the QR code embed both ID and password to take sample members directly into the survey, this was not secure. Therefore, the QR code included in the mailing took sample members to the login page. The login page used the same URL, ID and password for those using a QR code to access the survey and for those who manually typed the URL into a web browser. Thus, there is no direct way to measure which method a respondent used to log in to the survey. Since we cannot directly identify respondents that accessed the instrument via the QR code, we compared the experimental groups overall.
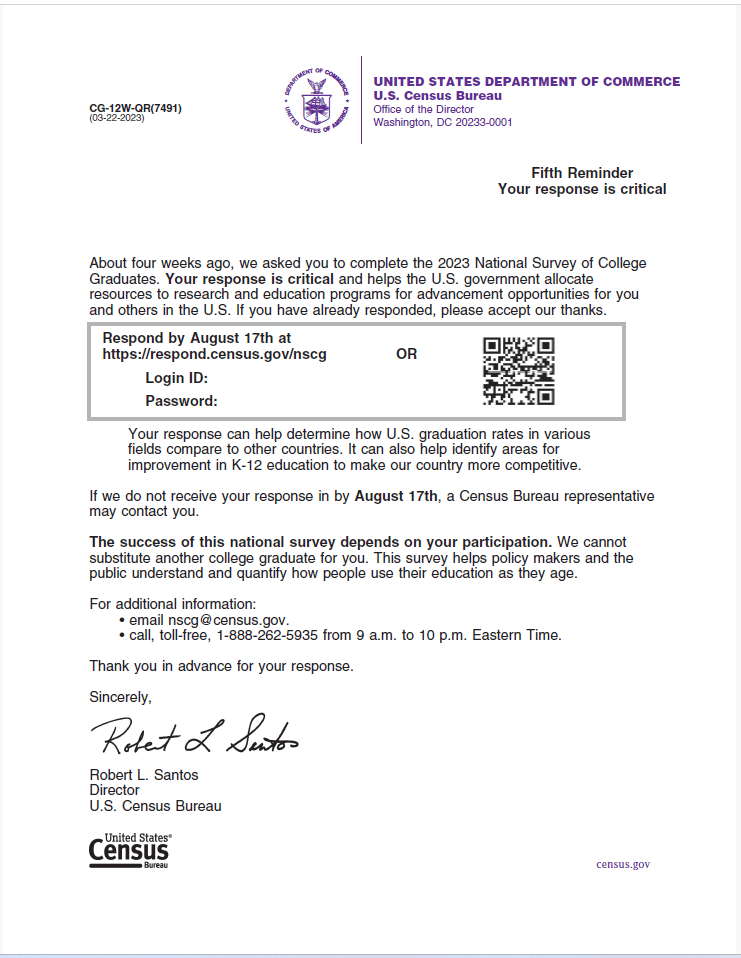
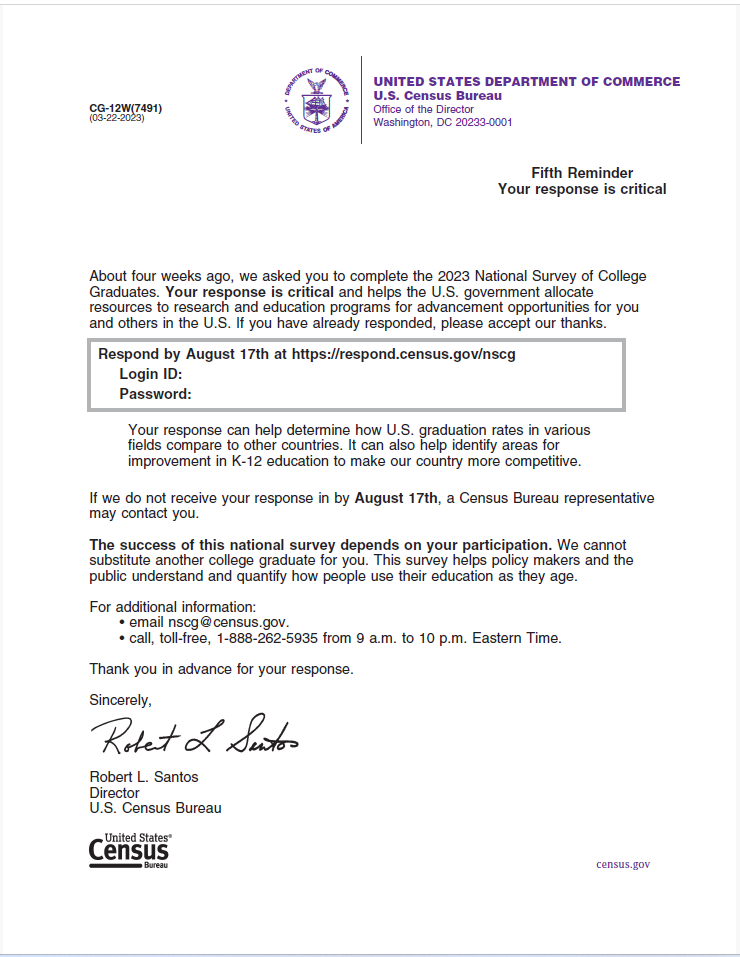
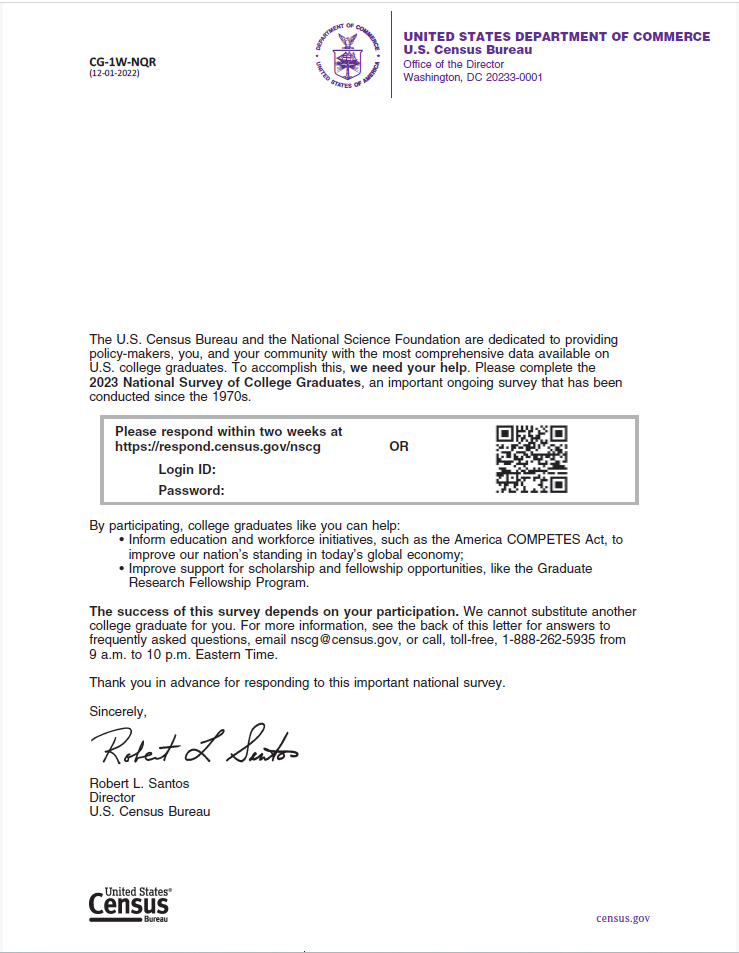
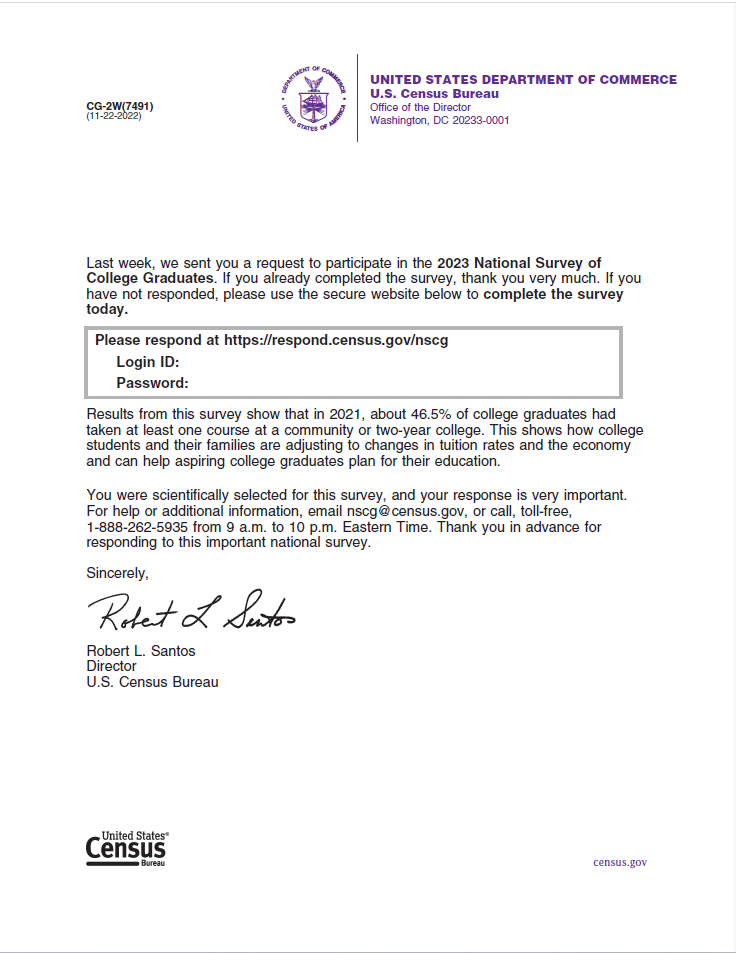
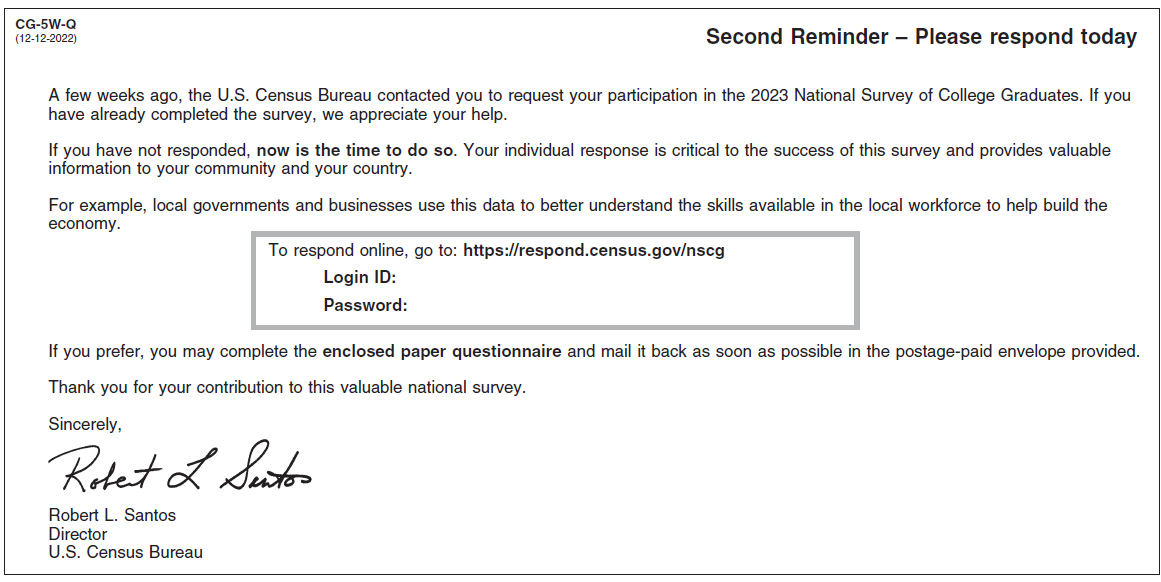
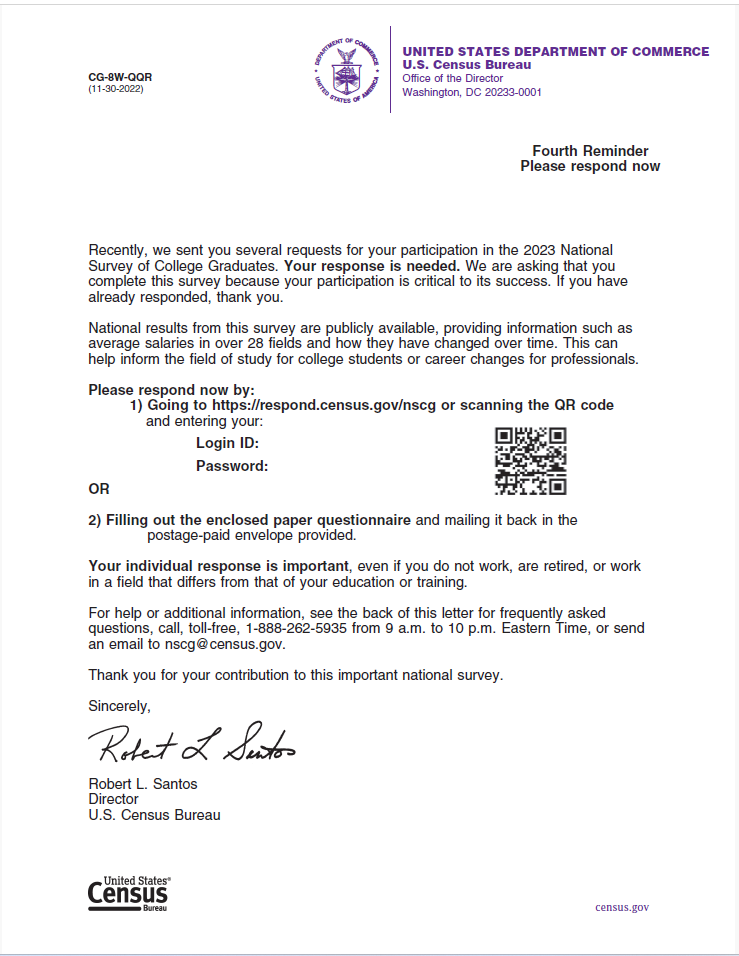
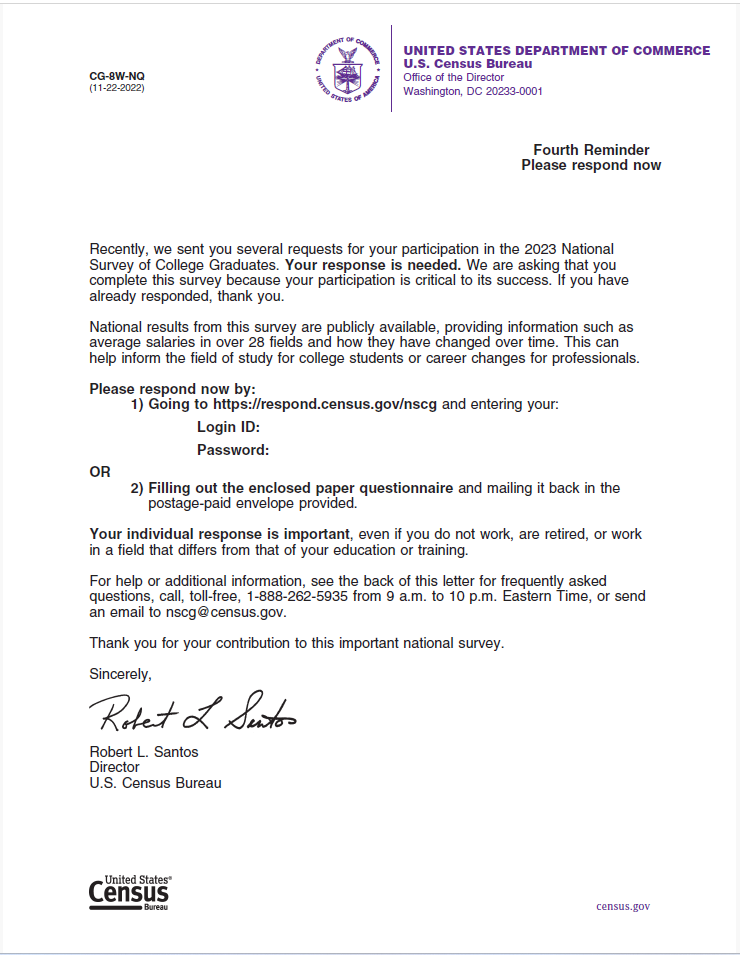
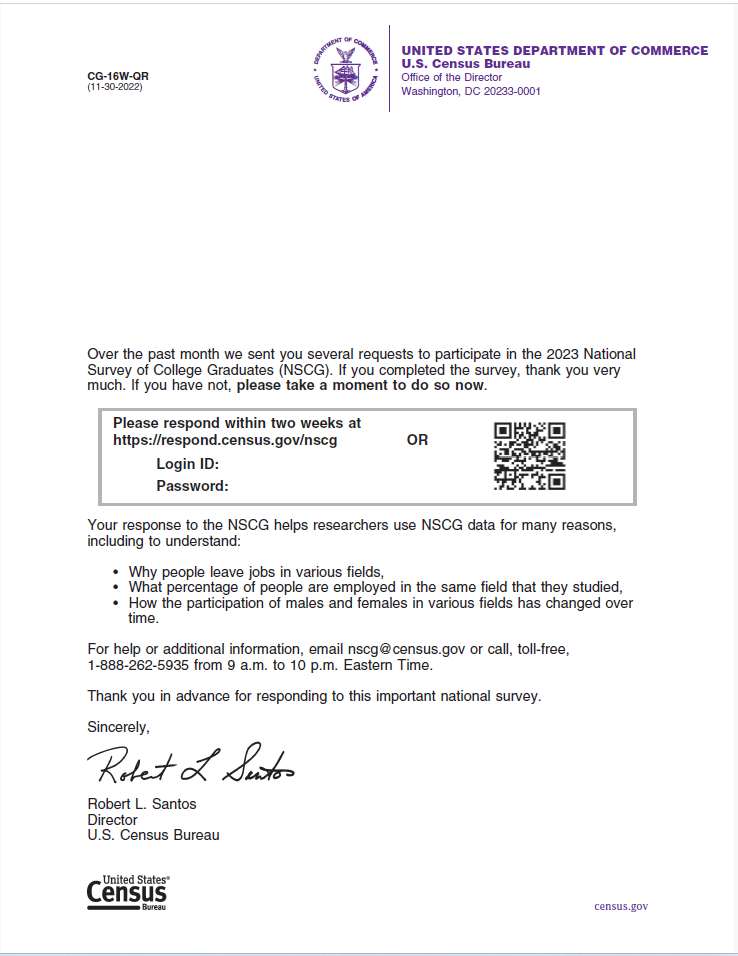
The NSCG contacted sample members through different types of mailings at different points in time (Appendix E). Due to the operational complexities7 of embedding multiple experiments in 2023, the QR code experiment was only conducted among new cohort cases with a mailable address (n=54,500). While the planned difference between the control and treatment groups was only the inclusion of QR codes in the letter, only mailings in week 1 and week 12 strictly adhered to this (Appendix F). Other mailings had minor wording differences between the control and treatment groups (Appendix G).8 For example, in week 5, the control group used the language, “To respond online, go to: https://respond.census.gov/nscg” while the treatment group used the language, “Please respond within two weeks at https://respond.census.gov/nscg.” We believe that this did not impact the experiment because the differences were only on some letters and were innocuous.
This section presents the results of the experiment.
First, we evaluated whether the QR code affected the overall response rates. Table 2 shows that the overall response rates between the treatment and control groups are not statistically different (p=0.66) from each other.
Experimental Group |
Number of Respondents |
Response Rate (Standard Error) |
P-value |
URL only |
22,000 |
57.1 (0.8) |
0.66 |
URL and QR code |
3,400 |
57.9 (1.7) |
*Statistically significant at alpha 0.10
Source(s):
U.S. Census Bureau, 2023 National Survey of College Graduates QR code Experiment
Next, we looked at how many days it took people in the control and treatment groups to complete the survey online (Table 3). We did not see evidence that the treatment group completed the survey in fewer days (p=0.34). The unweighted weekly collection rates, graphed in Appendix A, Figure 1, are very similar between the two groups.
Table 3: Mean days to complete online
Experimental Group |
Number of Web Respondents |
Mean days to complete (standard error) |
P-value |
URL only |
19,500 |
36.5 (1.2) |
0.34 |
URL and QR code |
3,100 |
37.6 (2.5) |
*Statistically significant at alpha 0.10
Source(s):
U.S. Census Bureau, 2023 National Survey of College Graduates QR code Experiment
We then reviewed whether incorporating QR codes increased mobile device usage. Our analysis revealed a statistically significant higher percentage of mobile device users in the treatment group than in the control group (Table 4). Consequently, this implied a lower percentage of computer responses in the treatment group than the control group. We also found that more users in the treatment group spent a majority of their time in the instrument using a mobile device compared to the control group (Appendix B, Table 8).
Table 4: Mobile device as the first device use rate
Experimental Group |
Number of Users |
Mobile Use Rate (Standard Error) |
P-value |
URL only |
23,500 |
25.5 (1.1) |
<.0001* |
URL and QR code |
3,800 |
53.8 (2.7) |
*Statistically significant at alpha 0.10
Note(s):
The number of users include those who accessed the survey online and either completed or broke off from the survey.
Source(s):
U.S. Census Bureau, 2023 National Survey of College Graduates QR code Experiment
We performed chi-square tests on the distributions of all sample members, regardless of response status, to assess any baseline differences between the groups prior to the start of data collection. At the start of the data collection, no differences were found.9 We then moved on to see whether the respondents in the treatment and control groups differed with the introduction of QR codes.
Using a one-sided t-test, we did not find more younger respondents (i.e., less than 40 years old) within the treatment group (Table 5). We then investigated in general whether other demographic differences in the distribution of respondents exist. Using chi-square tests, our analysis revealed no statistically significant differences among any of the demographic groups (Appendix C, Tables 10- 19). This indicates that the presence of the QR code did not alter the overall demographic composition.
Table 5: Percent of respondents that in the younger category
Experimental Group |
Number of Respondents |
Younger Respondent Rate (Standard Error) |
P-value |
URL only |
22,000 |
31.8 (1.3) |
0.35 |
URL and QR code |
3,400 |
33.0 (2.7) |
*Statistically significant at alpha 0.10
Source(s):
U.S. Census Bureau, 2023 National Survey of College Graduates QR code Experiment
Finally, we looked at whether introducing QR codes caused more breakoffs. Table 6 shows that contrary to our hypothesis, the treatment group had fewer breakoffs compared to the control group.
Experimental Group |
Number of Users |
Breakoff Rate (Standard Error) |
P-value |
URL only |
23,500 |
8.8 (0.5) |
0.09* |
URL and QR code |
3,800 |
7.4 (0.9) |
*Statistically significant at alpha 0.10
Note(s):
The number of users include those who accessed the survey online and either completed or broke off from the survey.
Source(s):
U.S. Census Bureau, 2023 National Survey of College Graduates QR code Experiment
Our findings indicate that the inclusion of QR codes in the 2023 NSCG increased the number of mobile respondents, which is consistent with existing literature. Contrary to existing literature regarding concerns with mobile device response, we found that those who received a QR code in their invitation were less likely to breakoff. No significant effects were observed regarding other engagement activities or demographic differences. Specifically, the QR code intervention did not attract a younger demographic or expedite completion times.
Because of the increase in mobile responses brought in by the QR code inclusion in mailing materials, it is crucial to understand how that shift could affect data quality beyond breakoffs. In the literature, there exist some concerns with the quality of data collected on mobile devices. Specifically, we found concerns regarding response fatigue and attention span of mobile respondents (Guidry, 2012; Mavletova, 2013; Struminskaya, Weyandt, & Bosnjak, 2015). Al Ghamdi et. al (2016) also found that information presented on mobile devices affect clarity of information organization, reading time, and user’s ability to recall information.
Alternatively, other studies show no significant difference between data quality for mobile respondents versus computer respondents (Antoun, 2015; Sommer, Diedenhofen, & Much, 2017). Antoun, Couper, and Conrad (2017) found that while the smartphone context can be distracting, respondents are still able to provide high quality responses as long as usability is taken into consideration during survey design.
Given the varying literature and potential implications of mobile device on data quality, we do not recommend implementing the use of QR codes in production until we can confirm that the push to mobile device use is not likely to cause a decrease in data quality.
Al Ghamdi, E., Yunus, F., Da’Ar, O., El-Metwally, A., Khalifa, M., Aldossari, B., & Househ, M. (2016). The effect of screen size on mobile phone user comprehension of health information and application structure: An experimental approach. Journal of medical systems, 40, 1-8.
Antoun, C. (2015). Mobile Web Surveys: A First Look at Measurement, Nonresponse, and Coverage Errors (Doctoral dissertation).
Endres, K., Heiden, E. O., Park, K., Losch, M. E., Harland, K. K., & Abbott, A. L. (2023). Experimenting with QR Codes and Envelope Size in Push-to-Web Surveys. Journal of survey statistics and methodology, smad008.
Gostin I. (2021), “How the Pandemic Saved the QR Code from Extinction,” Forbes. Available at https://www.forbes.com/sites/forbescommunicationscouncil/2021/03/25/how-the-pandemic-saved-the-qr-code-from-extinction/?sh=798fc0f46905.
Guidry, K. R. (2012, May). Response quality and demographic characteristics of respondents using a mobile device on a web-based survey. In AAPOR Annual Conference.
Lugtig, P., & Luiten, A. (2021). Do shorter stated survey length and inclusion of a QR code in an invitation letter lead to better response rates?. Survey Methods: Insights from the Field (SMIF).
Mavletova, A. (2013). Data Quality in PC and Mobile Web Surveys. Social Science Computer Review, 31(6), 725-743. https://doi.org/10.1177/0894439313485201
Marlar, J. (2018). Do Quick Response Codes Enhance or Hinder Surveys? Gallup Methodology blog, August 30, 2018. https://news.gallup.com/opinion/methodology/241808/quick-response-codes-enhance-hinder-surveys.aspx
Smith, P. (2017). An experimental examination of methods for increasing response rates in a push-to-web survey of sport participation. Paper presented at the 28th Workshop on Person and Household Nonresponse, Utrecht, the Netherlands.
Sommer, J., Diedenhofen, B., & Musch, J. (2017). Not to Be Considered Harmful: Mobile-Device Users Do Not Spoil Data Quality in Web Surveys. Social Science Computer Review, 35(3), 378-387.
Struminskaya, B., Weyandt, K., & Bosnjak, M. (2015). The Effects of Questionnaire Completion Using Mobile Devices on Data Quality. Evidence from a Probability-based General Population Panel. methods, data, analyses, 9(2), 32. https://doi.org/10.12758/mda.2015.014
U.S. Census Bureau. (2023). National Survey of College Graduates Methodology. Retrieved from https://www.census.gov/programs-surveys/nscg/tech-documentation/methodology.html
U.S. Census Bureau. (2022). Week 25. Internal report: unpublished.
U.S. Census Bureau. (2021). NSCG processing report. Internal report: unpublished.
Appendix A: Response Rates
We calculated the overall weighted response rates10 using Equation 1.
Equation 1: Response Rate
Response
Rate =
 where,
ER: Eligible Respondent
ENR: Eligible Nonrespondent
e: Estimated proportion of cases with unknown eligibility (UE) expected to be eligible.
The proportion of cases with unknown eligibility expected to be eligible (e) was estimated using the following equation:

where, IE is Ineligible cases that were eligible for initial NSCG mailing but, after responding, were deemed ineligible for the survey.
This weighted response rate used eligible respondents in the numerator (final disposition codes between 50 and 54 in Table 7). The denominator also included eligible respondents as well as eligible nonrespondents (final disposition greater than or equal to 94 in Error: Reference source not found7) and an estimate of the proportion of unknown eligibility cases expected to be eligible (cases classified with unknown eligibility are final disposition codes between 80 and 89 in Error: Reference source not found7). This proportion was estimated using the sum of respondents and nonrespondents divided by the sum of all sampled persons (including those deemed ineligible with final disposition codes between 60 and 79 in Error: Reference source not found7) then multiplied by the sum of unknown eligibility.
Table 7: Disposition codes for eligible and ineligible respondents
Status |
Disposition Code |
Description |
Eligible Respondents |
50 |
Eligible complete – mail |
51 |
Eligible complete – CATI |
|
52 |
Eligible complete – web |
|
54 |
Eligible complete – TQA incoming call interview via CATI |
|
Ineligibles |
60 |
Emigrant – mail |
61 |
Emigrant – CATI |
|
62 |
Emigrant – web |
|
64 |
Emigrant – incomplete (TQA / locating / correspondence) |
|
65 |
Temporarily institutionalized |
|
67 |
Terminally ill / permanently institutionalized |
|
68 |
Over 75 years old |
|
69 |
Deceased |
|
70 |
Degree ineligible – no baccalaureate or higher degree earned |
|
71 |
Frame ineligible – earliest degree earned after ACS interview year |
|
78 |
Duplicate |
|
79 |
Other confirmed ineligible |
|
Unknown Eligibility |
80 |
Unable to locate |
81 |
SPV failure – wrong sampled person (FINAL) |
|
82 |
Language / hearing barrier |
|
83 |
Noncontact – eligibility unknown |
|
84 |
Temporarily ill / absent and unable to confirm eligibility |
|
85 |
Final refusal and unable to confirm eligibility |
|
86 |
Congressional refusal and unable to confirm eligibility |
|
87 |
Unable to confirm eligibility and/or confirm reached correct SP - Mail |
|
88 |
Unable to confirm eligibility and/or confirm reached correct SP - Web |
|
89 |
Other nonresponse and unable to confirm eligibility |
|
Eligible Nonrespondents |
94 |
Eligible and temporarily ill / absent |
95 |
Eligible and final refusal -- CATI |
|
96 |
Eligible and congressional refusal |
|
97 |
Eligible and missing critical complete items - Mail |
|
98 |
Eligible and missing critical complete items - Web |
|
99 |
Other confirmed eligible nonresponse |
Source(s):
U.S. Census Bureau, 2021 National Survey of College Graduates Prenotice Experiment
We calculated the average number of days it took cases to complete online using Equation 2.
Equation 2: Mean Days to Complete Online

Error: Reference source not found graphs the unweighted weekly collection rates for the new cohort over the data collection period.
Figure 1: New cohort unweighted weekly collection rates for 2023 NSCG data collection
Source(s):
U.S. Census Bureau 2023 National Survey of College Graduates QR Code Experiment Final Report
Appendix B: Device Use Rates
Equation 3: Percentage of Users who used a Mobile Device for their First Login
Equation 4: Percentage of Users with a Mobile Device as their Longest Device Used

Table 8 shows the percentage of users with a mobile device as their longest device used for each experimental group.
Table 8: Mobile device as the longest device use rate
Experimental Group |
Number of Users |
Mobile Use Rate (Standard Error) |
P-value |
URL only |
23,500 |
25.2 (1.1) |
<.0001* |
URL and QR code |
3,800 |
52.6 (2.8) |
*Statistically significant at alpha 0.10
Note(s):
The number of users include those who accessed the survey online and either completed or broke off from the survey.
Source(s):
U.S. Census Bureau, 2023 National Survey of College Graduates QR code Experiment
Appendix C: Demographic Variables
Table 9: Demographic variables |
|||
Variable |
Range |
Type |
Description |
Race
|
1-6 |
Categorical, nominal |
1=White 4=AIAN 2=Black 5=NHPI 3=Asian 6=Others |
Highest Degree
|
1-3 |
Categorical, ordinal |
1= Bachelor’s or professional degree 2= Master’s degree 3= Doctorate degree |
Science and engineering (S&E) Occupation |
1, 2 |
Categorical, binary |
1 = S&E occupation 2 = Non-S&E related occupation
|
Citizen status at birth flag
|
1,2 |
Categorical, binary |
1=U.S. citizen at birth 2=Not a U.S. citizen at birth |
Disability status
|
1,2 |
Categorical, binary |
1 = With disability 2 = No disability |
Hispanic origin flag
|
1,2 |
Categorical, binary |
1= Hispanic 2= Not Hispanic |
Broad occupation group
|
18 categ. |
Categorical, nominal |
11 = mathematical scientists 12 = computer and information scientists 20 = life scientists 30 = physical scientists 40 = social scientists, except psychologists 41 = psychologists 50 = engineers 61 = S&E-related health occupations 62 = S&E-related non-health occupations 71 = postsecondary teacher in an S&E field 72 = postsecondary teacher in a non-S&E field 73 = secondary teacher in an S&E field 74 = secondary teacher in a non-S&E field 81 = non-S&E high interest occupation, S&E FOD 82 = non-S&E low interest occupation, non-S&E FOD 83 = non-S&E occupation, non-S&E FOD 91 = not working, S&E FOD or S&E previous occupation 92= not working, non-S&E FOD and non-S&E previous occupation or never worked |
Young graduate oversample group eligibility indicator
|
1,2 |
Categorical, binary |
1 = S&E case that has earned a bachelor’s or master’s degree in the last five years 2 = non-S&E case or S&E case that has not earned a bachelor’s or master’s degree in the last five years |
Sex
|
1,2 |
Categorical, binary |
1=Male 2=Female |
Work status
|
1,2,3 |
Categorical, nominal |
1=Employed 2=Unemployed 3=Not in the labor force |
Tables 10-19 show the weighted demographic respondent distributions along with their respective Rao-Scott Chi-square p-values.
Table 10: Weighted respondent distributions for race
Race |
Experimental Groups |
|||
URL only |
URL + QR code |
|||
|
Number of Respondents |
Percent (SE) |
Number of Respondents |
Percent (SE) |
White |
11,500 |
74.0 (0.8) |
1,800 |
75.5 (2.1) |
Black |
3,100 |
6.9 (0.3) |
450 |
6.4 (0.8) |
Asian |
3,700 |
9.9 (0.4) |
600 |
9.8 (1.0) |
AIAN/ NHPI/ Other |
3,600 |
9.2 (0.7) |
600 |
8.3 (1.2) |
Chi-square p-value = 0.86
Source(s):
U.S. Census Bureau, 2023 National Survey of College Graduates QR code Experiment
Table 11: Weighted respondent distributions for highest degree
Highest Degree |
Experimental Groups |
|||
URL only |
URL + QR code |
|||
|
Number of Respondents |
Percent (SE) |
Number of Respondents |
Percent (SE) |
Bachelor’s or professional degree |
12,000 |
66.0 (0.7) |
1,900 |
68.1 (2.2) |
Master’s degree |
7,800 |
29.3 (0.6) |
1,200 |
27.5 (2.1) |
Doctorate degree |
2,300 |
4.8 (0.1) |
350 |
4.4 (0.4) |
Chi-square p-value = 0.57
Source(s):
U.S. Census Bureau, 2023 National Survey of College Graduates QR code Experiment
Table 12: Weighted respondent distributions for science and engineering occupation
S&E Occupation |
Experimental Groups |
|||
URL only |
URL + QR code |
|||
|
Number of Respondents |
Percent (SE) |
Number of Respondents |
Percent (SE) |
S&E occupation |
13,000 |
26.8 (0.5) |
2,000 |
25.2 (1.8) |
Non-S&E occupation |
9,100 |
73.2 (0.5) |
1,500 |
74.8 (1.8) |
Chi-square p-value = 0.43
Source(s):
U.S. Census Bureau, 2023 National Survey of College Graduates QR code Experiment
Table 13: Weighted respondent distributions for citizenship status
Citizenship Status |
Experimental Groups |
|||
URL only |
URL + QR code |
|||
|
Number of Respondents |
Percent (SE) |
Number of Respondents |
Percent (SE) |
U.S. citizen at birth |
17,000 |
85.9 (0.3) |
2,600 |
85.7 (1.2) |
Not a citizen at birth |
5,000 |
14.1 (0.3) |
800 |
14.3 (1.2) |
Chi-square p-value = 0.89
Source(s):
U.S. Census Bureau, 2023 National Survey of College Graduates QR code Experiment
Table 14: Weighted respondent distributions for disability status
Disability Status |
Experimental Groups |
|||
URL only |
URL + QR code |
|||
|
Number of Respondents |
Percent (SE) |
Number of Respondents |
Percent (SE) |
With disability |
2,000 |
6.3 (0.2) |
300 |
6.1 (0.8) |
No disability |
20,000 |
93.7 (0.2) |
3,100 |
93.9 (0.8) |
Chi-square p-value = 0.82
Source(s):
U.S. Census Bureau, 2023 National Survey of College Graduates QR code Experiment
Table 15: Weighted respondent distributions for Hispanic origin
Hispanic Origin |
Experimental Groups |
|||
URL only |
URL + QR code |
|||
|
Number of Respondents |
Percent (SE) |
Number of Respondents |
Percent (SE) |
Hispanic |
4,600 |
8.3 (0.3) |
750 |
8.6 (1.0) |
Not Hispanic |
17,500 |
91.7 (0.3) |
2,700 |
91.4 (1.0) |
Chi-square p-value = 0.78
Source(s):
U.S. Census Bureau, 2023 National Survey of College Graduates QR code Experiment
Table 16: Weighted respondent distributions for broad occupation category
Broad Occupation Category |
Experimental Groups |
|||
URL only |
URL + QR code |
|||
|
Number of Respondents |
Percent (SE) |
Number of Respondents |
Percent (SE) |
Mathematical scientists |
400 |
0.6 (0.1) |
80 |
0.7 (0.1) |
Computer and information sciences |
2,600 |
5.1 (0.2) |
400 |
5.1 (0.4) |
Life scientists |
550 |
0.5 (<0.1) |
90 |
0.5 (0.1) |
Physical scientists |
850 |
0.8 (<0.1) |
150 |
0.8 (0.1) |
Social scientists, except psychologists |
200 |
0.2 (<0.1) |
40 |
0.2 (0.0) |
Psychologists |
350 |
0.4 (<0.1) |
40 |
0.3 (0.1) |
Engineers |
1,700 |
2.8 (0.1) |
250 |
2.8 (0.4) |
S&E-related health occupations |
3,600 |
9.2 (0.2) |
550 |
8.7 (0.7) |
S&E-related non-health occupations |
1,000 |
2.7 (0.1) |
150 |
1.9 (0.3) |
Postsecondary teacher in an S&E field |
1,100 |
1.2 (0.1) |
(D) |
(D) |
Postsecondary teacher in a non-S&E field |
100 |
1.0 (0.3) |
(D) |
(D) |
Secondary teacher in an S&E field |
250 |
0.8 (0.1) |
(D) |
(D) |
Secondary teacher in a non-S&E field |
40 |
1.4 (0.4) |
(D) |
(D) |
Non-S&E high interest occupation, S&E FOD |
3,100 |
12.2 (0.3) |
500 |
12.6 (1.0) |
Non-S&E low interest occupation, non-S&E FOD |
2,800 |
8.0 (0.2) |
450 |
7.5 (0.8) |
Non-S&E occupation, non-S&E FOD |
1,200 |
35.1 (0.9) |
200 |
37.7 (3.7) |
Not working, S&E FOD or S&E previous occupation |
1,300 |
8.8 (0.3) |
200 |
9.4 (1.0) |
Not working, non-S&E FOD and non-S&E previous occupation or never worked |
650 |
9.2 (0.5) |
90 |
8.5 (1.6) |
Chi-square p-value = 0.79
Source(s):
U.S. Census Bureau, 2023 National Survey of College Graduates QR code Experiment
Table 17: Weighted respondent distributions for oversample indicator
Oversample Indicator |
Experimental Groups |
|||
URL only |
URL + QR code |
|||
|
Number of Respondents |
Percent (SE) |
Number of Respondents |
Percent (SE) |
S&E case that has earned a bachelor’s or master’s degree in the last five years |
7,300 |
7.7 (0.2) |
1,100 |
7.6 (0.6) |
Non-S&E case, or S&E case that has not earned a bachelor’s or master’s degree in the last five years |
14,500 |
92.3 (0.2) |
2,300 |
92.4 (0.6) |
Chi-square p-value = 0.90
Source(s):
U.S. Census Bureau, 2023 National Survey of College Graduates QR code Experiment
Table 18: Weighted respondent distributions for sex
Sex |
Experimental Groups |
|||
URL only |
URL + QR code |
|||
|
Number of Respondents |
Percent (SE) |
Number of Respondents |
Percent (SE) |
Male |
10,500 |
44.7 (0.9) |
1,700 |
44.9 (3.0) |
Female |
11,000 |
55.3 (0.9) |
1,800 |
55.1 (3.0) |
Chi-square p-value = 0.96
Source(s):
U.S. Census Bureau, 2023 National Survey of College Graduates QR code Experiment
Table 19: Weighted respondent distributions for work status
Work Status |
Experimental Groups |
|||
URL only |
URL + QR code |
|||
|
Number of Respondents |
Percent (SE) |
Number of Respondents |
Percent (SE) |
Employed |
19,000 |
77.4 (0.6) |
3,000 |
78.1 (1.9) |
Unemployed |
500 |
2.6 (0.3) |
70 |
2.4 (0.7) |
Not in the labor force |
2,200 |
20.0 (0.6) |
350 |
19.5 (1.8) |
Chi-square p-value = 0.92
Source(s):
U.S. Census Bureau, 2023 National Survey of College Graduates QR code Experiment
Appendix D: Breakoff Rates
Equation 5: Breakoff Rate

Appendix E: NSCG Mailing Schedule and Mailing Materials
Table 20 below shows the dates, weeks, and types of mailing for 2023.
Table 20: 2023 NSCG mailing schedule
Date |
Week |
Description |
5/18/2023 |
0 |
Prenotice |
5/25/2023
|
1 |
Web Invite, New Sample with QR code |
Web Invite, New Sample without QR code |
||
Incentive Web Invite, New Sample with QR code |
||
Incentive Web invite, New Sample without QR code
|
||
Web Invite, BP no QR code |
||
Incentive BP, no QR code |
||
Web Invite, Returning Sample |
||
Incentive Web Invite, Returning Sample |
||
6/1/2023
|
2 |
Perforated, no incentive language, older demographic, both cohorts, no QR code |
Perforated, incentive language, older demographic, both cohorts, no QR code |
||
Perforated, no incentive language, younger demographic, both cohorts, no QR code |
||
Perforated, incentive language, + younger demographic, both cohorts, no QR code |
||
Perforated no incentive language older demographic, new cohort, QR code |
||
Perforated no incentive language older demographic, BP |
||
Perforated, incentive language, older demographic, new cohort, QR code |
||
Perforated incentive language older demographic, BP |
||
Perforated, no incentive language, younger demographic, new cohort, QR code |
||
Perforated, no incentive language, younger demographic, BP |
||
Perforated, incentive language, younger demographic, new cohort, QR code |
||
Perforated incentive language, younger demographic BP |
||
6/22/2023 |
5 |
Web invite, ACS style envelope, old cohort and new cohort without QR code |
|
Web invite, ACS style envelope, new cohort, QR code |
|
|
Web invite, ACS style envelope, BP, no QR code |
|
|
Questionnaire (22 only), and web invite |
|
6/29/2023 |
6 |
Reminder Postcard |
7/13/2023 |
8 |
Questionnaire and Web Invite (22, 23), old cohort |
|
Questionnaire and Web invite (21), new cohort, QR code |
|
|
Questionnaire and Web invite (21), new cohort, no QR code |
|
|
BP perforated, no Q |
|
8/10/2023 |
12 |
Perforated, Web Invite, old cohort and new cohort (no QR code) |
|
Perforated, Web Invite, new cohort, QR code |
|
|
Perforated, Web invite, BP |
|
9/7/2023 |
16 |
Web invite, new cohort, no QR code |
|
Web invite, new cohort, QR code |
|
|
Web invite, BP |
|
9/21/2023 |
18
|
Web Invite, returning sample (22 and 23) |
10/5/2023 |
20 |
Web Invite, new sample, Priority envelope, questionnaire (21), no QR code |
|
Web Invite, new sample, Pseudo Certified envelope, questionnaire (21), no QR code |
|
|
Web Invite, new sample, Priority cardboard envelope, questionnaire (21), no QR code |
|
|
Web Invite, new sample, Priority envelope, questionnaire, (21), QR code |
|
|
Web Invite, new sample, Pseudo Certified envelope, questionnaire (21), QR code |
|
|
Web Invite, new sample, Priority cardboard envelope, questionnaire (21), QR code |
|
|
Web Invite, BP, no Q |
|
10/26/2023 |
23 |
Web Invite, older demographic, old cohort and new cohort (no QR code) |
|
Web invite, younger demographic, old cohort and new cohort (no QR code) |
|
|
Web invite, older demographic, new cohort, QR code |
|
|
Web invite, older demographic, BP, no QR code |
|
|
Web invite, younger demographic, new cohort QR code |
|
|
Web invite, younger demographic, BP, no QR code |
Source(s):
U.S. Census Bureau 2023 National Survey of College Graduates QR Code Experiment
Appendix F: Mailings from Week One and Twelve where difference was only the inclusion of the QR code image
Week 1, Web Invite, New Sample with QR code
Week 1, Web Invite, New Sample without QR code
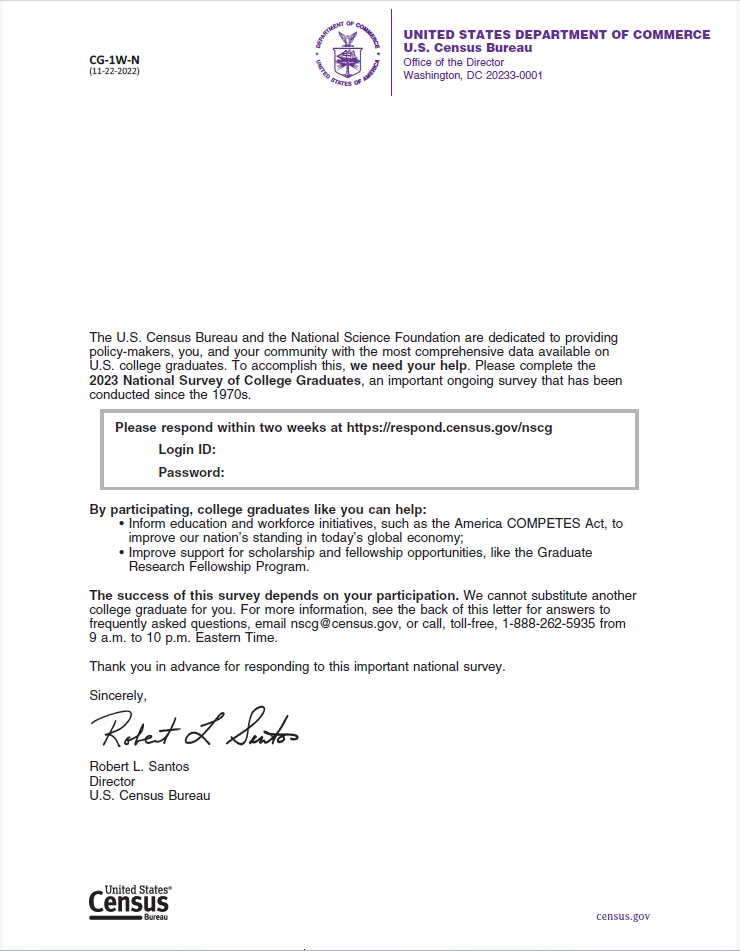
Week 1, Incentive Web Invite, New Sample with QR code
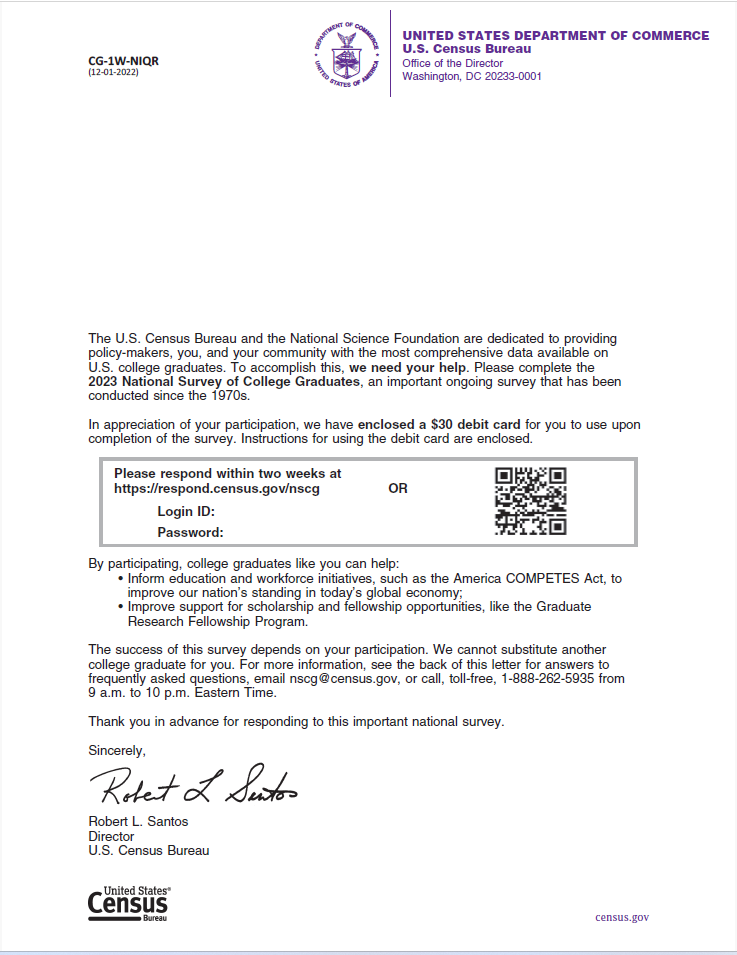
Week 1, Incentive Web invite, New Sample without QR code
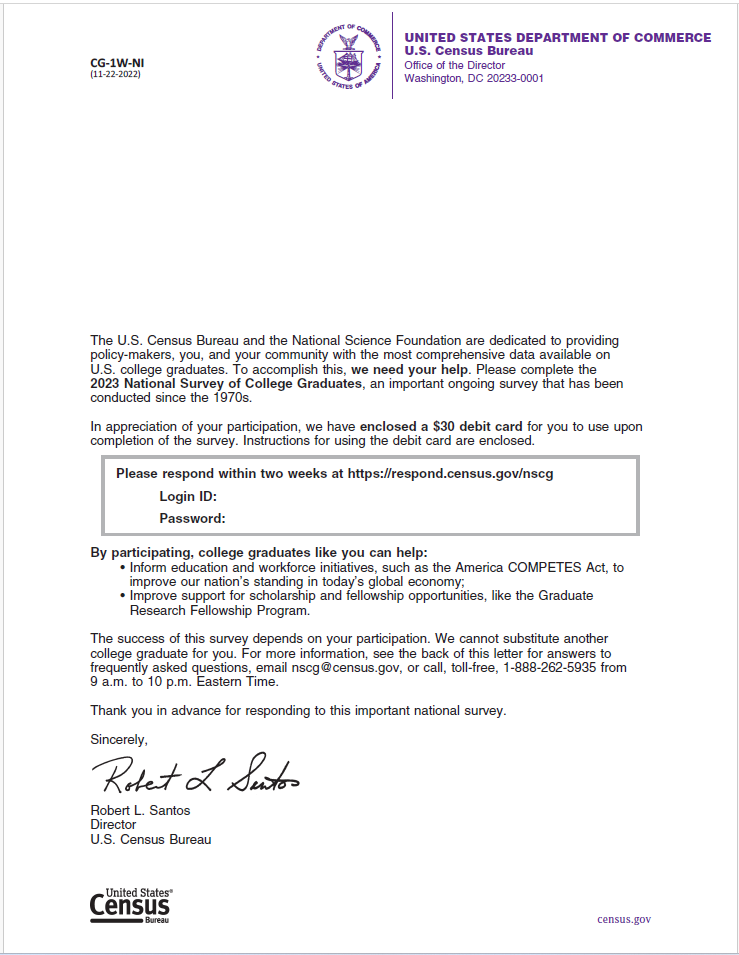
Week 12, perforated, Web Invite, new cohort, QR code
|
Week 12, perforated, Web Invite, old cohort and new cohort (no QR code)
|
Appendix G: Mailings from Other Weeks that Included Additional Differences than just the QR code
Week 2, perforated no incentive language older demographic, new cohort, QR code
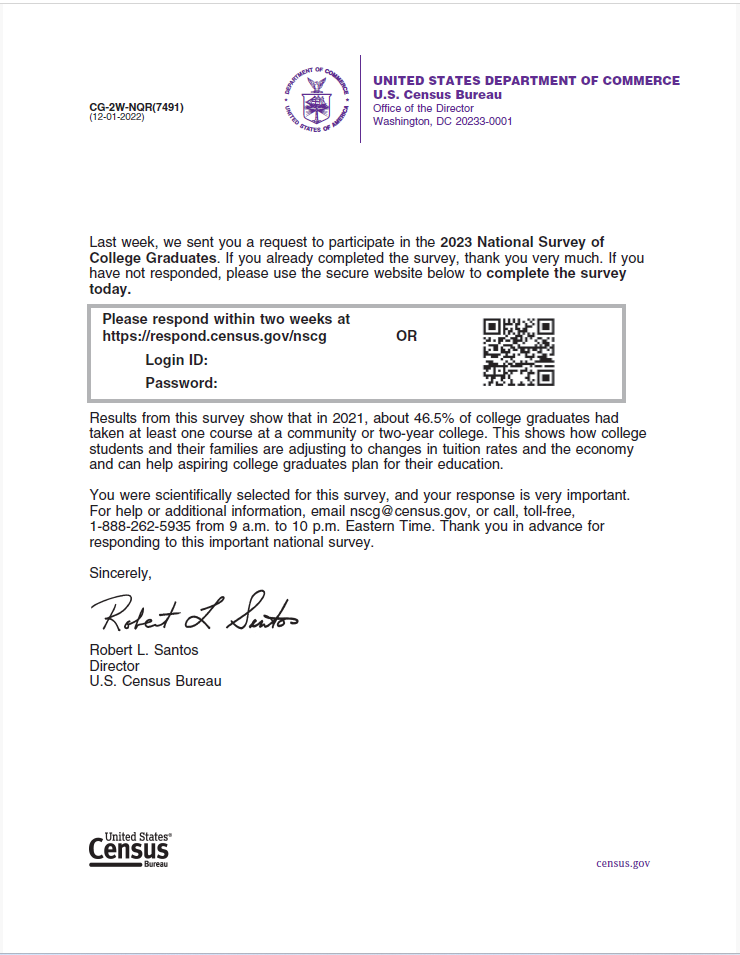
Week 2, perforated, no incentive language, older demographic, both cohorts, no QR code
Week 2, perforated, incentive language, older demographic, new cohort, QR code
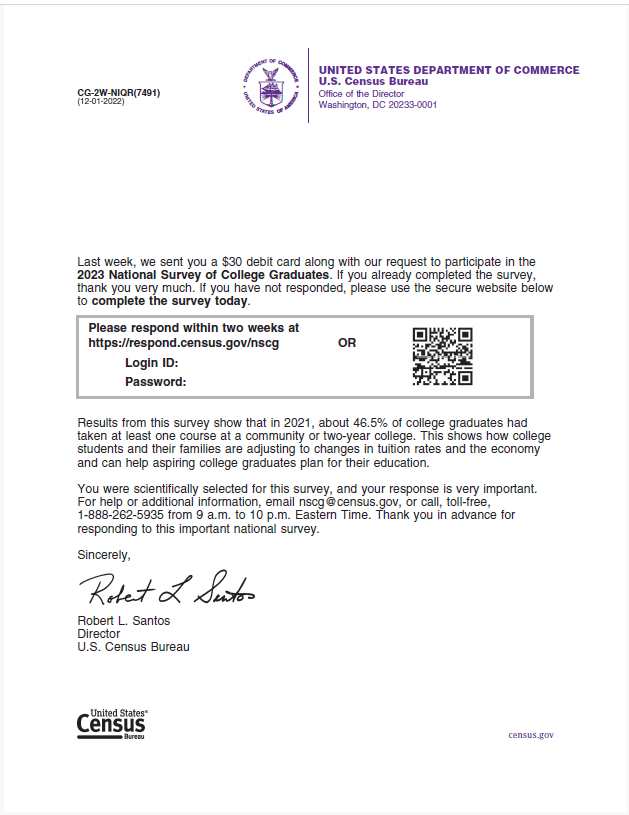
Week 2, perforated, incentive language, older demographic, both cohorts, no QR code
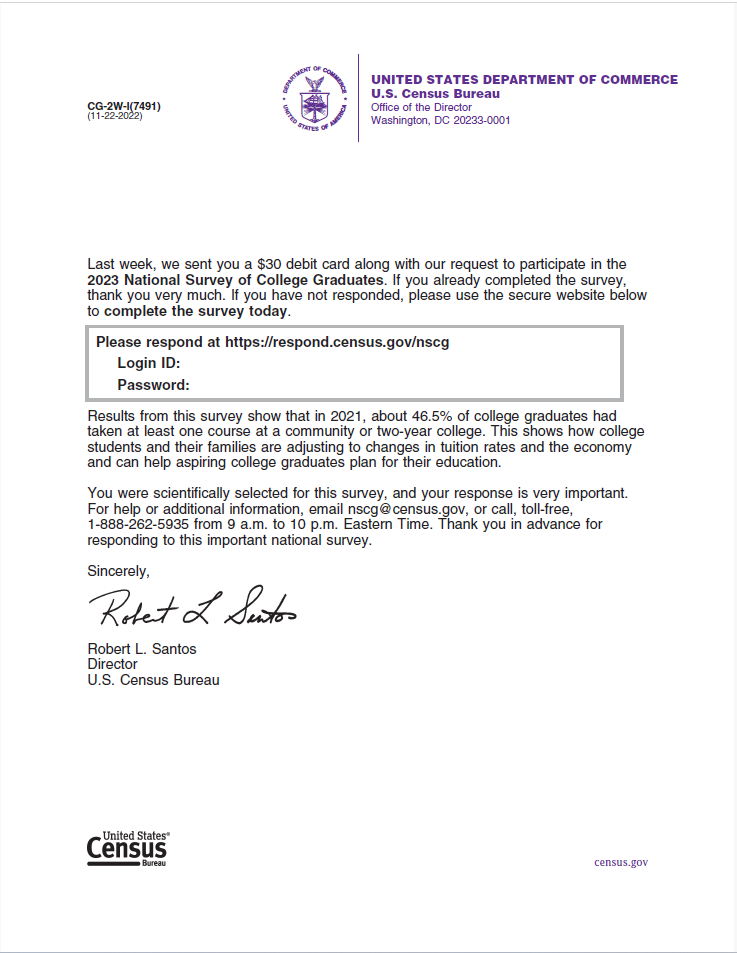
Week 2, perforated, no incentive language, younger demographic, new cohort, QR code
Week 2 perforated, no incentive language, younger demographic, both cohorts, no QR code
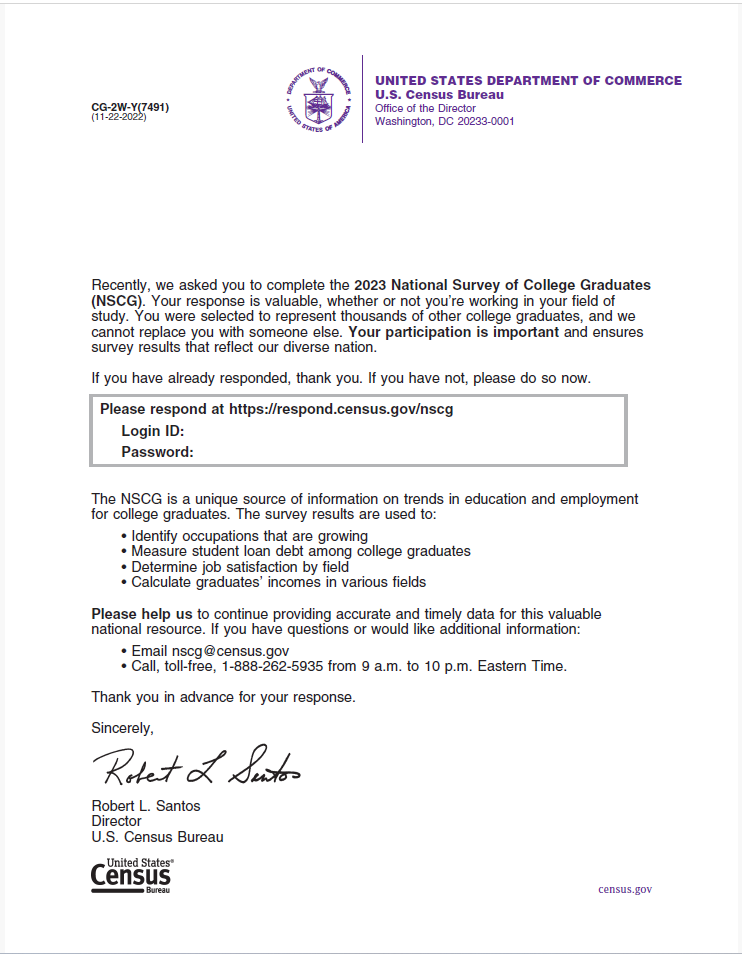
Week 2, perforated, incentive language, younger demographic, new cohort, QR code
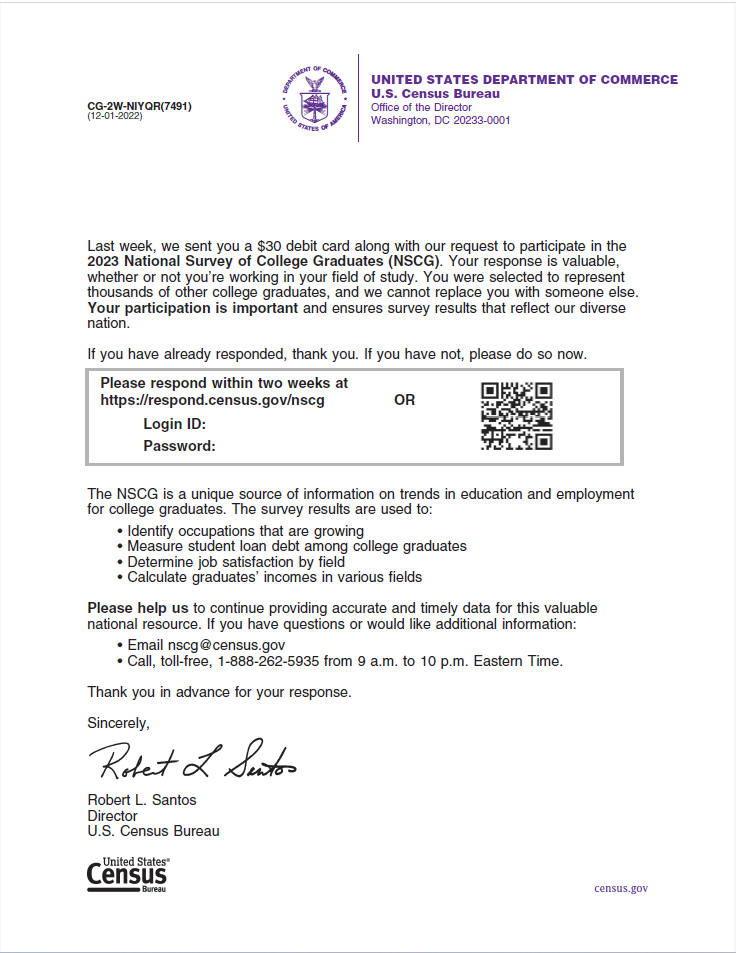
Week 2 perforated, incentive language, + younger demographic, both cohorts, no QR code
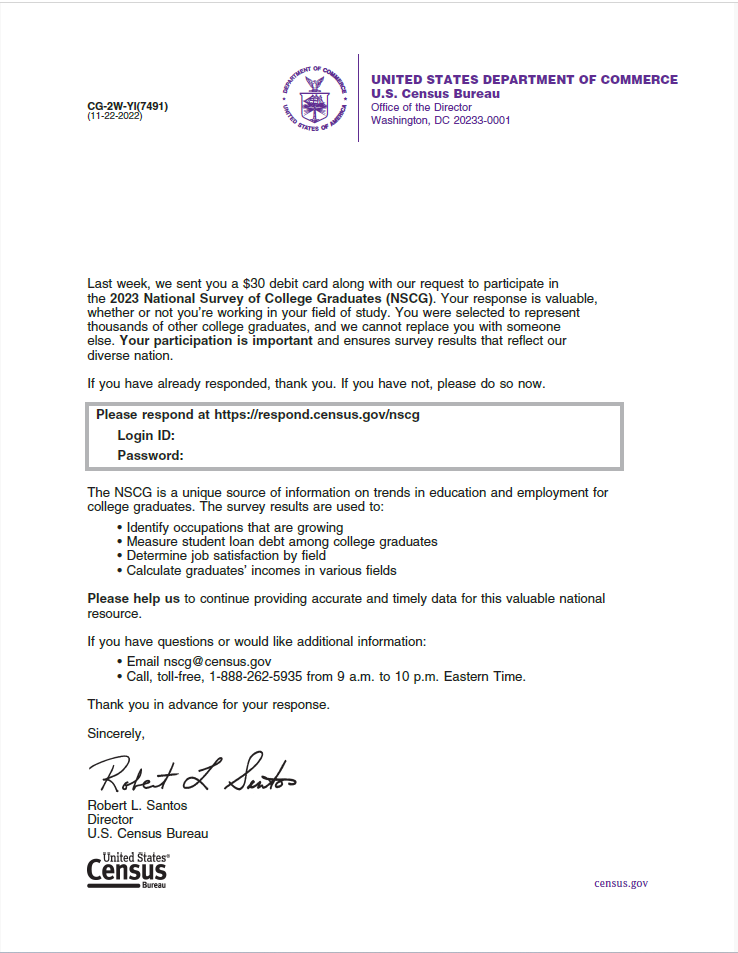
Week 5, Web invite, ACS style envelope, new cohort, QR code
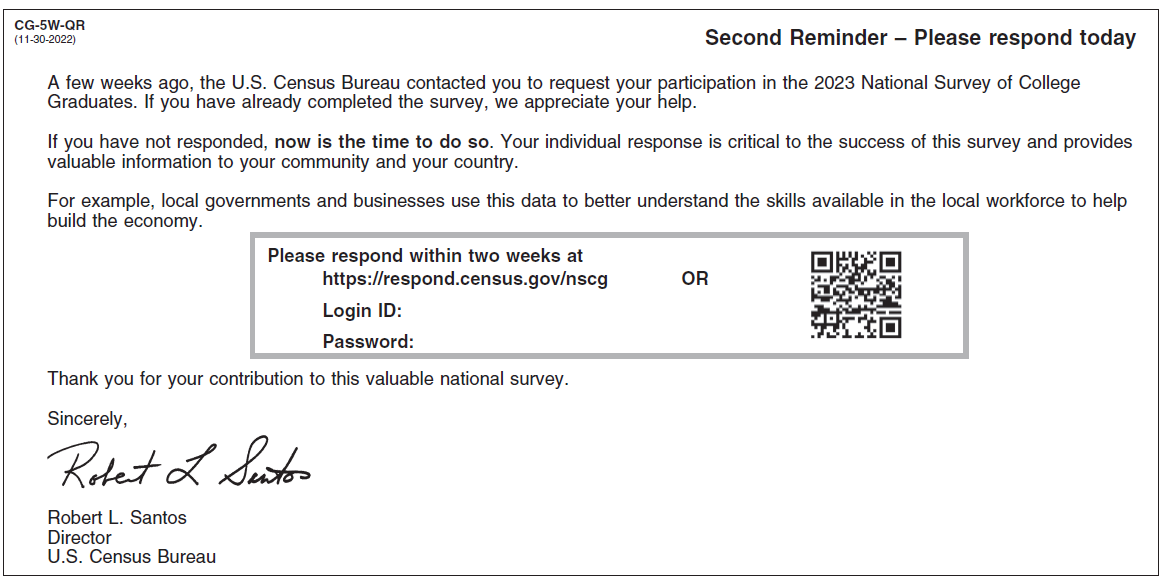
Week 5, Web invite, ACS style envelope, old cohort and new cohort without QR code
Week 8, Questionnaire and Web invite (21), new cohort, QR code
Week 8 Questionnaire and Web invite (21), new cohort, no QR code
Week 16, web invite, new cohort, QR code
Week 16, web invite, new cohort, no QR code
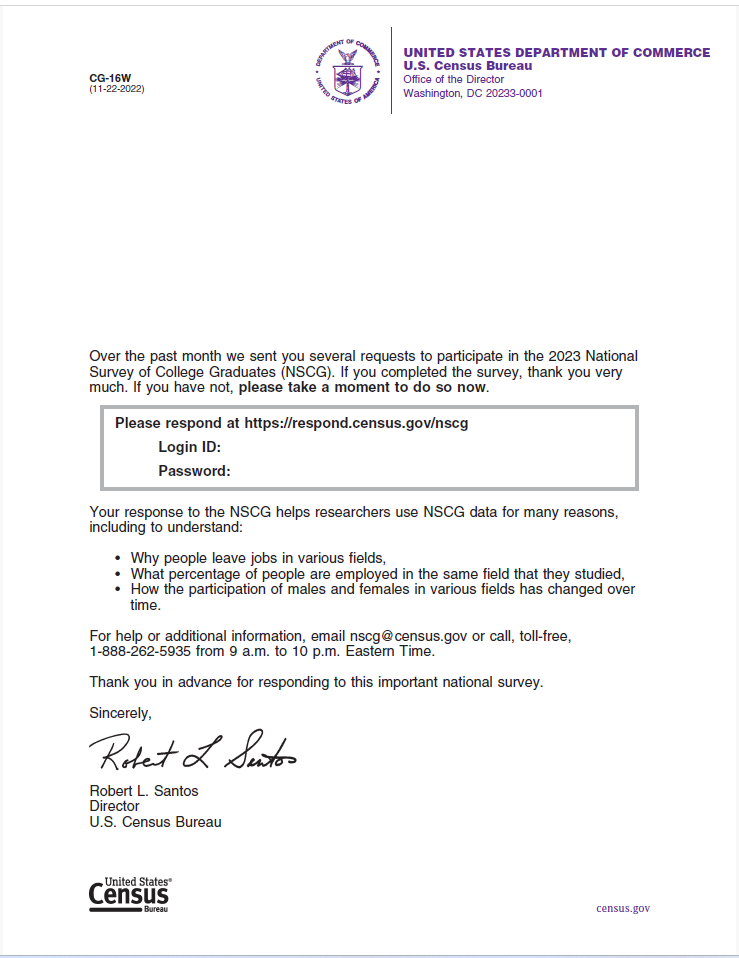
Week 20, Web Invite, new sample, Priority cardboard envelope/ Pseudo Certified envelope, questionnaire (21), QR code
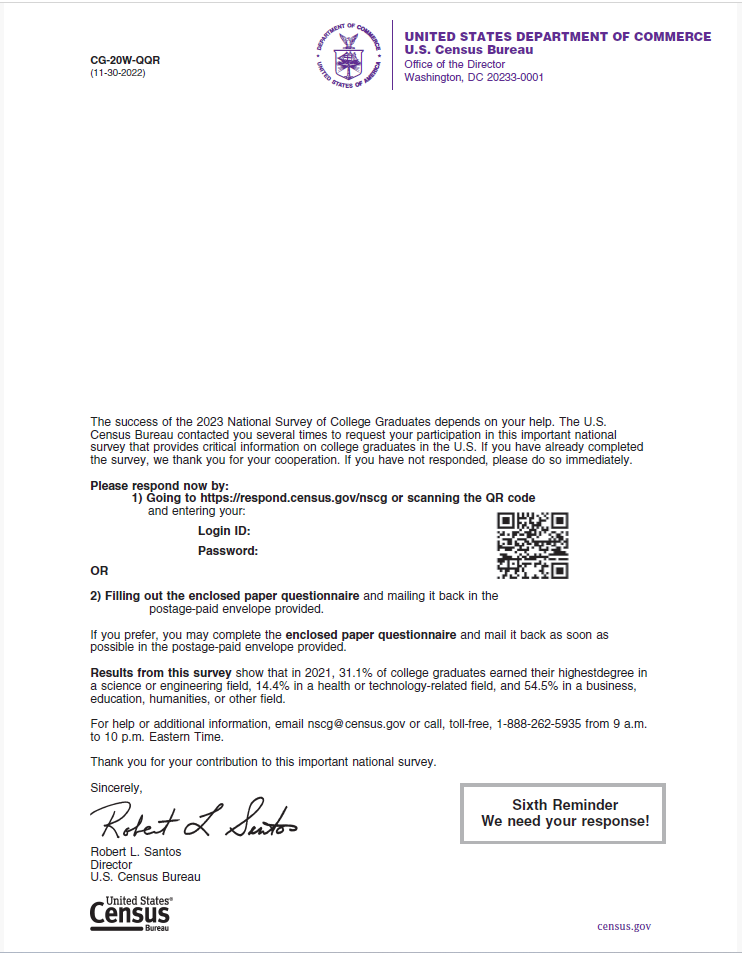
Week 20, Web Invite, new sample, Priority cardboard envelope/ Pseudo Certified envelope, questionnaire (21), no QR code
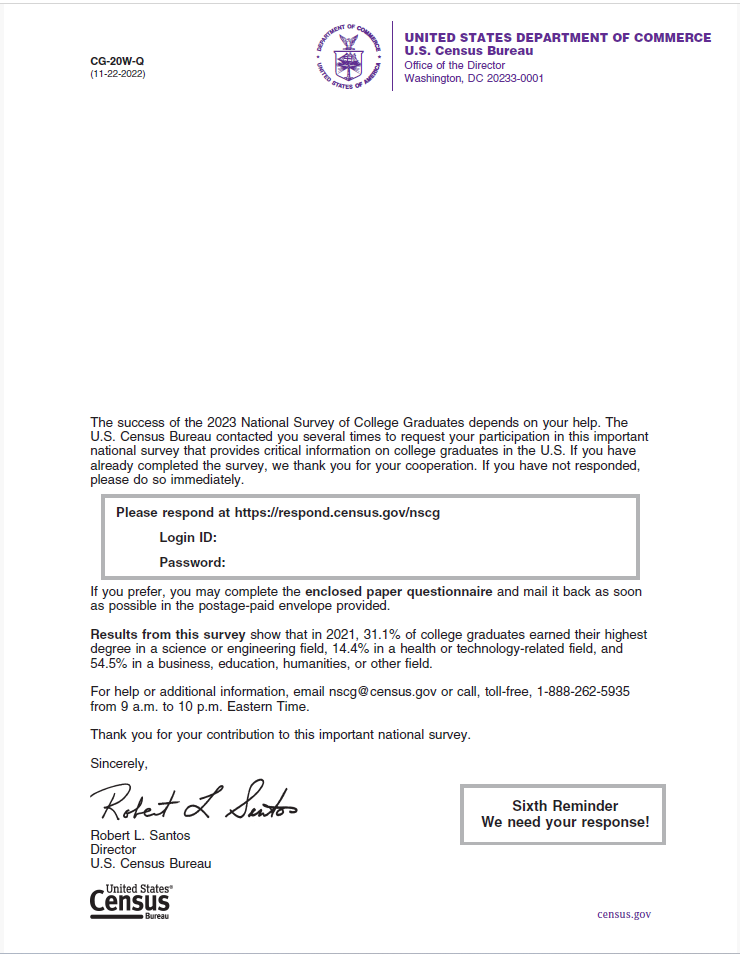
Week 23, Web invite, older demographic, new cohort, QR code
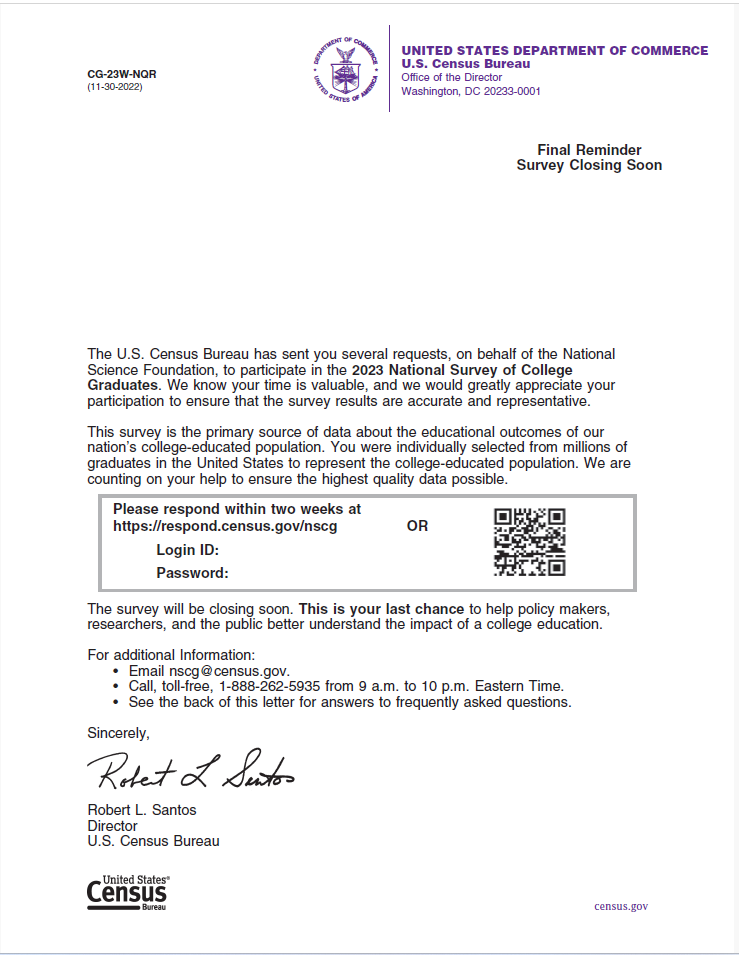
Week 23, Web Invite, older demographic, old cohort and new cohort (no QR code)
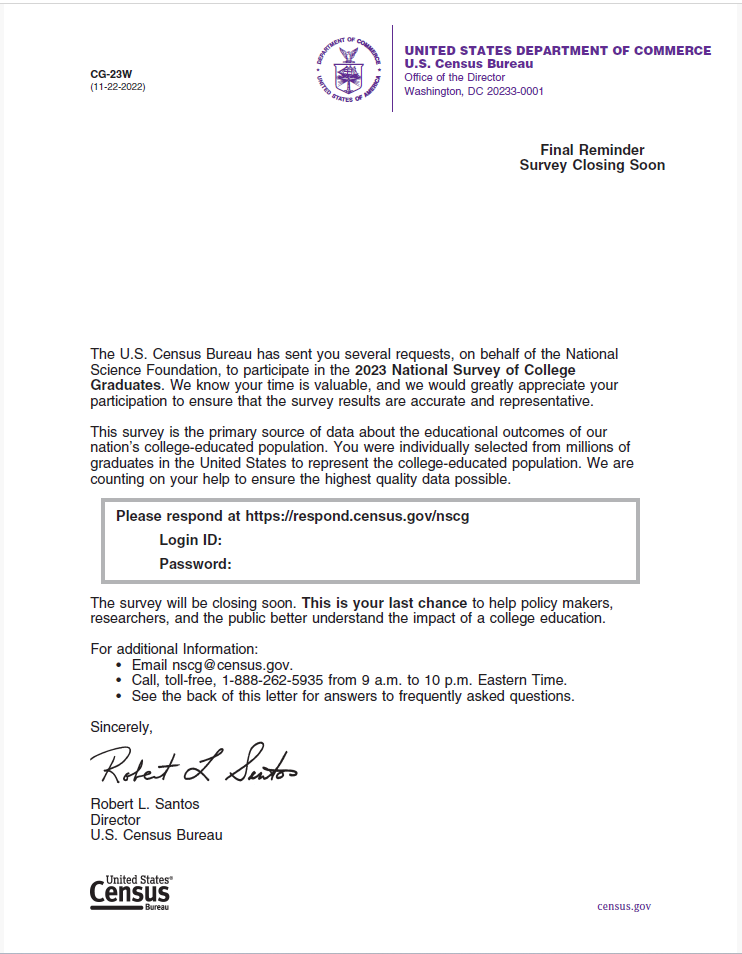
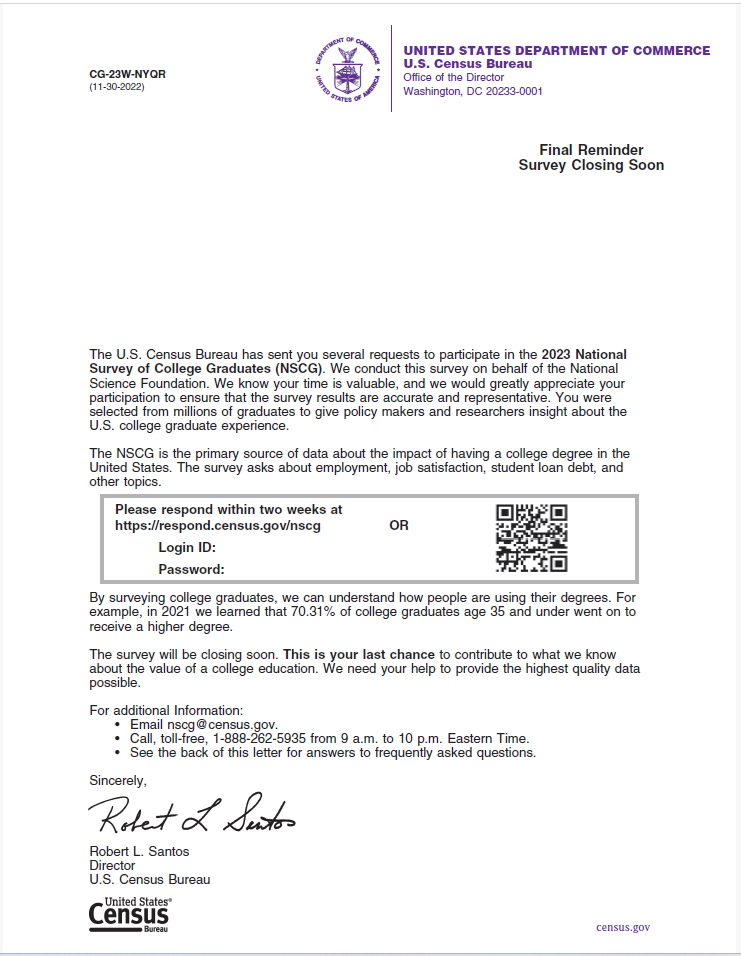
Week 23, Web invite, younger demographic, new cohort QR code
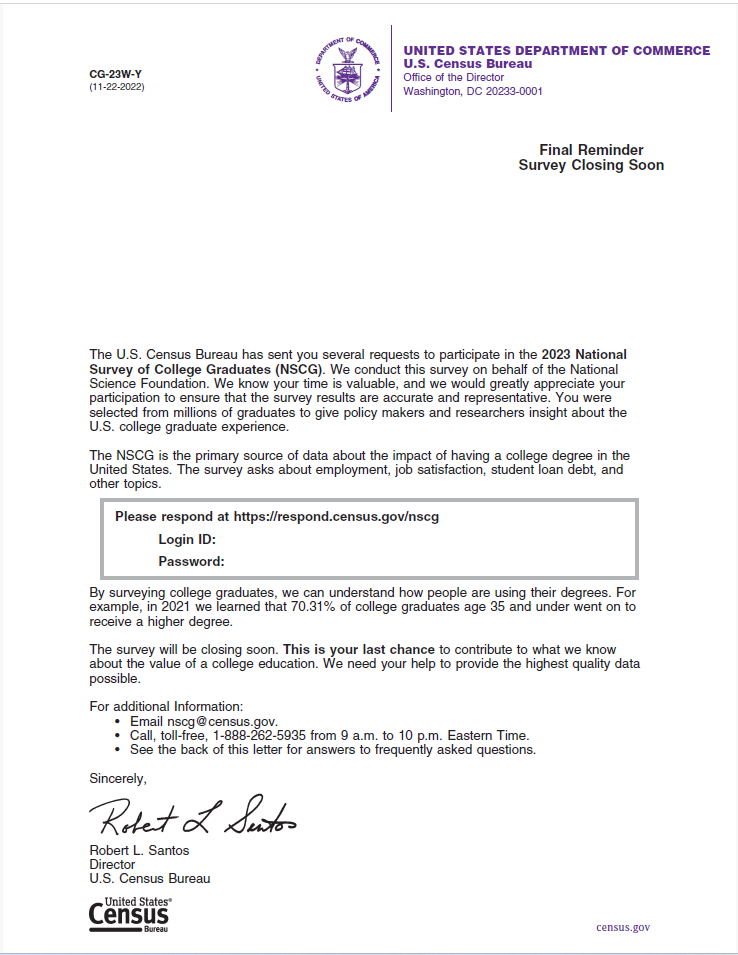
Week 23, Web invite, younger demographic, old cohort and new cohort (no QR code)
Appendix H: Minimum Detectable Differences Equation and Definitions
To calculate the minimum detectable difference between two response rates with fixed sample sizes, we used the formula from Snedecor and Cochran (1989) for determining the sample size when comparing two proportions.

where:
d = minimum detectible difference
a* = alpha level adjusted for multiple comparisons
Za*/2 = critical value for set alpha level assuming a two-sided test
Zb = critical value for set beta level
p1 = proportion for group 1
p2 = proportion for group 2
D = design effect due to unequal weighting
n1 = sample size for a single treatment group or control
n2 = sample size for a second treatment group or control
The alpha level of 0.10 was used in the calculations. The beta level was included in the formula to inflate the sample size to decrease the probability of committing a type II error. The beta level was set to 0.10.
1 Android 9 (Pie) or later.
2 iOS 11 or later.
3 See the 2023 NSCG Sampling Specifications for details (U.S. Census Bureau, 2023).
4 For disclosure purposes, the SAS code used for programming and verifying results will be saved on the addp-app1 server under the DSMD Survey Methodology area folder.
5 The MDD calculation assumes a 60 percent response rate in each group and use an alpha value of 0.10. Appendix H provides the MDD equation and definitions.
6 The weekly, unweighted response rates are calculated differently than the equation provided for the weighted response rate and can be viewed as a “completion rate”. These rates measure the number of completed and partially completed interviews compared to the full sample.
7 For example, there were eight different variations of the week 1 mailout sent to sample members.
8 These differences appear to have been inadvertent.
9 There was a significant difference initially within the race groups before data collection due the small sample sizes and how weights were applied for the American Indians and Alaska Natives, and Native Hawaiian and Other Pacific Islander groups. To correct for this, we collapsed the categories American Indians and Alaska Natives, Native Hawaiian and Other Pacific Islander, and Other race groups for the analysis.
10 This equation used base weights from the NSCG Master File.
| File Type | application/vnd.openxmlformats-officedocument.wordprocessingml.document |
| Author | Herschel L Sanders (CENSUS/DSMD FED) |
| File Modified | 0000-00-00 |
| File Created | 2025-01-16 |
© 2026 OMB.report | Privacy Policy

