Customer Survey Template
Att_Generic Clearance Template.doc
Generic Clearance for Federal Student Aid Customer Satisfaction Surveys and Focus Groups Master Plan
Customer Survey Template
OMB: 1845-0045
DOCUMENTATION FOR THE GENERIC CLEARANCE
OF CUSTOMER SERVICE SATISFACTION COLLECTIONS

TITLE OF INFORMATION COLLECTION:
Default Questionnaire
[X] SURVEY [ ] FOCUS GROUP [ ] SOFTWARE USABILITY TESTING
DESCRIPTION OF THIS SPECIFIC COLLECTION
The Department of Education, Office of Federal Student Aid (FSA), requests clearance for a customer satisfaction survey of its defaulted borrowers collection processes. We are surveying this process to that we can get a read on the satisfaction levels of defaulted borrowers with both our internal processes, as well as the satisfaction with private collection agencies. This information will help us identify service issues and develop solutions to improve satisfaction. CFI Group, a contractor on the MOBIS Schedule, will perform data processing and analyses of a separate statistical model for each survey using the proprietary American Customer Satisfaction Index (ACSI) econometric modeling techniques. ACSI is a national, cross-industry, cross public and private sector economic indicator produced by a partnership of the National Quality Research Center (at the University of Michigan Business School); CFI Group; and the American Society for Quality (ASQ). The advantage to using the ACSI methodology is that satisfaction of specific customer segments can be benchmarked against that of customer segments receiving similar services from other agencies, and customers’ perceptions of service-providing companies and industries in the private sector.
AMOUNT OF ANY PROPOSED STIPEND OR INCENTIVE
None.
BURDEN HOUR COMPUTATION (Number of responses (X) estimated response or participation time in minutes (/60) = annual burden hours):
Category of Respondent |
No. of Respondents |
Participation Time |
Burden |
Defaulted borrower |
250 |
10 minutes |
41.67 hrs. |
|
|
|
|
Totals |
|
|
|
BURDEN COST COMPUTATION
Federal Staff and/or Contractor Costs |
Hourly Rate |
No. of Hours |
Total |
CFI Group |
$35,000 Per survey cost |
|
$35,000 |
|
|
|
|
Totals |
|
|
|
STATISTICAL INFORMATION
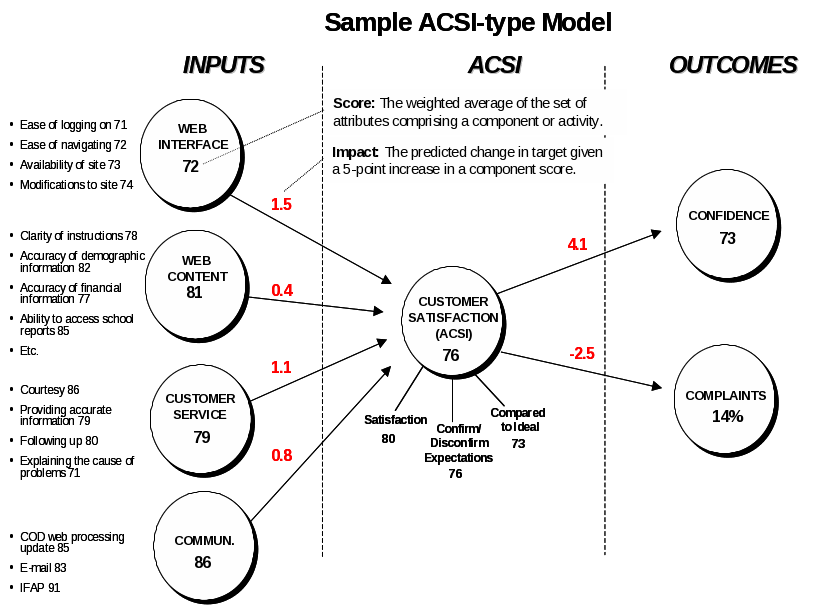
The ACSI econometric model is a cause-and-effect model made up of quality components, the overall satisfaction index, and outcome measures. Quality components are mutually exclusive, multiple-item measures of aspects of an agency’s service determined to be drivers of customer satisfaction. Each quality component is made up of multiple survey questions that measure customers’ perceptions of that one particular area of service. The overall satisfaction index is made up of three questions measuring customers’ overall satisfaction, satisfaction compared to expectations, and satisfaction compared to an ideal provider. These three questions are included in all ACSI models, allowing FSA to compare its results with other agencies. Finally, outcome measures are desired customer behaviors driven by customer satisfaction, such as reduced complaint rates or confidence in the security of the agency’s systems.
During the modeling phase, CFI Group will validate the structure of the quality components and the inter-relationships between quality components. Output of the model will be a set of indices, including indices for drivers of satisfaction, the satisfaction index, and indices for outcomes of satisfaction. Additionally, the model produces impacts that show the strength of the effect of each component on subsequent ones. Below is an example diagram of an ACSI-type model. All numbers are arbitrary and used only for the sake of demonstration.

The impacts derived from the model will be used by FSA in conjunction with the component scores to target the best areas for strategic change and improvement. Along with its value as a benchmarking tool, the ACSI methodology also provides agencies an additional benefit in the statistically reliable, customer-driven, quantitatively derived measures of where improvements will have the most leverage on customer satisfaction and, in turn, on desired customer behaviors. This information allows the Department of Education to allocate its resources in such a way to maximize the return on improved customer satisfaction for its investments in internal processes.
For each survey, the most appropriate data collection methodology is selected. The response target of 250 allows the confidence intervals around the computed performance scores to range from ±2.5 to ±3.0 points, at 95% confidence.
NAME OF CONTACT PERSON: Tony Oliveto
TELEPHONE NUMBER: 202-377-3078
MAILING LOCATION: UCP-0941
ED DEPARTMENT, OFFICE, DIVISION, BRANCH: FSA – EPMS - SPAR
| File Type | application/msword |
| File Modified | 0000-00-00 |
| File Created | 0000-00-00 |
© 2026 OMB.report | Privacy Policy