Att H - Sample reports
Asthma ETA Attachment H- Sample Report 081811.docx
Surveys of State, Tribal, Local and Territorial (STLT) Governmental Health Agencies
Att H - Sample reports
OMB: 0920-0879
Attachment H – Sample
Reports
Part 1 - Summary of evaluator needs
Number of evaluators responding :
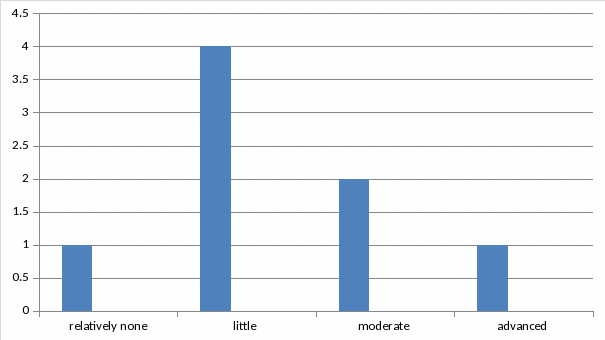
Overall level of experience in program evaluation
General knowledge assessment
|
Not at all |
General knowledge |
Used or could use |
Taught or could teach |
Priority for training |
Guiding principles
|
1 |
2 |
5 |
0 |
|
Joint Committee Program Standards
|
2 |
3 |
3 |
0 |
|
CDC Framework
|
0 |
4 |
3 |
1 |
|
Multiple approaches
|
1 |
5 |
1 |
1 |
|
Common areas identified for requesting technical assistance
Technical assistance requested for |
Percent requesting |
Respondents that can teach this |
Designing evaluations using mixed methods |
88% |
|
Collecting observational data |
75% |
|
Using logic models to guide questions |
75% |
|
Budgeting for evaluation |
75% |
|
Resolving conflicts |
75% |
|
Synthesizing evaluation findings |
62% |
|
Developing action plans |
62% |
(respondent id) |
Tailoring evaluation findings for community groups |
62% |
|
Common Organizational supports for evaluation
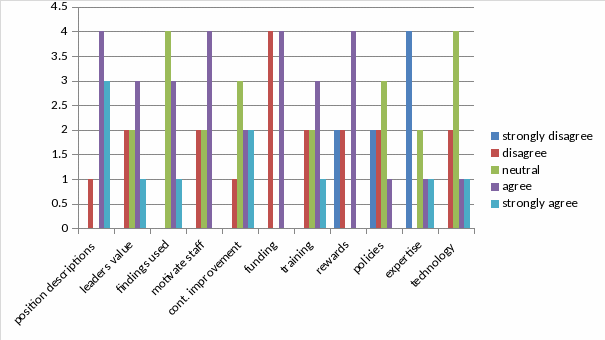
List of states with evaluators in strongly supportive organizations (>7 agree or strongly agree responses)
[respondents]
List of states with evaluators in non-supportive organizations
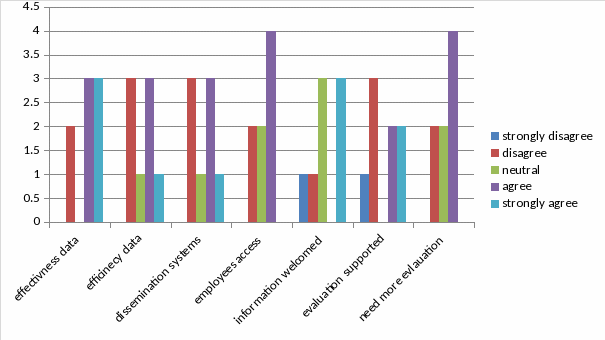
Organizational Availability of data and use of information
Part 2 - Assessment of NACP Evaluation Technical Assistance
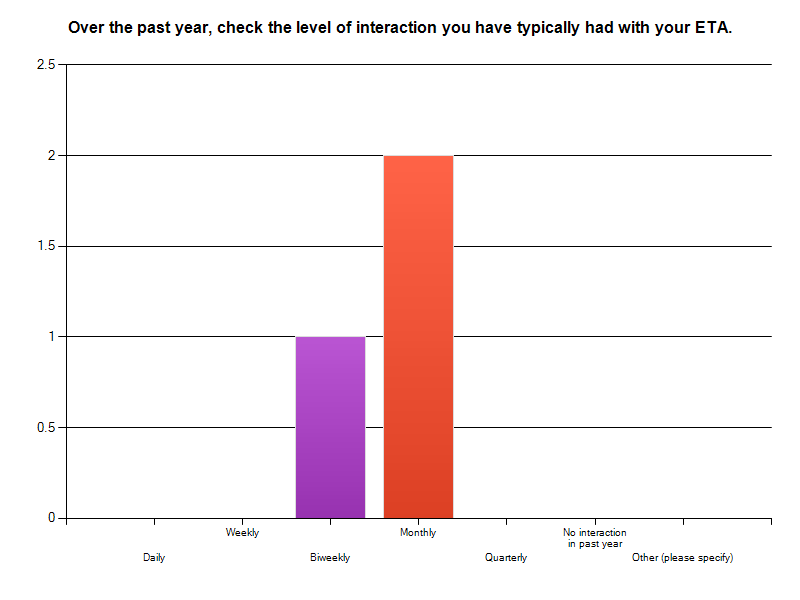
Level of interaction with ETA over past year:
Satisfaction with level of
interaction:
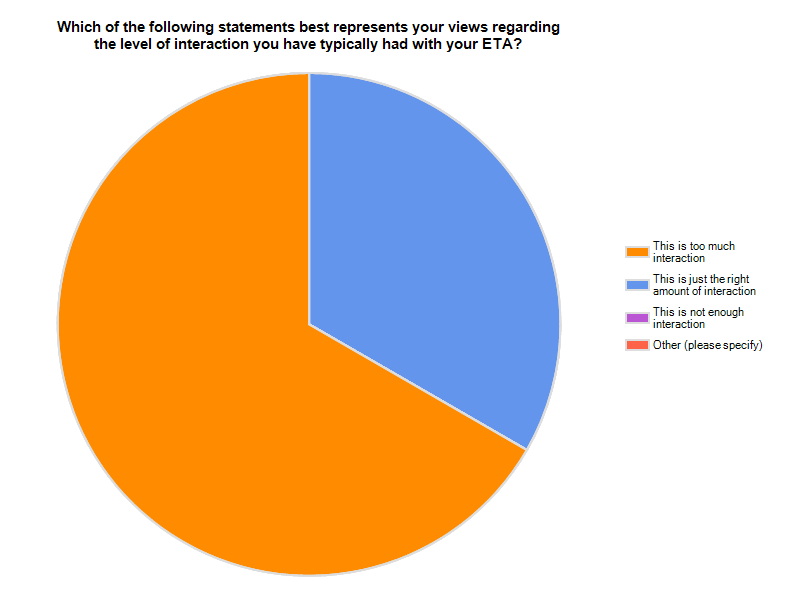
Ideal level of interaction: narrative responses compiled and reviewed for common themes.
Topics addressed and satisfaction with advice or resources provided:
|
||||
|
|
|
||
|
|
|
||
|
Adequate Advice/ Resources Provided |
Inadequate Advice/ Resources Provided |
Not Applicable (N/A) |
Response |
a. Evaluation Planning |
100.0% (3) |
0.0% (0) |
0.0% (0) |
3 |
b. Evaluation Implementation |
0.0% (0) |
0.0% (0) |
100.0% (3) |
3 |
c. General Problem Solving |
100.0% (3) |
0.0% (0) |
0.0% (0) |
3 |
d. Applying Evaluation Standards |
33.3% (1) |
33.3% (1) |
33.3% (1) |
3 |
e. Engaging Stakeholders |
66.7% (2) |
33.3% (1) |
0.0% (0) |
3 |
f. Describing the Program |
33.3% (1) |
33.3% (1) |
33.3% (1) |
3 |
g. Focusing the Design |
66.7% (2) |
0.0% (0) |
33.3% (1) |
3 |
h. Gathering Credible Evidence |
66.7% (2) |
0.0% (0) |
33.3% (1) |
3 |
i. Interpreting Findings/Justifying Conclusions |
0.0% (0) |
0.0% (0) |
100.0% (3) |
3 |
j. Ensuring Use/Disseminating Findings |
33.3% (1) |
0.0% (0) |
66.7% (2) |
3 |
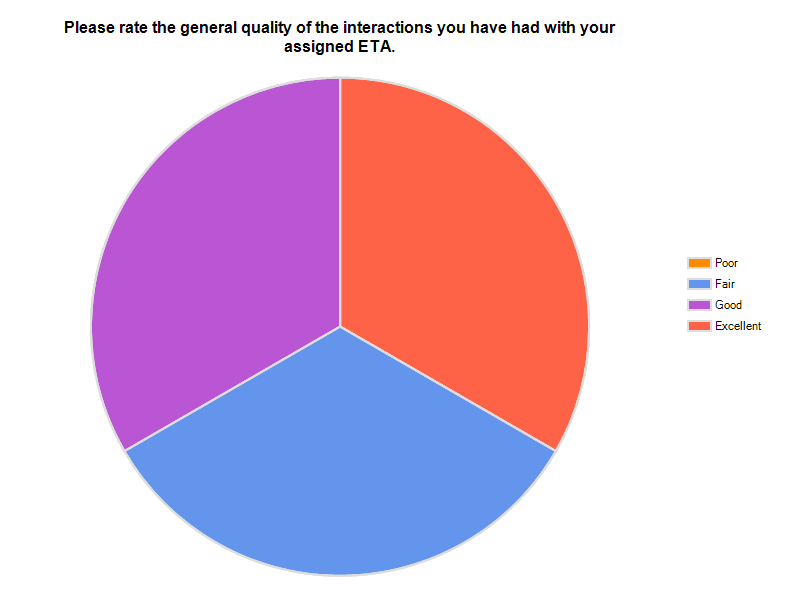
Overall quality of interaction with ETA:
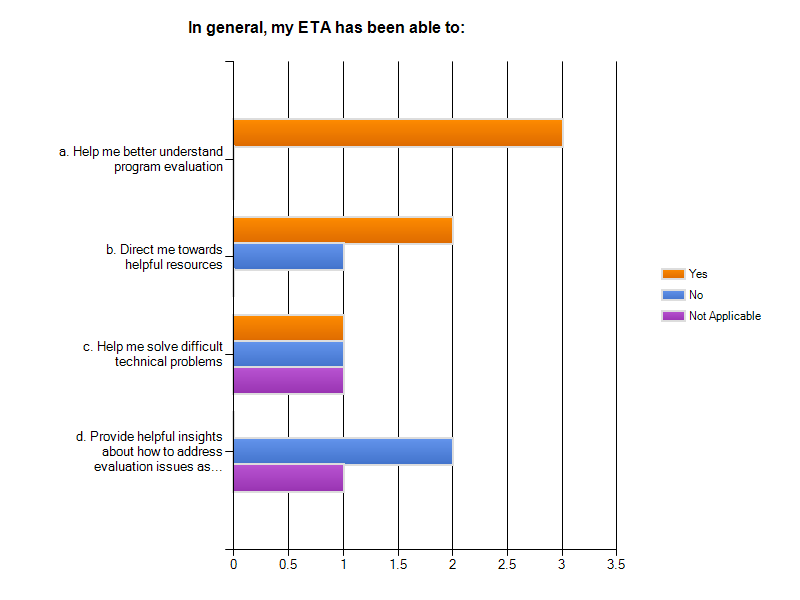
How ETA has helped:
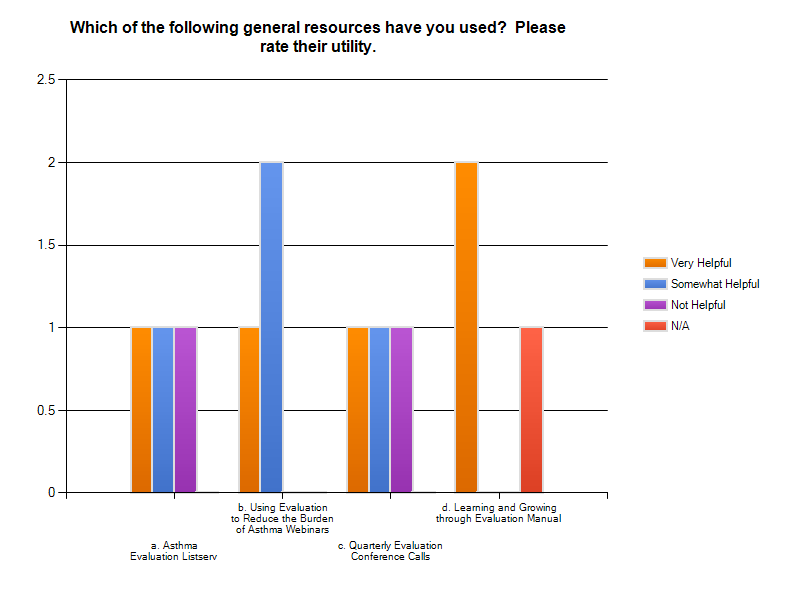
Use of resources:
How can we improve evaluation TA? This is a narrative response and we will analyze for common themes, utilizing atlas-ti software, as appropriate. Atlas-ti is a commonly used software package used to for qualitative data analyses.
| File Type | application/vnd.openxmlformats-officedocument.wordprocessingml.document |
| Author | sjd9 |
| File Modified | 0000-00-00 |
| File Created | 2021-02-01 |
© 2026 OMB.report | Privacy Policy