Attachment B NDEP Natl Diabetes Survey Initial Results for OMB 15May2012
Attachment B NDEP Natl Diabetes Survey Initial Results for OMB 15May2012.docx
National Diabetes Education Program Evaluation Survey of the Public
Attachment B NDEP Natl Diabetes Survey Initial Results for OMB 15May2012
OMB: 0925-0552

NDEP National Diabetes Survey: Initial Results
Trends from Three Rounds (2006, 2008, 2011)
For Respondents Ages 45+
May 15, 2012
Introduction
The following slides present selected trend results from a comparison of three rounds of the NDEP National Diabetes Survey (NNDS): 2006, 2008, and 2011.
Methodology
Telephone interviews were conducted with eligible households that were randomly dialed from a list of phone numbers with landline telephones. About 2,000 participants completed the phone survey in each of the three survey years. This included people with diabetes, prediabetes or at risk, as well as others.
The survey samples were designed to statistically represent the US as a whole, and oversamples of Hispanics and African-Americans were taken to ensure better representation in the survey by these subgroups of the population.
After 2006, the target group of the survey was broadened to include adults ages 35 to 44 years. In 2008 and 2011, the survey participants were ages 35 years and older, while the 2006 survey covered ages 45 years and above. For this reason, trend comparisons were done for the age group 45 years and older.
Results
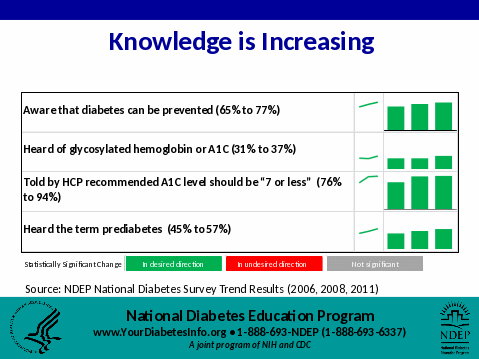
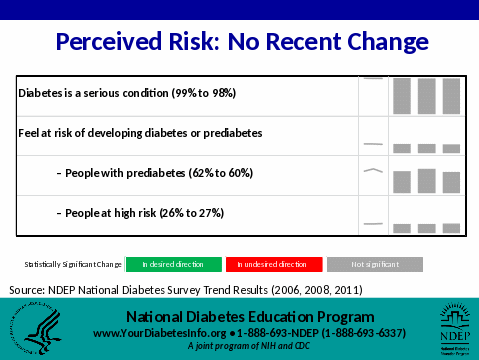
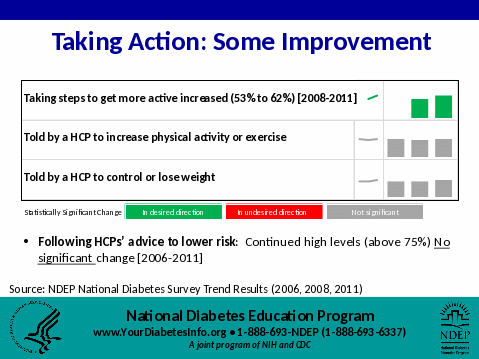
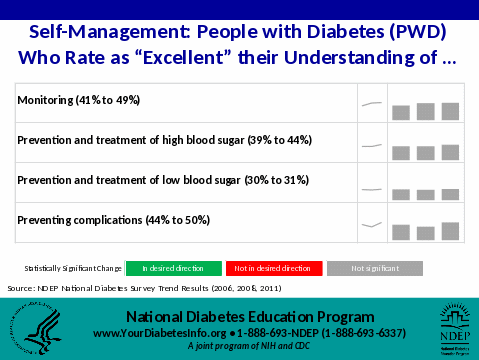
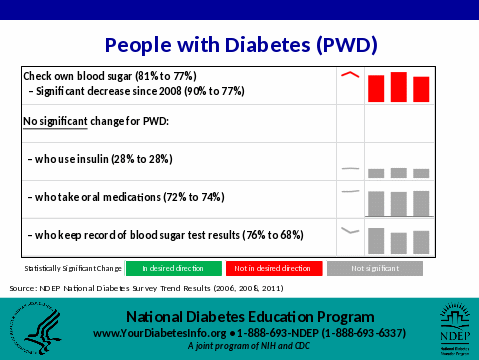
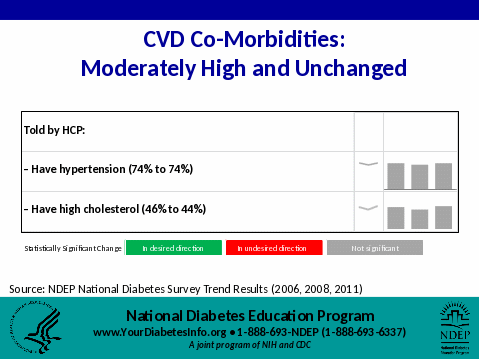
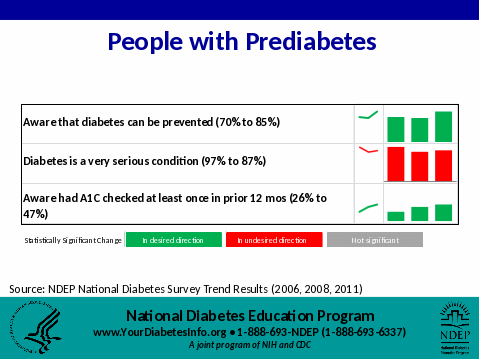
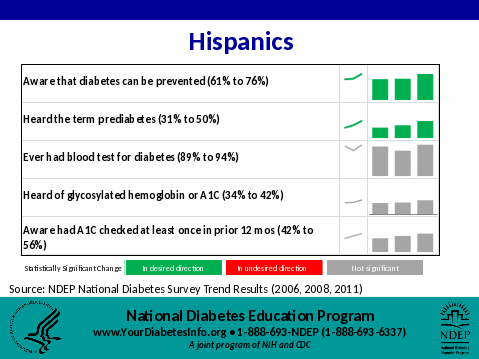
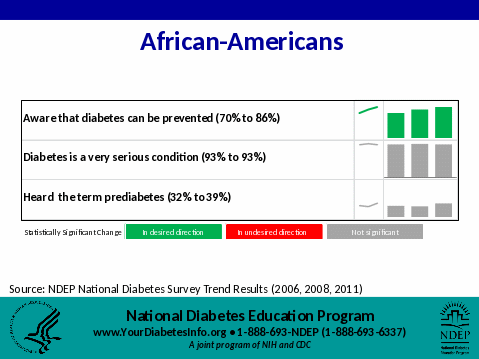
The results in this document show highlights of selected outcome measures from the NNDS over the five-year period. The graphics next to each outcome measure show percentages for 2006, 2008, and 2011 (left to right). The bar graphs and line charts plot the change over the 3 time periods. The graphs are color-coded to show statistically significant changes across the three survey years: green indicates significance in the desired direction, red means significant but not in desired the direction, and grey signifies no significant change.
| File Type | application/vnd.openxmlformats-officedocument.wordprocessingml.document |
| Author | Piccinino, Linda |
| File Modified | 0000-00-00 |
| File Created | 2021-01-30 |
© 2026 OMB.report | Privacy Policy