Section B OMB 2127-0665 Application Revised Package 3-13-2013-NKC MEV (5)
Section B OMB 2127-0665 Application Revised Package 3-13-2013-NKC MEV (5).doc
NHTSA 2009 Distracted Driving Survey Project
OMB: 2127-0665
Table of Contents
B. COLLECTION OF INFORMATION EMPLOYING STATISTICAL METHODS
1. Describe the potential respondent universe and any sampling or other respondent
selection method to be used...............................................................................................2
2. Describe the procedures for the collection of information................................................ 7
3. Describe methods to maximize response rates..................................................................10
4. Describe any tests of procedures or methods to be undertaken.........................................11
5. Provide the name and telephone number of individuals consulted on statistical
aspects of the design..........................................................................................................12
SECTION B
B) Collections of Information Employing Statistical Methods
The National Highway Traffic Safety Administration (NHTSA) is seeking approval for the Distracted Driving Intercept Survey (DDIS) to measure public awareness, attitudes, and self-reported behaviors regarding distracted driving and interventions to reduce distracted driving.
The Distracted Driving Intercept Survey (DDIS) will measure attitudes and awareness of distracted driving messaging and enforcement before and after specific local high-visibility enforcement mobilizations. This survey will be conducted in program and control sites with samples of 1100 drivers ages 18 years and older in the program (intervention) sites and 750 drivers ages 18 and older in the control site. Participants will be recruited at driving license offices (in Delaware and New Jersey) and at gas stations (in California and Oregon). It is a paper and pencil survey administered while drivers are waiting to have the photograph developed at the last stage of a license renewal procedure in driver licensing offices or while motorists are filling up their gas tanks.
Delaware and California are the program (intervention) sites and New Jersey and Oregon are the control sites to evaluate High Visibility Enforcement (HVE) programs designed to reduce distracted driving. These locations were chosen because they have primary enforcement laws banning hand-held phone use for all drivers, a prerequisite for participation in the enforcement campaign. The HVE programs will use TV, radio, and online media messaging of NHTSA’s, Phone in One Hand, Ticket in the Other, targeted enforcement, and visible enforcement on the roads to increase drivers’ perceived risk of being pulled over and ticketed for using a hand-held phone or texting while driving.
Delaware and the Greater Sacramento area in California are the test sites for the distracted driving HVE program. Atlantic County, New Jersey is Delaware’s comparison site and Multnomah County, Oregon is Greater Sacramento’s comparison site.
B.1 Describe the potential respondent universe and any sampling or other respondent selection method to be used.
NHTSA plans to use the DDIS to examine the public awareness of enforcement and messaging of a distracted driving high-visibility enforcement demonstration. The potential response universe for the DDIS is licensed drivers drawn from people visiting the department of motor vehicle offices in Delaware (program intervention) and in appropriate control locations (Atlantic County, NJ) a time period before and after the planned distracted driving mobilizations. In the Greater Sacramento area and its control site in Oregon, the response universe consists of drivers visiting gas stations. The survey administration site differs between States (i.e., motor vehicle division office for Delaware and gas stations for California). This was necessary to reduce selection bias in California because residents can perform the majority of motor vehicle and licensing services online without traveling to the motor vehicle division office.
In Delaware, all licensed drivers must visit the DMV periodically for license renewal. We are proposing collecting data from all (4) DMV offices in the state. The date of license renewal is based on birthday and it is therefore reasonable to treat customers renewing their license on a given day as random sample of the population of all available respondents (i.e. Delaware licensed drivers). Younger drivers (obtaining a license for the first time) may be overrepresented but the vast majority of these will be under 18 years-old and excluded from participation. In most cases all visitors to the office will be approached. In cases where the office is too busy to approach all customers, data collectors will approach every 3rd visitor (to maintain random selection). In the event the sample does not match the population we will statistically weight the data to control bias (see section B.2.1 below).
Gas stations will provide a convenience sample of licensed drivers. Unlike the DMV sampling described above, not all drivers need visit the gas station. For example, an individual member of the family may put gas into all the cars used by that family. Therefore it is likely that weighting of the sample will be required (see section B.2.1 for details). We plan to observe gas station behavior to determine if it is more likely that men fill the gas tank than women. If this is observed, we will sample by, for example, contacting every other female customer, but every 3rd male customer, depending on what the ratio is. If, after applying these random selection procedures, the sample does not reflect the licensed driver population, we will weight the sample accordingly.
Location |
Population |
% Under 35 |
Median Age |
% White |
% Black |
% Hispanic |
% Asian |
% Other |
HH Median Income |
California |
|
|
|
|
|
|
|||
Sacramento DMA |
4,191,579 |
49% |
35.8 |
63% |
7% |
26% |
11% |
12% |
$58,515 |
Multnomah County, Portland, OR |
735,334 |
49% |
35.7 |
76% |
6% |
11% |
7% |
5% |
$49,618 |
Delaware |
|
|
|
|
|
|
|||
Delaware |
897,934 |
45% |
38.8 |
69% |
21% |
8% |
4% |
4% |
$57,599 |
Atlantic County, New Jersey |
274,549 |
44% |
39.9 |
65% |
16% |
17% |
7% |
7% |
$54,766 |
Table 1. Demographics of Test and Control Sites.
Source: U.S. Census, http://factfinder2.census.gov/faces/nav/jsf/pages/searchresults.xhtml?refresh=t
External validation of the measures produced in the survey will be obtained by administering the survey at different sites within the demonstration cities and control cities so that observed differences can be reported across sites. In Delaware, NHTSA proposes to administer surveys at all four of Delaware’s Department of Motor Vehicle offices and the only DMV in Atlantic County, New Jersey (control) allowing license renewal. In California, NHTSA proposes to administer surveys at 8-12 gas stations in the Greater Sacramento area and at three gas stations in the control site in Multnomah County, Oregon (control). To the extent that similar results are obtained in different locations using different on-site interview operations, it is less likely that idiosyncrasies of sample selection or administration can account for obtained results.
Table 2. DDIS Sample Size
|
FALL 2012 |
SPRING 2013 |
SUMMER 2013 |
Total |
|||
|
1st Quarter Mobilization |
2ndQuarter Mobilization |
3rd Quarter Mobilization |
||||
|
Pre |
Post |
Pre |
Post |
Pre |
Post |
|
Demonstration City |
1100 |
1100 |
1100 |
1100 |
1100 |
1100 |
6600 |
Control City |
750 |
750 |
750 |
750 |
750 |
750 |
4500 |
Total |
1850 |
1850 |
1850 |
1850 |
1850 |
1850 |
11,100 |
Note that since there are two sites (California and Delaware) the above table must be doubled to account for the two sites. However, a similar number of respondents will be sought at each site.
Delaware (program) and Atlantic County, New Jersey (control,) DMV offices
Atlantic County, New Jersey was chosen as Delaware’s control site because it is demographically similar to Delaware, which helps control for response differences due to the population rather than exposure to the intervention and because it has a primary enforcement cell phone ban that applies to all drivers.1 While Delaware and Atlantic County are both in the Philadelphia media market, the program media will be broadcast in Delaware using local channels rather than the Philadelphia media. This will control exposure to the media messages of the two sites. Given these considerations, Atlantic County is a suitable control site for Delaware.
NHTSA proposes to administer surveys at all four motor vehicle division offices in Delaware (Wilmington, New Castle, Dover, and Georgetown) which are spread across the State making it less likely for the sample to be biased. This distribution helps achieve external validation of the measures because any differences across sites can be observed. While Delaware does offer some services online, all drivers have to visit one of the offices to complete at least a license renewal.2 Given that we are proposing to administer surveys at all offices in the State, all licensed drivers in Delaware have a chance to be surveyed (assuming the license renewal dates are randomly distributed throughout the year).
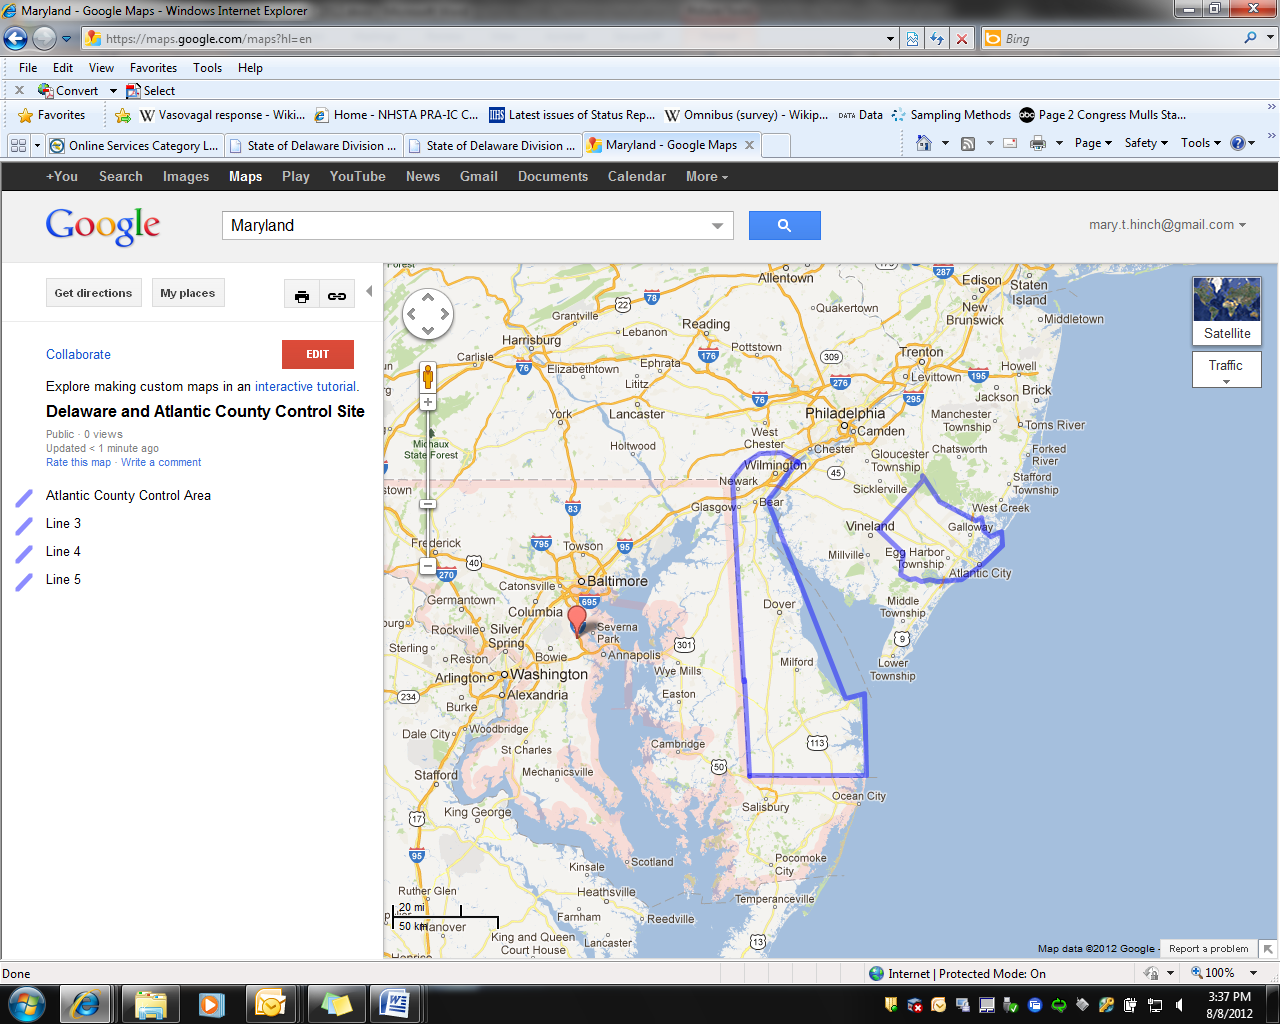
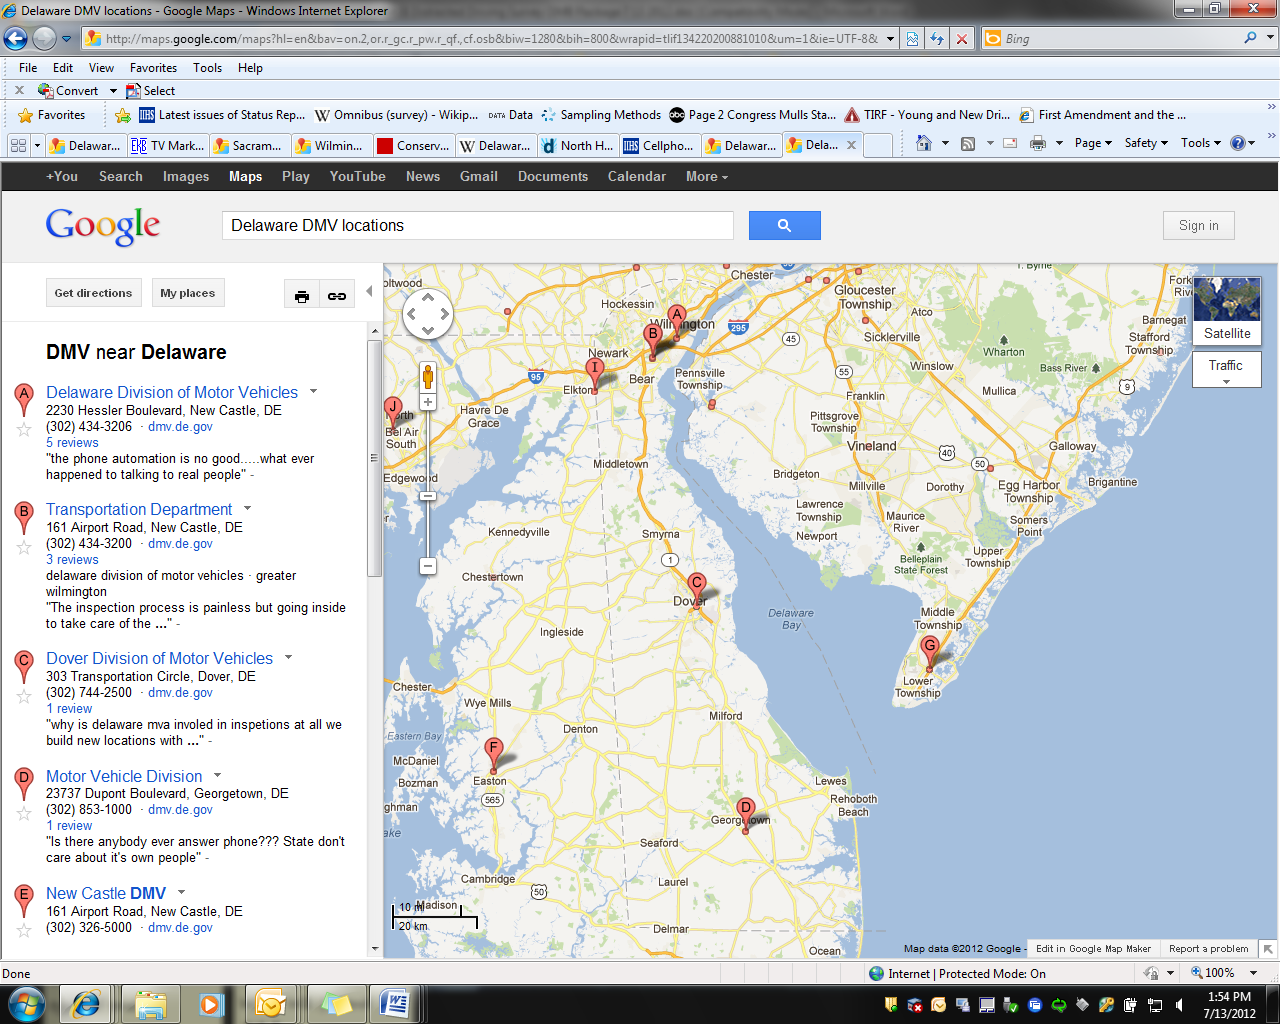
Figure 1: The program area
in Delaware and control area in Atlantic County, New Jersey (left).
The four Delaware driver license office locations (right).
Greater Sacramento Area, California (program) and Multnomah County, Oregon (control), Gas stations
Multnomah County, Oregon was chosen for the Greater Sacramento area control site because it is demographically similar to Sacramento, which creates more control in the design and has a primary enforcement law that bans hand-held cell phone use for all drivers. Sacramento and Multnomah County are in separate media markets, making it less likely for someone in Multnomah County to be exposed to media aired in Sacramento. Given these comparisons, Multnomah County appears to be a good match for Sacramento.
The program area includes Sacramento County and eight surrounding counties: Sacramento, El Dorado, Placer, San Joaquin, Solano, Stanislaus, Sutter, Yolo, and Yuba. Figure 2 shows these counties shaded by population. We propose selecting gas stations from four counties --Sacramento, San Joaquin, Stanislaus and Sutter counties. Selecting from Sacramento, San Joaquin and Stanislaus counties will maximize the population base as these three counties contain the three largest cities participating in the program (Sacramento, Stockton, and Modesto). Inclusion of Sutter county (containing Yuba City) provides a more rural and suburban area.
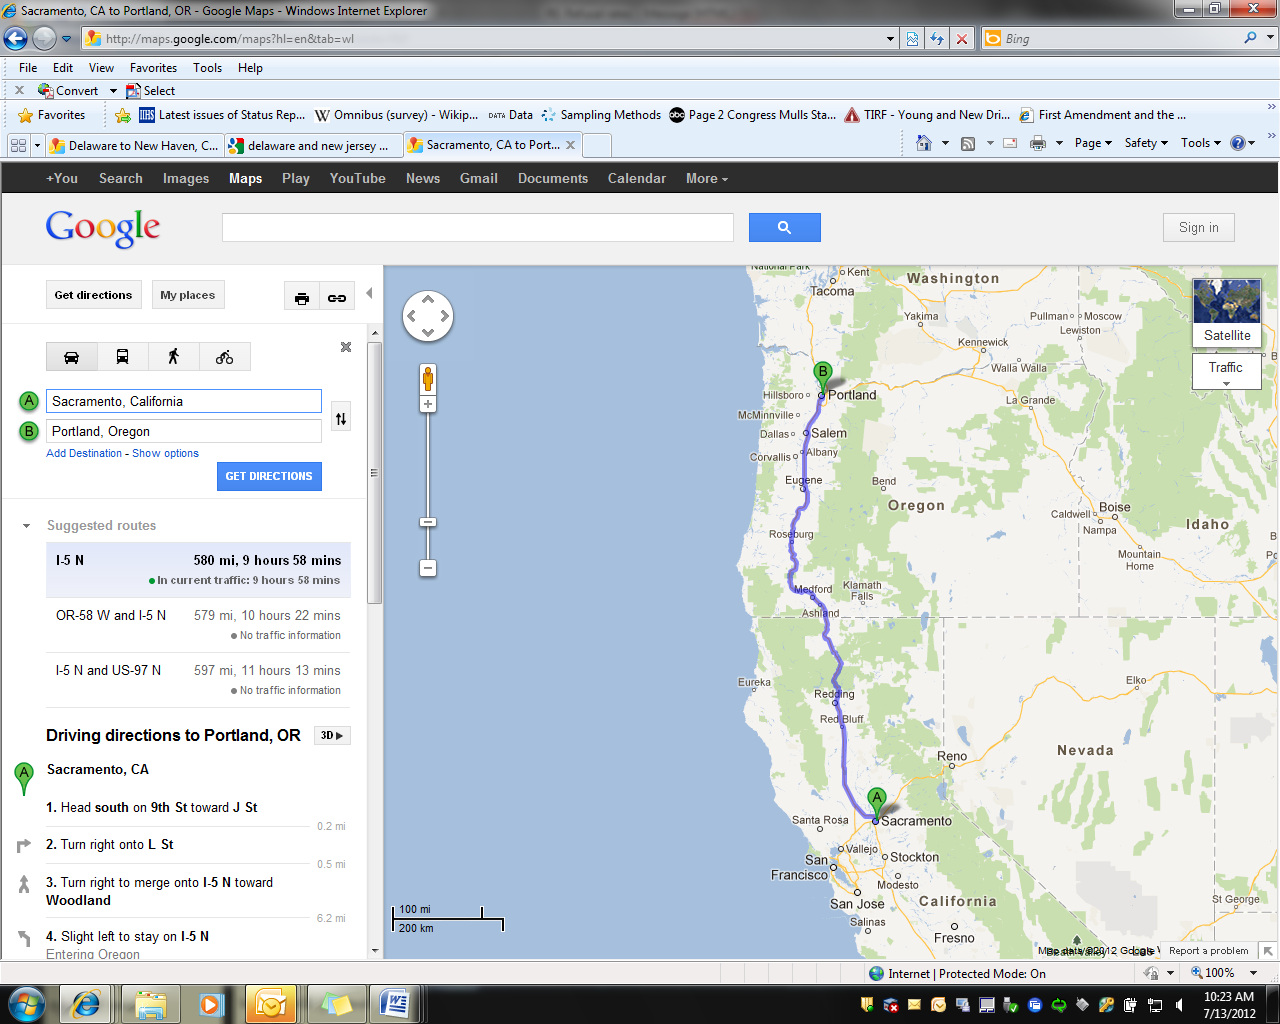
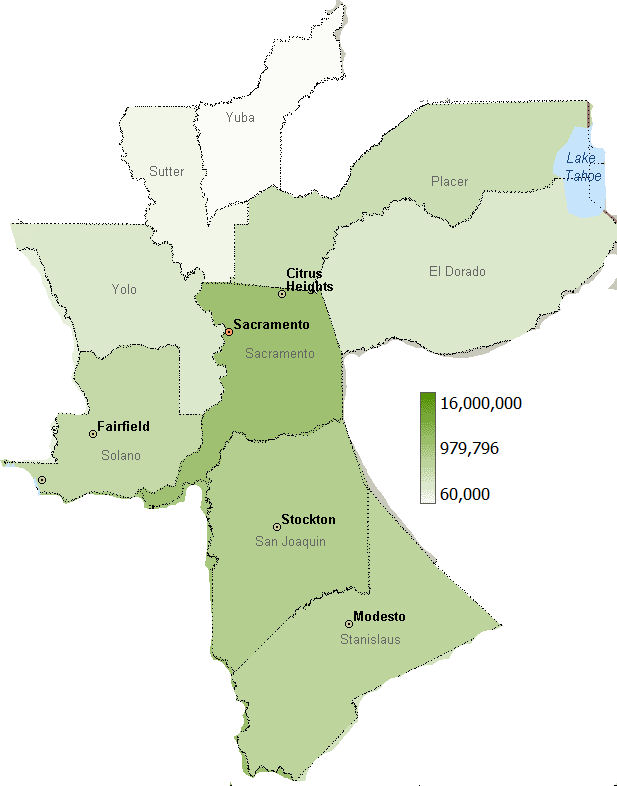
Figure 2: Sacramento, California and Multnomah County, Oregon (left) and Population map of greater Sacramento Area, California (right).
NHTSA proposes to administer surveys at 8-12 gas stations per measurement period (2-3 in each of the four counties identified in above). Two to three gas stations in each survey area will be randomly selected from all gas stations in that area. Gas stations with the most traffic volume will receive higher weight in the selection process. Roadway traffic volume will be used as a proxy for traffic volume at gas stations. Gas station owners/managers must approve administration of the survey on their property. As such, if data collection from a randomly chosen station is refused, we will request permission from the next randomly selected station.
Sampling will take place from 2 separate lists of eligible stations in each county. The first will be a list of stations within the city proper (i.e. Sacramento, Modesto, Stockton and Yuba City). The second list will be from gas stations outside the city limits but within the suburban limits of the city. This method will allow for sampling from urban and suburban customers. Data collection will occur from 8AM until 6PM.
To help achieve gas station participation, the California Office of Highway Safety will prepare a letter describing the project, its purpose, and requesting the gas station’s participation. For the control area, Multnomah County, Oregon, NHTSA proposes to administer surveys at three gas stations per measurement period. The control area gas stations will be selected using the same methods used to select the program area gas stations.
B.1.1 Total Sampling Needs
Overall, the total sample needs for the interviews are 22,200 respondents over the course of three program waves. The interviews are estimated to run 5 minutes3 in length, which would be a total public burden of 3,700 hours (see Table 3).
Table 3: Total Sample and Burden
|
Total Sample (3 waves) |
Minutes
|
Hours |
Delaware Atlantic County, New Jersey |
11,100 |
x 5 |
925 |
Greater Sacramento Area, California Multnomah County, Oregon |
11,100 |
x 5 |
925 |
Total |
22,200 |
|
1850 |
B.2. Describe the procedures for the collection of information.
The surveys will be used in a Non-Equivalent Groups Design (NEGD), which is frequently used by NHTSA evaluators to evaluate special media and enforcement mobilizations, such as Click It or Ticket. The design is structured like a pretest-posttest randomized experiment, but lacks random assignment. The surveys will be administered before and after each program wave (see Figure 3). The surveys will be administered simultaneously in the program and control areas.
Wave 1
Wave 3
Wave 2


Figure 3: Illustration of survey placement to measure change.
The research questions for the evaluation of the Distracted Driving Demonstration program, which the DDIS data collection seeks to answer, include:
Did drivers see and hear the NHTSA’s High Visibility Enforcement messages?
Item 16) Have you recently read, seen or heard anything about distracted driving in [STATE]? If yes, where did you see or hear about it? If yes, what did it say?
Item 17) Do you know the name of any distracted driving program(s) in [STATE]?
Did the program change drivers’ perception of the enforcement of cell phone laws?
Item 11) What do you think the chances are of getting a ticket if you use a hand-held cellular phone while driving?
Item 12) Do you think the hand-held cellular phone law in [STATE] is enforced?
Item 13) Have you ever received a ticket for using a hand-held cellular phone while driving?
Item 14) In the past month, have you seen or heard about police enforcement focused on hand-held cellular phone use?
Did the program change the public perception of the risks of distracted driving?
Item 10) Do you think that it is important for police to enforce hand-held cellular phone laws?
Did self-reported cell phone use change while driving?
Item 8) How often do you talk on a hand-held cellular phone when you drive?
Item 9) How often do you send text messages or emails on a hand-held cellular phone when you drive?
Pre and post intervention responses from the program and control sites will be compared using logistic regression (as the data are weighted) to determine if there are any significant differences that can be attributed to the distracted driving demonstration program activities.
B.2.1. DDIS Project Samples
A sample N=1100 drivers will be recruited from Department of Motor Vehicle Offices or gas stations for each survey wave in the intervention (program) sites, and 750 drivers will be recruited from each of the control areas. Typically the data are analyzed as proportions (i.e., dichotomizing the variables). As such we used an estimation of power for comparing two binomial proportions4. Using a sample size of 1100 in each wave, assuming α = .05 (two-tailed), we would have adequate power (.80) to detect changes as small as 6 percentage points. We would have power of over .90 to detect changes of 7 percentage points. It is important, however, to retain adequate power to be able to evaluate the effects on subgroups. As such, power estimates were also calculated for ½ the sample to represent individual sexes, for example. With a sample size of 550 per wave, we would have adequate power (.80) to measure a 9 percentage point change (and a 10 percentage point change with a power of .90).
Project sampling is described earlier (Section B.1). Drawing a sample at driver licensing offices is a form of purposive sampling, to reach a targeted sample quickly, in this case licensed drivers. DMV offices serve the public and in Delaware all drivers licensed in the state visit these offices to conduct business. We will select people randomly (assuming all visitors cannot be sampled) by approaching every 3rd visitor. To the extent that our sample does not match the population, data will be weighted to be representative of the population. The variables used to weight will include the major characteristics of the sample population, as described by either DMV or FHWA data (e.g. sex and age). This method will enable NHTSA to measure changes in attitudes and awareness across sex and age, without the potential complication of a skewed sample.
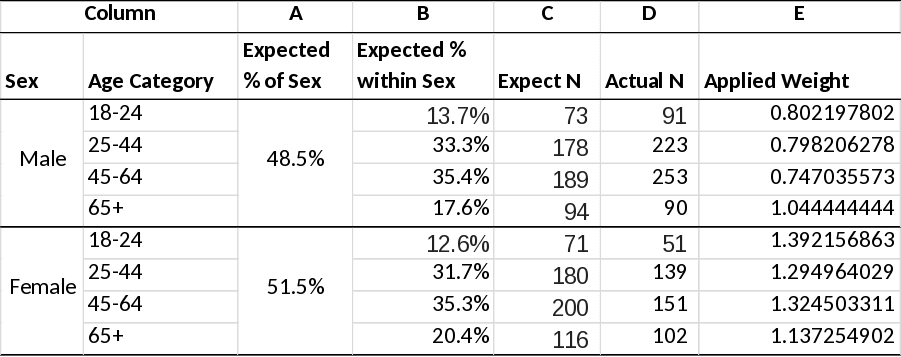
Data will be weighted in such a way that the sex and age distribution of the sample matches that of the population while the actual sample size remains unchanged. Table 4 provides an example of the weighting scheme using population data for the State of Delaware and hypothetical “actual” data values. We will calculate an expected N based on the population distribution and the number of surveys collected (Table 4 presumes 1,100 surveys were collected). In the example below, actual population distribution indicates that we should expect 48.5% (Column A) of the sample to be male (i.e., 1100*48.5% = 534 males). We further expect that 13.7% of the male sample to be ages 18 to 24 (Column B), leading to an expected N of 73(Column C: 534*13.7% = 73). Our actual sample size (Column D) for males 18-34 is 91. The weight applied to each Sex/Age Category grouping (Column E) is calculated by dividing the expected N by the Actual N (C/D = E). These weights will be applied to the analyses using SPSS software based on actual population distribution. Data from each round of data collection (e.g. Wave 1 pre, Wave 1 post) will be weighted independently.
The DDIS data collectors will employ a multi- step process to survey drivers: (1) interception, (2) determining eligibility, (3) recruitment, (4) completion of questionnaire, and (5) on-site data quality procedures.
Table 4. Sample Weighting Procedure
Upon approaching a potential participant, the screening interviewer will introduce him or herself and give a brief explanation of the study following a pre-determined script for this initial contact. Following the initial interception, the interviewer will administer a brief screener questionnaire (see Appendix C). The objectives of this questionnaire are to determine eligibility and to collect information to characterize the driving population. The screening interviewer will read each question to the participant and record the participant’s responses on the questionnaire form. Drivers will be eligible to complete the questionnaire if 1) they are a licensed driver, 2) they are 18 and older, and 3) there are no language barriers. A Spanish translation of the survey will be available.
Regardless of the eligibility determination, the interviewer will enter a “disposition” code onto each form to indicate the results of the screening. Examples of disposition codes are:
Ineligible Due to Questionnaire Responses
Eligible Due to Questionnaire Responses
Refused Screener
Eligible Due to Questionnaire Responses but Refused Main Questionnaire
Ineligible Due to Language Barrier
Ineligible Due to Other (specify other)
A tracking number will be assigned to each driver intercepted. This number will serve as the unique identifier that links the responses on the screener questionnaire to responses on the main questionnaire (see Appendix C).
Once the eligibility of the driver has been determined, the interviewer will endeavor to recruit eligible participants to complete the main questionnaire. In general, this will not be a scripted dialog, but the team member will cover key elements, which include additional details on the study, and an estimated time for completion (it is anticipated that the main questionnaire will take less than 5 minutes to complete). If the screening interviewer is successful in recruiting the driver, he or she will direct the participant to a questionnaire administrator waiting at a nearby table. One assistant will be fluent in Spanish to assist in interviewing Spanish-speaking participants.
The questionnaire administrator is responsible for all aspects related to the completion of the main questionnaire. This consists of: (1) receiving the eligible drivers identified by the Screening interviewer at a pre-determined location, (2) transferring the unique identifier from the screener form to a main questionnaire form, (3) directing the drivers on how to complete the form and what to do with it once they are finished, and (4) answering questions from participants in the process of completing a questionnaire.
After drivers complete the questionnaire, the interviewer will review the screening and questionnaire forms for completeness and accuracy. This review will ensure that the respondent did not inadvertently miss survey questions. If there are missing questions, the interviewer will attempt to question the respondent to obtain the response.
Logistic regression techniques will be used to compare the responses of pre and post administrations of the questionnaire. NHTSA will use the States’ Driver Records Databases (or FHWA data if DMV data are not available) to obtain the demographic features of the licensed driver population. If there is any measurable discrepancy between the population of vehicle drivers and the Census Bureau’s population estimates with regards to age and sex5, we will use the demographic State’s Driver Records Databases to weigh the samples. Similarly, for gas station surveys, data will be weighted according to DMV demographic data for the relevant counties (or Census Bureau’s population data for persons 18 years-old and older if DMV data is not available).
B.3) Describe methods to maximize response rates and to deal with issues of non-response.
The choice of driver licensing offices and gas stations as the venues for the DDIS was to maximize response rates. Driver licensing offices are typically places where people have to wait and participants are likely to be free to take a survey, and perhaps would welcome the distraction. Similarly, at gas stations, participants have a few minutes while refueling their vehicles. Furthermore, given that the criteria for selection includes licensed drivers, we expect a higher percentage of individuals approached in these venues will be drivers compared to other public venues such as shopping malls or movie theaters.
NHTSA does not intend to assess non-response bias in the intercept survey. Generally, only a small proportion of non-respondents are willing to participate in a non-response follow up interview. NHTSA has examined responses of past DMV surveys and found that the respondents represented the age and sex distribution of licensed drivers in the state. For example, an intercept survey conducted by the Washington Traffic Safety Commission found that 50.9% of the survey respondents were female and 49.1% male compared to 48.2% of the licensed drivers who are female and 51.8% male. For the same survey proposed here (in 2 offices in Connecticut), 735 drivers were approached and 510 agreed to participate (69%). We will, however, keep track of the number of participants who refuse by sex and compare the response rates by sex and location of the survey. Any differences will be noted in the discussion of the results.
Table 5. Age distribution of Department of Licensing (DOL)
Public Awareness Surveys vs. Licensed Drivers in Washington State
|
Nighttime Seat Belt Enforcement Driver Licensing Office Surveys 2007-2008* |
Washington State Licensed Drivers 2007** |
||||
Age |
Number |
Percent |
Cum Percent |
Number |
Percent |
Cum Percent |
-21 |
639 |
6.91% |
6.91% |
293,798 |
6.02% |
6.02% |
21-25 |
1,318 |
14.25% |
21.16% |
443,463 |
9.08% |
15.10% |
26-34 |
1,663 |
17.98% |
39.14% |
812,800 |
16.65% |
31.75% |
35-49 |
2,557 |
27.65% |
66.79% |
1,447,666 |
29.66% |
61.41% |
50-59 |
1,385 |
14.98% |
81.77% |
901,914 |
18.48% |
79.89% |
60+ |
1,686 |
18.23% |
100.00% |
981,702 |
20.11% |
100.00% |
Total |
9,248 |
100.00% |
|
4,881,343 |
100.00% |
|
*Those who reported age on the survey
** Drivers with valid Washington licenses and residences, DOL, 2007 http://ntl.bts.gov/lib/35000/35300/35321/811295_WA_Nighttime_1st_year.pdf
B.4) Describe any tests of procedures or methods to be undertaken.
NHTSA does not intend to conduct a pilot study for the DDIS and eligibility screener. The proposed intercept survey is identical to the intercept survey used in in Hartford, Connecticut and Syracuse, New York in NHTSA’s distracted driving community level demonstration programs6.
B.5) Provide the name and telephone number of individuals consulted on statistical aspects of the design.
The following individuals have reviewed technical and statistical aspects of procedures that will be used to conduct the Distracted Driving Intercept Survey (DDIS):
Neil Chaudhary, Ph.D. Preusser Research Group, Inc.
(203) 459-8700 7100 Main Street
Trumbull, CT 06611
Maria Vegega, Ph.D. Office of Impaired Driving and Occupant Protection (NTI-112)
(202) 366-2668 National Highway Traffic Safety Administration
1200 New Jersey Ave SE, W44-302
Washington DC, 29590
Richard Compton, Ph.D. Office of Behavioral Safety Research (NTI-130)
(202) 366-2699 National Highway Traffic Safety Administration
1200 New Jersey Ave SE, W46-304
Washington DC, 29590
1 See http://www.iihs.org/laws/cellphonelaws.aspx for an updated listing of State distracted driving laws.
2 See https://citizen.dmv.de.gov/services/online_svcs.shtml for list of available online services.
3 This is an estimate from a similar survey administered for the Hartford/Syracuse evaluation.
4 Rosner, B. (2000). Fundamentals of biostatistics. Boston, PWS Publishers, 2, 140-246.
5 Data available from the Federal Highways Administration: http://www.fhwa.dot.gov/policyinformation/statistics/2010/dl22.cfm
6 http://www.distraction.gov/download/research-pdf/508-research-note-dot-hs-811-845.pdf and http://www.distraction.gov/download/research-pdf/High-Visibility-Enforcement-Demo.pdf
| File Type | application/msword |
| File Title | Table of Contents |
| Author | Scott Roberts |
| Last Modified By | maria.vegega |
| File Modified | 2013-03-13 |
| File Created | 2013-03-13 |
© 2026 OMB.report | Privacy Policy