OY Sampling Overview
0088 - OY Sampling Overview for 2015 - revised.docx
Field Crops Objective Yield
OY Sampling Overview
OMB: 0535-0088
Objective Yield Sample Size Review
To evaluate the 2015 Objective Yield (OY) sample sizes, NASS re-calculated the 2010 to 2014 objective yield sample sizes for wheat, corn, soybeans, cotton, and potatoes using a confidence level of 95 percent, power of 80 percent, and actual survey data from 2010 to 2014. Table 1 shows that there is a relatively wide variation in calculated sample sizes for each commodity.
The target fields are sampled from the NASS list and area frame surveys. The corn, cotton, and soybean samples are exclusively drawn from the June Area Frame Survey. The wheat samples are drawn from the combined list and area frame surveys and the potato samples are drawn exclusively from the list frame. In the June Area Frame Survey, Section D, NASS asks for acres planted and to be planted for corn, soybeans, cotton, and wheat. This is done to allow for parts of the country that may have delayed planting due to weather conditions. NASS also takes into account that some farmers may choose to change the crops they are planting due to weather conditions. So, the sample sizes for the Objective Yield Surveys allow for farmers that may not have the item of interest when the survey begins. The sampling levels are based on historic trends.
The results show that the 2015 cotton sample size is lower than the minimum calculated sample size and the 2015 potato sample is similar to the maximum calculated sample size. Therefore, the 2015 cotton sample should be increased by approximately 700 samples and the 2015 potato sample decreased by approximately 200 samples. In contrast, the sample sizes for wheat, soybeans, and corn fall near their corresponding calculated average sample sizes1.
OY results are extremely important to NASS and the agricultural industry. Any changes to the program (including sample sizes) should be conducted in a careful and methodical manner. Therefore, for subsequent years, NASS will increase or decrease OY sample sizes gradually towards the calculated average sample size. NASS will continue to review and evaluate OY target CVs and sample size determination.
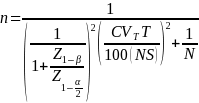
The sample size formula is:

n is the sample size for target commodity,
N is the population for target commodity,
S is the standard deviation for target commodity,
α: Type I error.
β: Type II error
CVT is the coefficient of variation for target commodity, and
T is the total for target commodity.
Table 1 Objective Yield Calculated Sample Sizes for 2010-2014
Crop |
2015 Sample Size |
CV |
Average (calculated) |
Minimum (calculated) |
Maximum (calculated) |
Winter Wheat |
1,410 |
2.0 |
1,672 |
1,220 |
2,069 |
Corn |
1,920 |
1.5 |
1,478 |
630 |
2,937 |
Soybeans |
1,835 |
1.5 |
1,860 |
419 |
2,807 |
Cotton |
1,217 |
2.0 |
1,991 |
1,218 |
3,339 |
Potatoes |
1,260 |
2.0 |
1,066 |
847 |
1,261 |
1 Currently NASS’s Policy and Standards Memorandum Agricultural Statistics Methodology and Standards (PSM-ASMS) 12 indicates the target CV for corn and soybeans is 2. For the next PSM-ASMS-12 review, NASS will lower the target CV for corn and soybeans to 1.5.
| File Type | application/vnd.openxmlformats-officedocument.wordprocessingml.document |
| Author | Duan, Franklin - NASS |
| File Modified | 0000-00-00 |
| File Created | 2021-01-25 |
© 2026 OMB.report | Privacy Policy