Part B NAEP 2017-2019
Part B NAEP 2017-2019.docx
National Assessment of Educational Progress (NAEP) 2017-2019
OMB: 1850-0928
National Center for Education Statistics
National Assessment of Educational Progress
NAEP Assessments for 2017-2019
SUPPORTING STATEMENT
PART B
OMB# 1850-NEW v.1
(previous OMB# 1850-0790 v.43)

November 2015
Revised August 2016
Table of Contents
B.1. Potential Respondent Universe and Sampling Design 3
B.2. Procedures for Collection of Information 6
B.2.a Recruitment of Schools 6
B.2.b School Coordinator Responsibilities 7
B.2.c Administration Procedures 15
B.3. Methods to Secure Cooperation, Maximize Response Rates, and Deal with Nonresponse 15
B.3.a. Methods to Maximize Response Rate 15
B.3.b. Statistical Approaches to Nonresponse 16
Part B. Collection of Information Employing Statistical Methods
B.1. Potential Respondent Universe and Sampling Design
The possible universe of student respondents for main NAEP is estimated to be 12 million at grades 4, 8, and 12, attending approximately 154,000 public and private elementary and secondary schools. NAEP assessments are administered in selected public and private schools to a sample of fourth-, eighth-, and twelfth-grade students.
Respondents are selected according to student sampling procedures with these possible exclusions:
The student is identified as an English language learner (ELL), but is prevented from participation in NAEP, even with accommodations allowed in NAEP.
The student is identified as having a disability (SD) which prevents participation in NAEP, even with accommodations as allowed in NAEP, and has an Individualized Education Plan (IEP) or equivalent classification, such as a Section 504 plan.
Additional information regarding the classification of students is provided in Section B.2 b.
B.1.a. Sampling Procedures
To assess a representative sample of students, the process begins by identifying a sample of schools with student populations that reflect the varying demographics of a specific jurisdiction, be it the nation, a state, or a district. Within each selected school, students are chosen at random to participate and each has the same chance of being chosen, regardless of socio-economic status, disability, status as an English language learner, or any other factors. Selecting schools that are representative helps ensure that the student sample is representative.
The following are characteristic features of NAEP sampling designs:
for state-level assessments, approximately equal sample sizes (2,500–3,000 assessed students) from each participating state’s public schools, for each subject;
for district-level assessments, sample sizes of approximately 1,200–2,000 from each participating district’s public schools, for each subject;
sample sizes of approximately 6,000–20,000 for national-only operational subjects, depending on the size of the item pool1;
samples sizes of approximately 3,000-12,000 for pilot assessments, depending on the size of the item pool2; and
in each school, some students to be assessed in each subject.
Additional information about the sampling procedures used in NAEP can be found in the technical documentation at: http://nces.ed.gov/nationsreportcard/tdw/sample_design/. Note, while the latest documentation that has been published (as of the drafting of this document) is 2012, the procedures have essentially remained the same. The 2011 procedures can be referenced for details on sampling of state-level assessments. A summary of the sampling procedures are included below. Additional details (taken from the 2011 procedures on the technical documentation website) can be found in Appendix G (NAEP 2011 Sampling Design).
As in the past, NAEP samples are based on multistage designs. For the national samples, a two or three-stage design is used. If a three-stage design is used, the first stage is the selection of primary sampling units (PSUs), which are individual counties or groups of contiguous counties. The next stage is the selection of schools (within PSUs, when a three-stage design is used) and the final stage is the selection of students within schools. The national samples have sufficient schools and students to yield data for public schools, each of the four NAEP regions of the country, as well as gender, race, degree of urbanization of school location, parent education, and participation in the National School Lunch Program (NSLP).
The following steps are used to select a sample of public schools and students in a year when NAEP reports state-level results. Private schools are not included in a state-level sample, which focuses solely on public schools.
Generate a sampling frame.
For sampling frames, NAEP uses the most current versions of the NCES Common Core of Data (CCD; public schools) and Private School Universe Survey (PSS; private schools) files. In addition, to address the fact that the CCD file does not necessarily include the most recent changes to schools by the time of the assessment, NAEP also conducts a survey of NAEP State Coordinators to check for additional new schools in a sample of public school districts.Classify schools into groups.
Using the list, schools are classified into groups, first by type of location and then by the race/ethnicity classification within those locations. This step takes into account the distribution of schools and students across rural, suburban, and urban areas in each state, and the diversity of the student population at each school.Within each group, order schools by a measure related to student achievement.
Within each group, schools are sorted by student achievement to ensure that schools with varying levels of student achievement are represented in the NAEP sample. This is done using school level results on state achievement tests. In a few cases where recent achievement data are not available, schools are sorted by the median household income for the area where the school is located.Assign a measure of size to all schools.
All schools on the list are assigned a measure of size. A school’s measure of size is based on the size of its enrollment in relation to the size of the state’s student population at the selected grade-level. Larger schools have a larger measure of size as they represent a larger proportion of the state’s student population. This step ensures that students from schools of different sizes are appropriately represented in the sample.Select the school sample.
After schools are assigned a measure of size and grouped on an ordered list based on the characteristics that are referred to in previous steps, the sample is selected using stratified systematic sampling with probability proportional to the measure of size using a sampling interval. This procedure ensures that each school has the required selection probability. By proceeding systematically throughout the entire list, schools of different sizes and varying demographics are selected and a representative sample of students will be chosen for the assessment. Additional details regarding the selection of the school sample is included in the technical documentation (e.g., http://nces.ed.gov/nationsreportcard/tdw/sample_design/2007/sampdsgn_2007_state_schlsamp.aspx).Confirm school eligibility.
The list of schools selected to participate is sent to each state to verify that the school is eligible for participation. Some factors that would make a school ineligible include schools that have closed or if the grade span has changed so that a grade level assessed by NAEP is no longer in the school. Eligibility counts are included in the technical documentation (e.g., http://nces.ed.gov/nationsreportcard/tdw/sample_design/2007/sampdsgn_2007_state_inelg_table1.aspx). Information on response rates can be found in Section B.3.b.Select students to participate in NAEP.
School principals are notified that their schools have been chosen to participate in NAEP. Within each sampled school, a systematic sample of students is selected with equal probability from a complete list of students at the grade to be assessed.
The process for private school selection is similar to the public school selection process, but depends on the U.S. Department of Education’s private education system databases to create the initial list of all known private schools. Private schools are sampled to be representative of private schools nationwide. The results for private schools are not included in state-level results which are solely focused on public schools.
As described above, the selection process for schools uses stratified systematic sampling within categories of schools with similar characteristics. Some schools or groups of schools (districts) may be selected for each assessment cycle if they are unique in the state. For instance, if a particular district is in the only major metropolitan area of a state or has the majority of a minority population in the state, it may be selected for assessment more often. Additionally, even if a state decides not to participate at the state level, schools in that state identified for the national sample will still be asked to participate.
NAEP yearly sample design plans are not available until the spring of the year preceding the assessments. For this clearance submittal, we have included the 2017 sample design memorandum (see Appendix C) which details the specific sampling procedures for the 2017 assessments.
Additional information about the sampling procedures used in NAEP can be found in the technical documentation at: http://nces.ed.gov/nationsreportcard/tdw/sample_design/.
B.1.b. Weighting Procedures
Since each selected school that participates in the assessment effort and each student assessed constitute only a portion of the full population of interest, weights are applied to both schools and students. The weights permit valid inferences to be drawn from the student samples about the respective populations from which they were drawn and, most importantly, ensure that the results of the assessments are fully representative of the target populations.
Additional information about the weighting procedures used in NAEP can be found in the technical documentation at: http://nces.ed.gov/nationsreportcard/tdw/weighting/. Note, while the latest documentation that has been published (as of the drafting of this document) is 2012, the procedures have essentially remained the same. The 2011 procedures can be referenced for details on sampling of state-level assessments. A summary of the sampling procedures are included below. Additional details (taken from the 2011 procedures on the technical documentation website) can be found in Appendix H (NAEP 2011 Weighting Procedures).
The final weights assigned to each student as a result of the estimation procedures are the product of the following steps (which are described in additional detail below):
assignment of a “base” weight, the reciprocal of the overall initial probability of selection;
adjustment of the school base weights to reduce extreme variability, arising from special circumstance;
adjustments for school and student nonresponse;
adjustment (if needed) to reflect assignment to a specified assessment subject; and
adjustment of the student weights in state samples so that estimates for key student-level characteristics were in agreement across assessments in reading, math, and science.
School base weights are assigned separately by grade and, as noted, are the reciprocal of the school’s probability of selection for that grade.
Each sampled student receives a student base weight, whether or not the student participated in the assessment process. The base weight reflects the number of students that the sampled student represents in the population of interest. The sum of the student base weights for a given subgroup provides an estimate of the total number of students in that subgroup.
Since nonresponse is unavoidable in any survey of a human population, a weighting adjustment is introduced to compensate for the loss of sample data and to improve the precision of the assessment estimates. Nonresponse adjustments are applied at both the school and the student levels; the weights of responding schools are adjusted to reflect the nonresponding schools, and the weights of responding students, in turn, receive an adjustment to account for nonresponding students. School nonresponse adjustment cells are formed in part by census division, urbanicity, and race/ethnicity. Student nonresponse adjustment cells are formed in part by student with disabilities (SD)/English language learner (ELL) status, school nonresponse cell, age, gender, and race/ethnicity.
The complexity of the sample selection process as well as the variations in school enrollment can result in extremely large weights for both schools and students. Since unusually large weights are likely to produce large sampling variances for statistics of interest, and especially so when the large weights are associated with sample cases reflective of rare or atypical characteristics, such weights usually undergo an adjustment procedure that “trims” or reduces extreme weights. Again, the motivation is to improve the precision of the survey estimates. The student weight trimming procedure uses a multiple median rule to detect excessively large student weights.
Weighted estimates of population totals for student-level subgroups for a given grade will vary across subjects even though the student samples for each subject generally come from the same schools. These differences are the result of sampling error associated with the random assignment of subjects to students through a process known as spiraling. For state assessments in particular, any difference in demographic estimates between subjects, no matter how small, may raise concerns about data quality. To remove these random differences and potential data quality concerns, a new step was added to the NAEP weighting procedure starting in 2009. This step adjusts the student weights in such a way that the weighted sums of population totals for specific subgroups are the same across all subjects. It was implemented using a raking procedure and applied only to state-level assessments.
Estimates of the sampling variance of statistics derived through the assessment effort are developed through a replication method known as “jackknife.” This process of replication involves the repeated selection of portions of the sample (replicates). A separate set of weights is produced for each replicate, using the same weighting procedures as for the full sample. The replicate weights, in turn, are used to produce estimates for each replicate (replicate estimates). The variability among the calculated replicate estimates is then used to obtain the variance of the full-sample estimate.
Additional information about the weighting procedures used in NAEP can be found in the technical documentation at: http://nces.ed.gov/nationsreportcard/tdw/weighting/.
B.2. Procedures for Collection of Information
B.2.a Recruitment of Schools
Once the sample of schools is selected, the NAEP state coordinator and NAEP field staff typically follow a standard set of procedures for securing the participation of public and nonpublic schools. The process includes:
sending initial contact letters to chief state school and testing officers or diocesan and other nonpublic school administrators (see Appendix D-1 for this letter and Appendix D-2 for the sample endorsement letter from private school organizations);
sending a notice of each school's selection for NAEP to the principal or other administrative official, along with an assessment information packet containing introductory information and materials (see Appendix D-3 for the letter and Appendices D-43 through D-8 for the included information; see Appendices D-20 and D-21 for the versions of Appendices D-3 and D-5 to be used for the 2017 writing comparability study);
sending a notice with each school’s NAEP assessment date to the principal or other administrative official, along with additional assessment information (see Appendix D-9 for the letter and Appendices D-10 and D-11 for the included information; see Appendix D-22 for the version of Appendix D-10 to be used for the writing comparability study);
sending a letter to each school’s principal with instructions for assigning a school coordinator (see Appendix D-12); and,
sending information to each school coordinator regarding his/her role (see Appendix D-13 for the letter and Appendix D-14 for the brochure describing the role).
B.2.b School Coordinator Responsibilities
The school coordinators are responsible for preparing for the assessment in the school using the MyNAEP system, which is an online secure site that provides participating schools with a convenient way to prepare for the upcoming assessment. MyNAEP serves as the primary resource and action center throughout the assessment process. The site also offers school coordinators an electronic way to prepare for the assessment at their own pace. The NAEP field representative will schedule an initial call in December to pre-review the major areas of the MyNAEP system with the school coordinator.
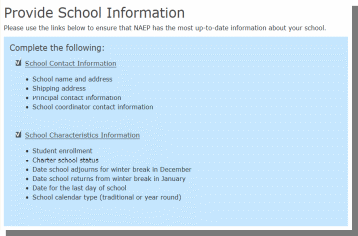
The MyNAEP menu is a virtual checklist of all activities that school coordinators will need to complete throughout the school year. The following describes the different sections and activities that need to be completed, the purpose and timeframe for each, as well as a MyNAEP screen shot of each section4:
Register and Provide School Information
Tasks: Register for the MyNAEP Site and provide school contact information and school characteristics, including student enrollment for the selected grade, charter school status, and important dates.
Purpose: Gain access to the secure MyNAEP website as the designated school coordinator and ensure that NAEP has the most up-to-date information about the school.
Timeline: August and September
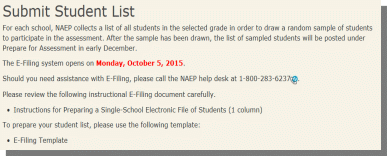
Submit Student List/Sample
Tasks: NAEP collects a list of all students in the selected grade for each school. The school submits an Excel file with all students and their demographic data. Note, as described in Section A.12, the school coordinator is only responsible for this task if the state coordinator has not previously submitted the student list for sampling. As such, only a portion of the school coordinators are responsible for this task.
Purpose: Draw a representative sample of students from the school to participate in the NAEP assessments. Ensure all students have an opportunity to be sampled.
Timeline: October and November
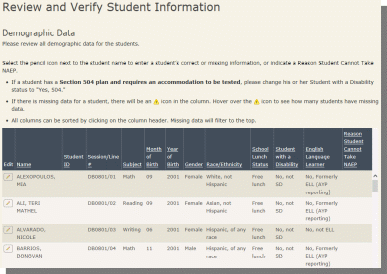
Review and Verify List of Students Selected for NAEP
Tasks: Review demographic data to make sure it is correct and add any missing demographic data.
Purpose: Demographic data is used for reporting results of student groups in the Nation’s Report Card.
Timeline: December and January
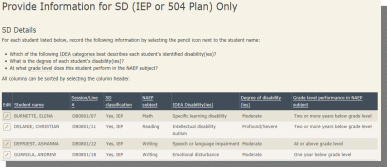
Complete SD/ELL Student Information
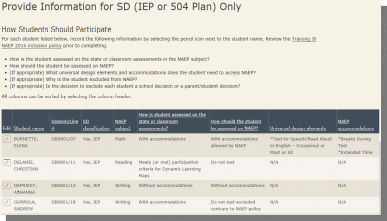
Tasks: Determine how students participate in NAEP (i.e., without accommodations, with accommodations, or do not test). Provide IDEA disability status, English proficiency, primary language, grade-level performance, and accommodations, using the state-specific NAEP inclusion policies (see Appendices D-15 and D-16 for templates of the SD and ELL inclusion policies, which are customized by the NAEP state coordinators).
Purpose: Make sure students have appropriate supports to access the NAEP assessment.
Timeline: December and January
Notify Parents
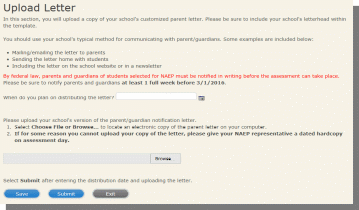
Tasks: Download and customize the parent notification letter (see Appendix D-17 for the template of the letter), upload the customized letter to the system, and certify the date parents were notified.
Purpose: Ensure that parents/guardians are notified of their student’s selection to participate in NAEP, which is a requirement of the Reauthorized Elementary and Secondary Education Act (ESEA).
Timeline: December and January
Manage Questionnaires
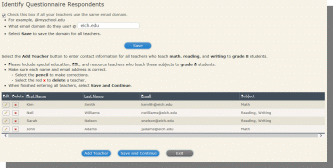
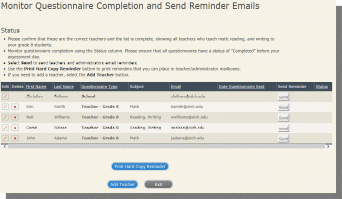
Tasks: Identify respondents for school and teacher questionnaires, send respondents links to online questionnaires, and monitor completion of questionnaires. Distribute information about NAEP to teachers (see Appendix D-18).
Purpose: Results are used to provide contextual data from schools and teachers in the Nation’s Report Card.
Timeline: December and January
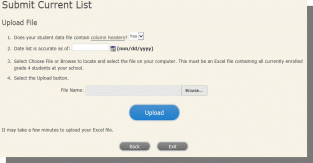
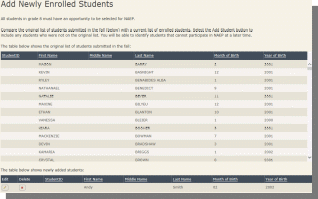
Identify Newly Enrolled Students
Tasks: Identify any newly enrolled students since the original list of students was provided in the fall. Upload a current list of students via Excel or review original list and add newly enrolled students.
Purpose: Ensures all students have an opportunity to be sampled so NAEP can assess a representative sample of students.
Timeline: January
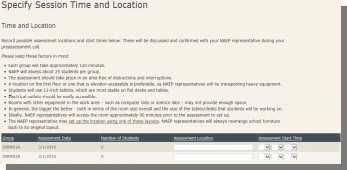
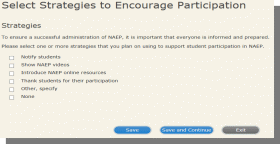
Plan for Assessment Day and Encourage Participation
Tasks: Determine assessment session times and locations, share cell phone policy to ensure security of NAEP items, and make a plan to encourage student participation.
Purpose: Ensure that the school is prepared for a successful administration of NAEP.
Timeline: December and January
Support Assessment Day Activities
Tasks: Print resources to notify students and teachers.
Purpose: Ensure students arrive at assessment location prepared and on time.
Timeline: One week prior to assessment date

Before the assessment, the NAEP field representative will hold a Pre-assessment Review Call with the school coordinator to review the status of the completion of the tasks in the MyNAEP system, answer any questions, and review assessment day procedures.
After each assessment, the field staff will meet with the school coordinator for a debriefing interview. The purpose of this interview is to obtain feedback on how well the assessment went in that school, the usefulness of NAEP materials (publications, letters, etc.), preparation activities, strategies utilized for increasing participation, and any issues that were noted. The debriefing interview questions is included in Appendix E-1. As part of the on-going quality control of the assessment process, 25 percent of the schools will be randomly selected for an additional follow-up survey. Survey questions solicit feedback on pre-assessment, assessment, and procedural processes. The post-assessment follow-up survey is included in Appendix E-2.
The final school coordinator responsibility occurs at the end of the school year during which he or she securely destroys any documents with student identifying information.
B.2.c Administration Procedures
Trained NAEP field staff will set up and administer the assessment and provide all necessary equipment and assessment materials to the school, including paper booklets and pencils for the paper-and-pencil assessments; tablets with an attached keyboard, stylus, earbuds, and, for some subjects, mouse for the digitally based assessments; and laptops with a mouse for the writing comparability study. Internet access is not required for the digitally based assessments (DBAs). NAEP field staff will pack up the equipment and leave the space as they found it.
Assessments are held in sessions of approximately 25 students, with possibly multiple sessions held concurrently (particularly for paper-and-pencil assessments) or two sequential sessions held in the schools (particularly for DBAs).
The field staff use scripts and carefully timed sections to administer the paper-based assessments (PBAs). Most of the instructions for the DBAs are provided on the tablets, from the assessment system.
B.3. Methods to Secure Cooperation, Maximize Response Rates, and Deal with Nonresponse
Schools within each state will be selected and the chief state school officer and the NAEP state coordinator will be asked to solicit their cooperation. Since states and school districts receiving Title I funds are required to participate in the NAEP reading and mathematics assessments (grades 4 and 8) under the National Assessment of Educational Progress Act, NAEP response rates have improved for these assessments. Two areas that have typically had lower response rates in NAEP are grade 12 students and private schools. As such, NCES has created specialized materials targeted at these audiences:
The Best Practices Guide provides resources and strategies to increase twelfth-grade student motivation and participation (see Appendix D-19);
Videos and additional information on the NAEP website for schools, students, parents, and teachers (see http://nces.ed.gov/nationsreportcard/about/schools.aspx); and
Additional brochures and resources targeting private schools, including Overview of NAEP for Private Schools (see Appendix D-8), NAEP in Your Private School (see Appendix D-11), and a webpage dedicated just to private schools (http://nces.ed.gov/nationsreportcard/about/nonpublicschools.aspx).
B.3.a. Methods to Maximize Response Rate
There are four main areas that can be focused on in order to maximize completion rates: (1) early distribution of information and materials, (2) effective communication with school personnel, (3) efforts to encourage student participation, and (4) efforts made by field staff to avoid refusals and to convert initial refusals to cooperating schools.
Early Distribution of Information and Materials
Over the years, feedback from schools and states had indicated that notification of a school’s selection in the NAEP sample earlier rather than later is beneficial to the school for planning purposes, and improves school response rate. As such, NAEP generally notifies schools of selection in May of the year prior to the assessment. In addition, to facilitate the school coordinators’ completion of the tasks associated with the administration, the MyNAEP system is available to the school coordinators approximately 6-7 weeks before the administration window begins.
Effective Communication with School Staff
The participation of schools can be increased by effectively communicating information about NAEP, including what NAEP measures, the various assessment components, why it is important that schools, students, and teachers participate, and the role of the school staff. Effective communication materials from the state coordinator and the field staff (as described in Section B.2.a) will help maximize the participation of schools. In addition, an intuitive and easy to use MyNAEP system (as described in Section B.2.b) will help ensure that the school coordinator’s experience is positive.
Encouraging Student Participation
Previous feedback from school administrators has shown that students respond more positively to the assessment when they know the assessment has the support of the school administration. Therefore, the field staff will encourage the school coordinator to make efforts to encourage students to do their best, including having the principal introduce the assessment. In addition, field staff will suggest to the school coordinator that grade 8 and 12 schools may want to issue community service credits for participating. Given that grade 12 student participation can be particularly challenging, NAEP has developed a Best Practices Guide to encourage grade 12 participation (see Appendix D-19), which is shared with sampled high schools.
Avoiding Refusals and Converting Initial School Refusals
Field staff will be trained in methods to maximize school participation, which will include being flexible in the assessment scheduling, following up with the school coordinators, and scheduling in-person preparation meetings, at the school coordinator’s request.
B.3.b. Statistical Approaches to Nonresponse
Not all of the students in the sample will respond. Some will be unavailable during the sample time period because of absenteeism or other reasons. If a student decides not to participate, the action will be recorded, but no steps will be taken to obtain participation. The NAEP response rates follow AAPOR (American Association for Public Opinion Research) guidelines. Response rates, in percentages, from the 2013 NAEP assessment are shown below and can be found in the technical documentation (for example, http://nces.ed.gov/nationsreportcard/tdw/sample_design/2007/sampdsgn_2007_state_schlresp.aspx):
|
Grade 4 |
Grade 8 |
Grade 12 |
Student Response Rates |
95 |
93 |
84 |
School Response Rates |
|
|
|
Public Schools |
100 |
100 |
93 |
Private Schools |
71 |
70 |
53 |
Note: The public school response rates for grades 4 and 8 rounded to 100, but were actually slightly lower (i.e., 99.7 percent).
NCES and the National Assessment Governing Board have established participation rate standards that states and jurisdictions are required to meet in order to have their results published. Beginning in 2003, if a state’s school response rate is below 85%, the results will not be published by NAEP, regardless of the response rate after substitution (see https://www.nagb.org/content/nagb/assets/documents/policies/samplingpolicy1.pdf).
B.4. Purpose of Pilot Testing and Data Uses
Pilot testing of cognitive and non-cognitive items is carried out in all subject areas. The purpose of pilot testing is to obtain information regarding clarity, difficulty levels, timing, and feasibility of items and conditions. In addition to ensuring that items measure what is intended, the data collected from pilot tests serve as the basis for selecting the most effective items and data collection procedures for the subsequent operational assessments. Pilot testing is a cost-effective means for revising and selecting items prior to an operational data collection because the items are administered to a small nationally representative sample of students and data are gathered about performance that crosses the spectrum of student achievement. Items that do not work well can be dropped or modified before the operational administration.
Prior to pilot testing, many new items are pre-tested with small groups of sample participants (cleared under the NCES pretesting generic clearance agreement; OMB #1850-0803). All non-cognitive items undergo one-on-one cognitive interviews, which is useful for identifying questionnaire and procedural problems before larger scale pilot testing is undertaken. Select cognitive items also undergo pre-pilot testing, such as item tryouts or cognitive interviews, in order to test out new item types or formats, or challenging content. In addition, usability testing is conducted on new technologies and technology based platforms and instruments.
B.5. Consultants on NAEP Design
ETS, Fulcrum, Westat, and NCES staffs have collaborated on aspects of the design. The primary persons responsible from NCES are: Peggy Carr, Patricia Etienne, Holly Spurlock, and William Tirre; from ETS: Jay Campbell and Andreas Oranje; from Westat: Keith Rust and Dianne Walsh, and Scott Ferguson from Fulcrum. In addition, the NAEP Design and Analysis Committee, the NAEP Validity Studies, and the NAEP Quality Assurance Technical panel members (see Appendices A-1 through A-3) have also contributed to NAEP designs on an on-going basis.
1 NAEP IRT scaling requires a minimum sample size of 1,500-2,000 students per item in order to estimate stable item parameters. Therefore, national assessments with larger item pools have larger samples.
2 NAEP IRT scaling is conducted for most pilot assessments, requiring a minimum of 1,500-2,000 students per item in order to estimate stable item parameters. Therefore, pilot assessments with larger item pools have larger samples.
3 The informational or recruitment materials are customized for each assessment year. For some of the materials, the most recent version (i.e., for the 2016 assessment) is included. The specific documents for the 2017-2019 assessments will be updated to reflect the specific subjects assessed.
4 All screenshots that contain student or school information contain mock data, presented for the purpose of describing the type of information that is collected.
| File Type | application/vnd.openxmlformats-officedocument.wordprocessingml.document |
| File Title | System Clearance Part B - revisions with track changes |
| Author | joconnell |
| File Modified | 0000-00-00 |
| File Created | 2021-01-23 |
© 2026 OMB.report | Privacy Policy