Summarized Survey - 2006 Terms of Clearance
Survey Report 1-14-08 general.doc
Survey of Customers of the Official Grain Inspection and Weighing System
Summarized Survey - 2006 Terms of Clearance
OMB: 0580-0018
Table of Contents
Executive Summary 3
Survey Sample 5
FGIS Customer Survey Overall Results 6
Percentage of Respondents Who Agreed and Strongly Agreed 8
Percentage of Respondents Who Disagreed and Strongly Disagreed 9
Detailed Findings 11
Comparison of 1996, 2000 and 2007 survey results 12
Summary Question 10: Requests for service by commodity 16
Summary Question 11: Percent of product officially inspected 17
Summary Question 12: Open-ended answers 18
Executive Summary
The true quality and value of any service is best measured by the customer. The official grain inspection and weighing system has long relied on customer input to better understand their needs and the system’s performance. The official system is a unique public/private network comprised of the Grain Inspection, Packers and Stockyards Administration’s Federal Grain Inspection Service (FGIS) and the private and State agencies that FGIS oversees. The system provides impartial inspection and weighing services for grain, oilseeds, and related products. In FY 2007, the official system provided over 3 million inspections on over 294.2 million metric tons of America’s grain.
From September through November 2007, FGIS surveyed customers of the official inspection and weighing system. FGIS mailed surveys to 1,018 customers of 43 private official agencies, 12 State agencies, and 5 FGIS field offices (i.e., League City, TX; New Orleans, LA; Portland, OR; Stuttgart, AR; and Toledo, OH). Of the total mailed, 49 surveys did not reach the intended recipient. Five-hundred-five (505) of the remaining 969 customers who received the survey completed it, for a response rate of 52 percent.
FGIS followed a two-step process to administer the survey: (1) FGIS mailed surveys to 1,018 customers in September 2007; and (2) the FGIS Deputy Administrator mailed reminder postcards to all 1,018 customers approximately 2 weeks after the initial mailing.
The survey was comprised of 12 questions. Customers were asked to select a response using a scale of 1-5 for the first nine questions:
Strongly Disagree
Disagree
No Opinion
Agree
Strongly Agree
In the 1996, 2000, and 2007 survey responses, customers rated FGIS highest in the areas of timeliness of services (i.e., questions 1 and 2) and overall quality of services (i.e., question 9). We attribute satisfaction in these areas due to the fact that more official service providers have been adding on-site laboratories offering quicker services, and more providers are also providing electronic inspection results. FGIS will not be satisfied with the status quo, however, and will continue to make strides to increase satisfaction levels to even higher levels in these areas. FGIS is currently implementing a major initiative called, "FGIS OnLine," which will provide customers with web-based access to results and will improve internal business operations.
Over the course of the three surveys, FGIS not only learned that customers were satisfied with the timeliness and overall quality of services, but that they were least satisfied with the cost of services and the accuracy and consistency of results. To this end, FGIS has undertaken several complex initiatives with the goal of improving our performance in these areas. Within one year of completing the 2000 survey, FGIS undertook a review of its quality assurance and control processes. FGIS has implemented key aspects of the review, such as an organizational restructuring, and expects to improve its ability to provide highly accurate and consistent results.
FGIS has continued over the years to take steps to improve the cost efficiency of its programs and services. Several years after the 2000 survey, FGIS implemented a revised fee structure for its inspection and weighing program. Currently, FGIS is carefully reviewing its fee structure for its commodity inspection program. It is worth noting, that although customers expressed the least level of satisfaction with the cost of services, overall satisfaction levels have increased by over 12 percent from the 1996 to 2007 survey.
The FGIS senior management team seriously considers the results of the customer surveying process. The results of this survey will be considered during the designation process. FGIS Compliance Division will refer to the survey results and follow-up, as appropriate, with official agencies and field offices. The next FGIS customer survey will be conducted in Fiscal Year 2009.
Survey Sample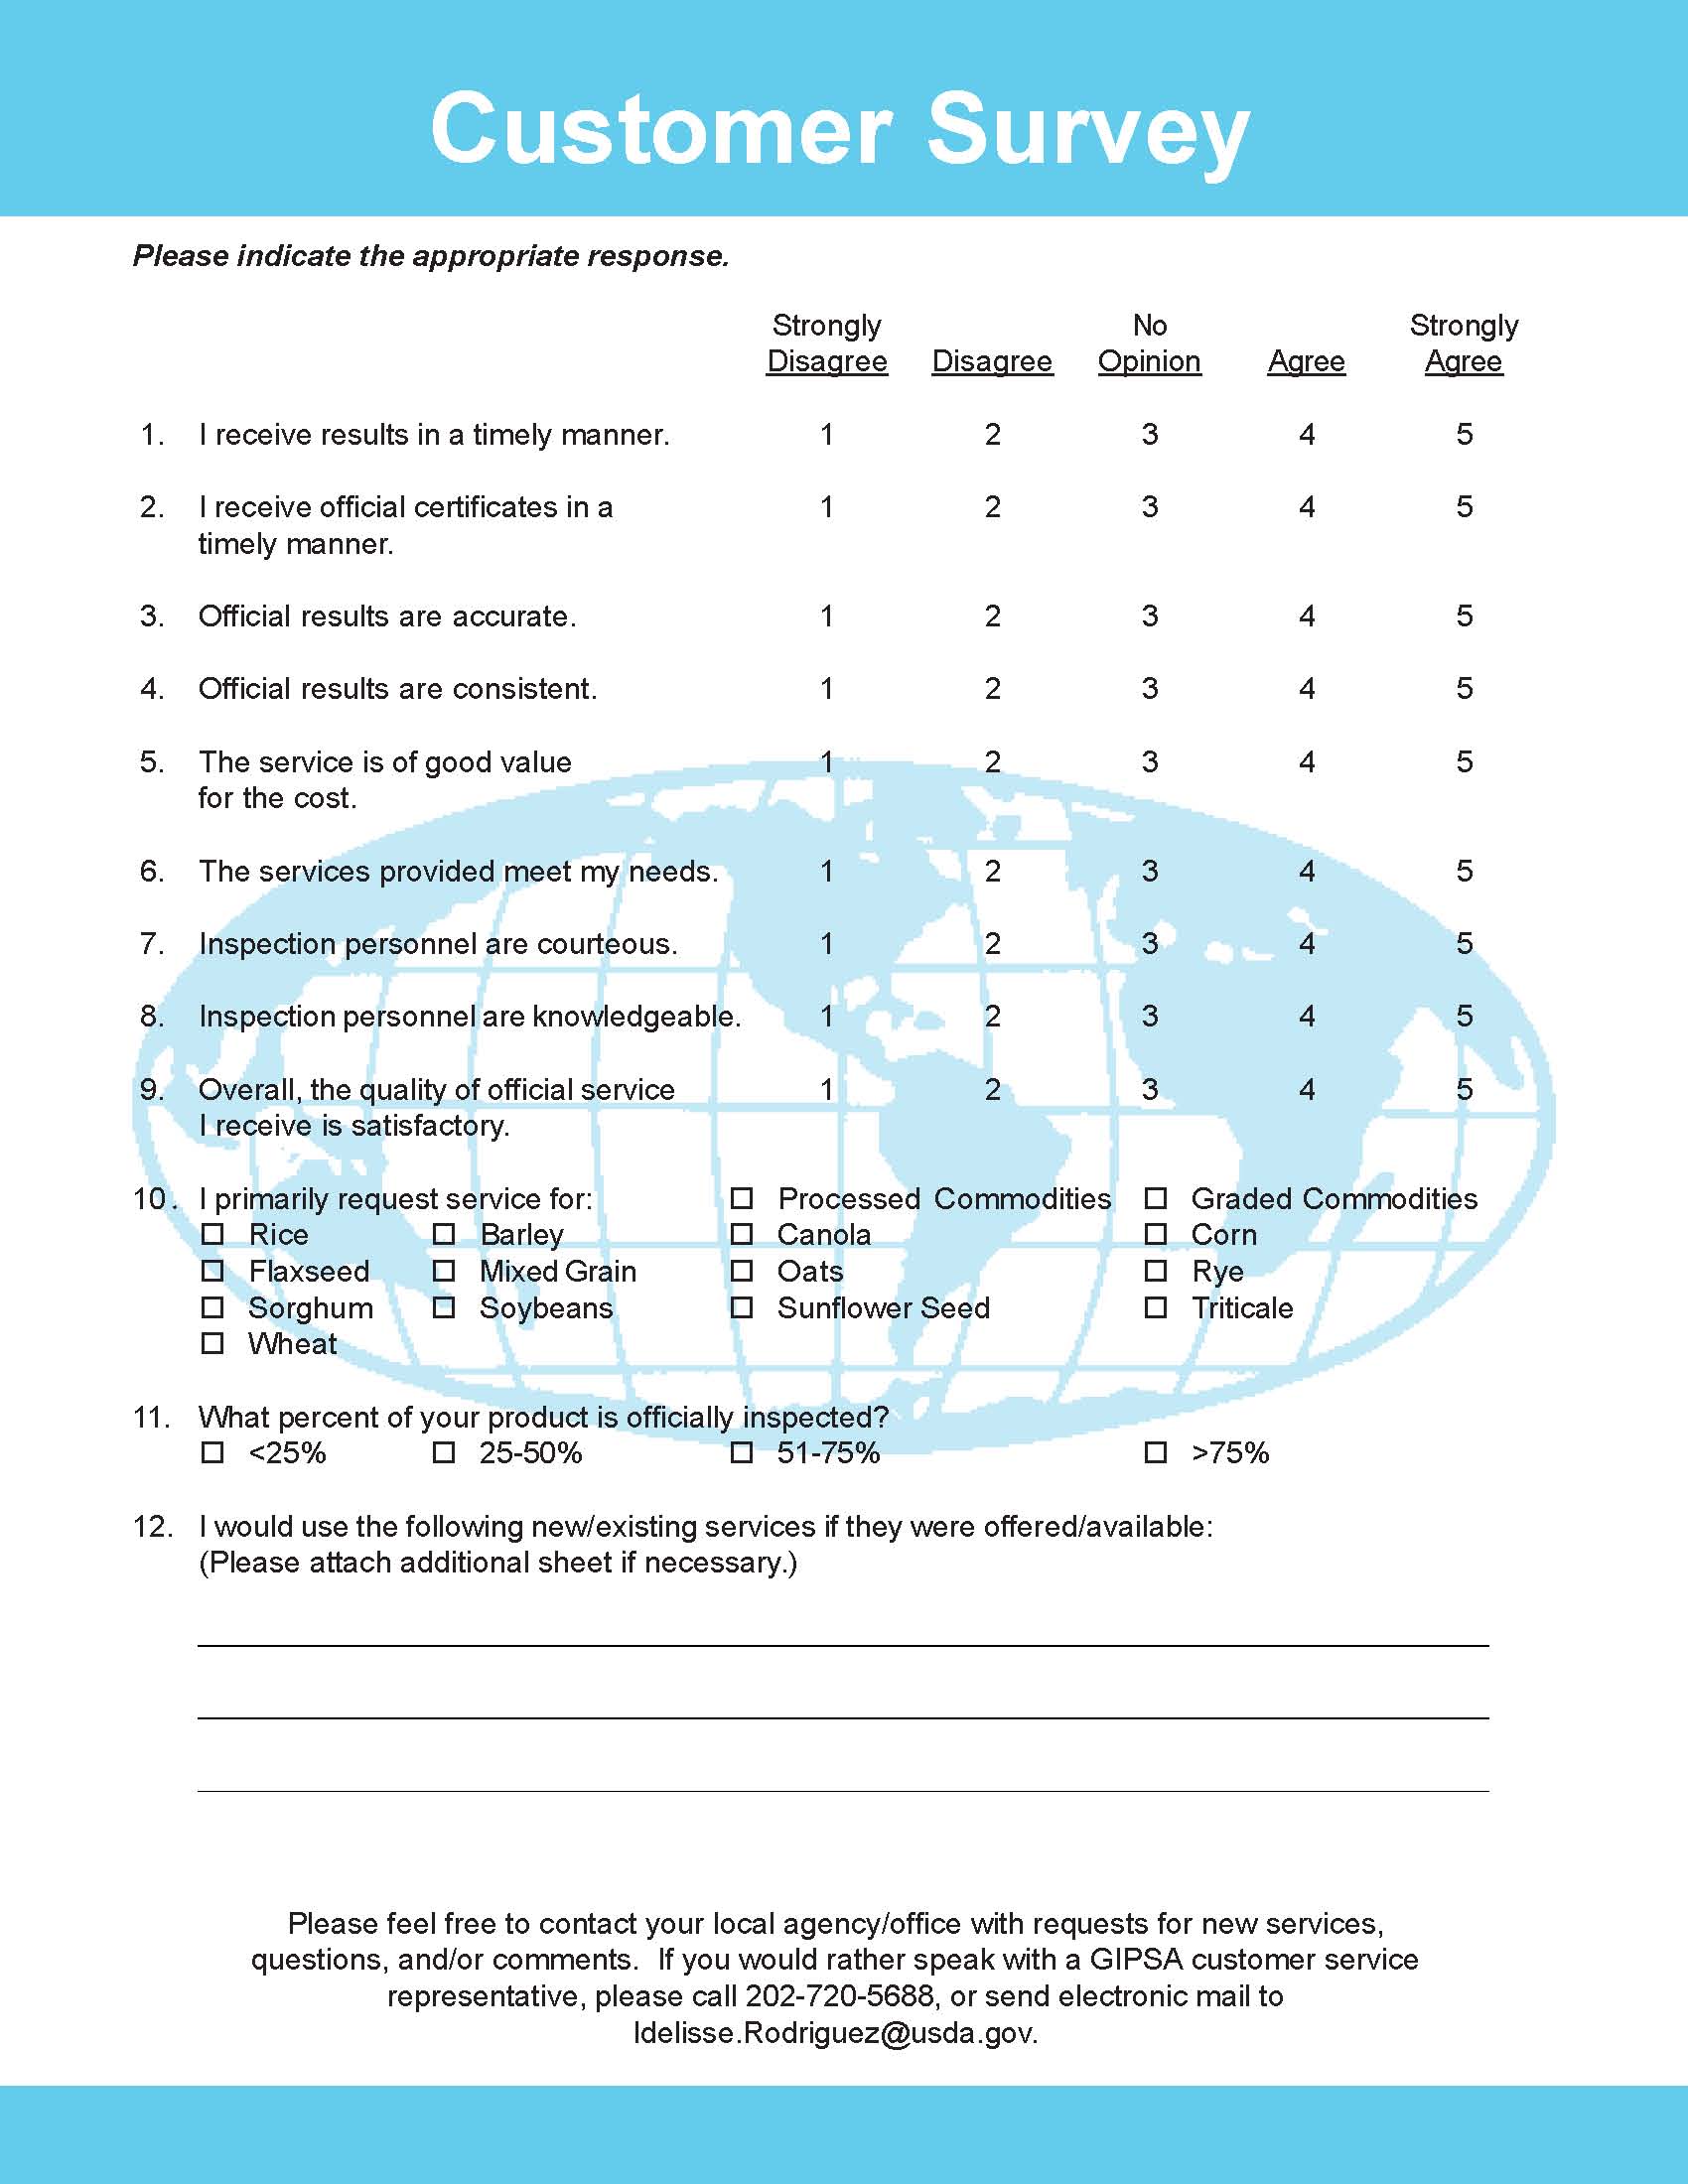
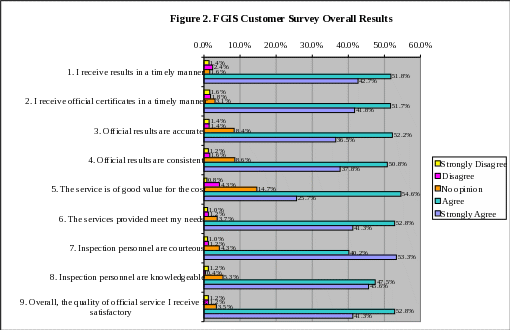
Figure 1. FGIS Customer Survey Overall Results |
|||||||||||
|
Strongly Disagree |
Disagree |
No opinion |
Agree |
Strongly Agree |
Totals |
|||||
Question |
# |
% |
# |
% |
# |
% |
# |
% |
# |
% |
|
1. I receive results in a timely manner |
7 |
1.4 |
12 |
2.4 |
8 |
1.6 |
256 |
51.8 |
211 |
42.7 |
494 |
2. I receive official certificates in a timely manner |
8 |
1.6 |
9 |
1.8 |
15 |
3.1 |
254 |
51.7 |
205 |
41.8 |
491 |
3. Official results are accurate |
7 |
1.4 |
7 |
1.4 |
41 |
8.4 |
256 |
52.2 |
179 |
36.5 |
490 |
4. Official results are consistent |
6 |
1.2 |
8 |
1.6 |
42 |
8.6 |
249 |
50.8 |
185 |
37.8 |
490 |
5. The service is of good value for the cost |
4 |
0.8 |
21 |
4.3 |
72 |
14.7 |
268 |
54.6 |
126 |
25.7 |
491 |
6. The services provided meet my needs |
5 |
1.0 |
6 |
1.2 |
18 |
3.7 |
260 |
52.8 |
203 |
41.3 |
492 |
7. Inspection personnel are courteous |
5 |
1.0 |
6 |
1.2 |
21 |
4.3 |
198 |
40.2 |
263 |
53.3 |
493 |
8. Inspection personnel are knowledgeable |
6 |
1.2 |
2 |
0.4 |
26 |
5.3 |
233 |
47.5 |
224 |
45.6 |
491 |
9. Overall, the quality of official service I receive is satisfactory |
6 |
1.2 |
6 |
1.2 |
17 |
3.5 |
260 |
52.8 |
203 |
41.3 |
492 |
The following table presents the combined percentages of respondents who agreed and strongly agreed with questions 1-9
Figure 3. Percentage of Respondents Who Agreed and Strongly Agreed with Questions 1-9 |
||||
Question |
Private Official Agencies |
State Official Agencies |
FGIS Offices |
All |
1. I receive results in a timely manner |
94.4 |
93.1 |
100.0 |
94.5 |
2. I receive official certificates in a timely manner |
95.4 |
81.4 |
96.8 |
93.5 |
3. Official results are accurate |
89.5 |
84.1 |
90.0 |
88.8 |
4. Official results are consistent |
89.5 |
84.3 |
87.1 |
88.6 |
5. The service is of good value for the cost |
81.7 |
73.6 |
77.4 |
80.2 |
6. The services provided meet my needs |
94.9 |
87.3 |
100.0 |
94.1 |
7. Inspection personnel are courteous |
94.1 |
87.5 |
100.0 |
93.5 |
8. Inspection personnel are knowledgeable |
92.8 |
91.7 |
100.0 |
93.1 |
9. Overall, the quality of official service I receive is satisfactory |
94.4 |
90.3 |
100.0 |
94.1 |
The following table presents the combined percentages of respondents who disagreed and strongly disagreed with questions 1-9
Figure 4. Percentage of Respondents Who Disagreed and Strongly Disagreed with Questions 1-9 |
||||
Question |
Private Official Agencies |
State Official Agencies |
FGIS Offices |
All |
1. I receive results in a timely manner |
3.6 |
6.9 |
0.0 |
3.8 |
2. I receive official certificates in a timely manner |
2.1 |
11.4 |
3.2 |
3.5 |
3. Official results are accurate |
2.8 |
4.3 |
0.0 |
2.9 |
4. Official results are consistent |
2.6 |
4.3 |
3.2 |
2.9 |
5. The service is of good value for the cost |
4.4 |
8.3 |
6.5 |
5.1 |
6. The services provided meet my needs |
2.1 |
4.2 |
0.0 |
2.2 |
7. Inspection personnel are courteous |
1.8 |
5.6 |
0.0 |
2.2 |
8. Inspection personnel are knowledgeable |
1.5 |
2.8 |
0.0 |
1.6 |
9. Overall, the quality of official service I receive is satisfactory |
1.8 |
6.9 |
0.0 |
2.4 |
The percentages from the two tables above will not add up to 100% due to rounding and the exclusion of “no opinion” responses, which do not imply satisfaction or dissatisfaction.
Responses to questions 10, 11, and 12, supporting data for all questions, and a comparison of the results of this survey and two identical surveys administered in 1996 and 2000 appear in the Detailed Findings section of this report.
Detailed Findings
Comparison of 1996, 2000 and 2007 Survey Results
FGIS conducted mail-out surveys of the paying customers of the official inspection and weighing system in 1996 and 2000. For the 1996 survey, 1,821 of the 9,708 surveys sent were completed, for a response rate of only 18.8%. FGIS determined that the 1996 customer database contained many duplicate entries. For the 2000 survey, FGIS built a new customer database that increased the response rate to 49.8 % (1,137 of the 2,281 surveys sent were completed).
Again for the 2007 survey, FGIS built a new customer database with updated information provided by each official private and State agency, and FGIS offices. For the sake of time and cost-efficiency, FGIS sent surveys to a statistically representative sample of the program’s entire population of 9,459 customers. For agencies and field offices with 20 or more customers, FGIS sent surveys to 20 randomly selected customers. For those with fewer than 20 customers, FGIS sent surveys to each of their customers. In total, FGIS mailed out 1018 surveys and achieved a 52% response rate. Responses were received from customers of all 43 private official agencies, 12 State agencies and 5 FGIS offices.
The figure on page 12 provides a comparison of satisfaction levels (i.e., percentage of respondents who agreed and strongly agreed) among the 1996, 2000, and 2007 surveys. Similar data for the 2000 and 2007 are available on page 14 for dissatisfaction levels (i.e., percentage of respondents who disagreed and strongly disagreed). No data on dissatisfaction levels are available from the 1996 survey due to a procedural change implemented for the 2000 survey. In 1996, the percentages of respondents who had no opinion, disagreed, and strongly disagreed were totaled to determine overall dissatisfaction for each question. It was subsequently determined that “no opinion” should not have been added to the other percentages. Consequently, FGIS calculated the level of dissatisfaction for the 2000 and 2007 surveys by adding the percentages of respondents who disagreed and strongly disagreed with each response.
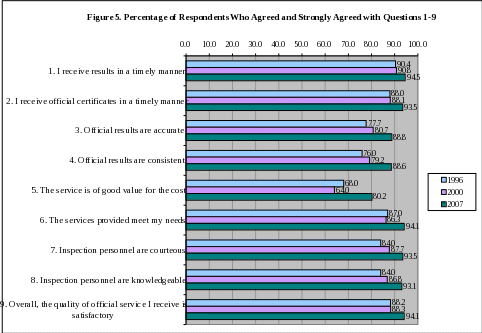
Figure
6. Percentage of Respondents Who Agreed and Strongly Agreed with
Questions 1-9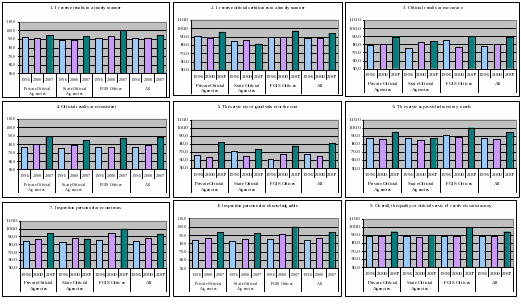
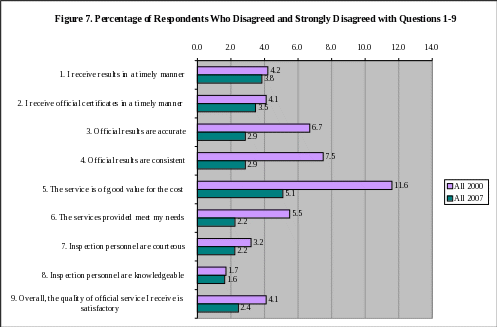
Figure
8. Percentage of Respondents Who Disagreed and Strongly Disagreed
with Questions 1-9
Q |
||
Commodity |
# |
% |
Corn |
344 |
33.8 |
Wheat |
258 |
25.3 |
Soybeans |
244 |
24.0 |
Barley |
40 |
3.9 |
Sorghum |
31 |
3.0 |
Oats |
20 |
2.0 |
Rice |
19 |
1.9 |
Processed Commodities |
15 |
1.5 |
Graded Commodities |
12 |
1.2 |
Sunflower Seed |
11 |
1.1 |
Canola |
8 |
0.8 |
Flaxseed |
8 |
0.8 |
Mixed Grain |
3 |
0.3 |
Other |
2 |
0.2 |
Rye |
2 |
0.2 |
Triticale |
1 |
0.1 |
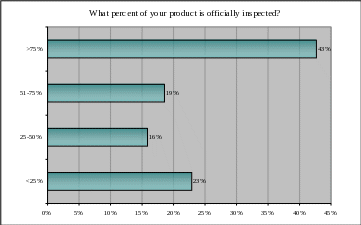
QUESTION 11. WHAT PERCENT OF YOUR PRODUCT IS OFFICIALLY INSPECTED? |
||
|
# |
% |
<25% |
111 |
23 |
25-50% |
77 |
16 |
51-75% |
90 |
19 |
>75% |
207 |
43 |
Topic Clusters |
# of Comments |
Electronic Services |
15 |
Additional Services |
12 |
Dissatisfaction with Service |
12 |
Do not use F/O or OA Services |
9 |
Positive Comments |
6 |
Other |
8 |
Total |
62 |
12% of surveys received had comments (62 out of 505)
| File Type | application/msword |
| Author | IRodriguez |
| Last Modified By | htbutler |
| File Modified | 2009-05-18 |
| File Created | 2009-05-18 |
© 2026 OMB.report | Privacy Policy
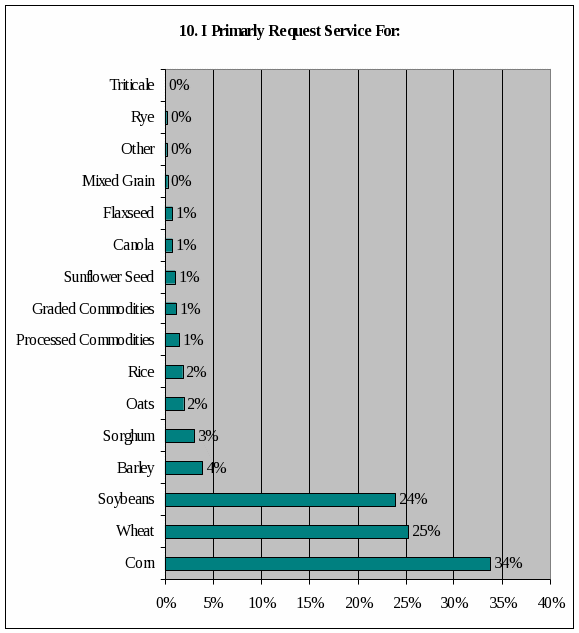 UESTION
10. I PRIMARILY REQUEST SERVICE FOR: