Significant Weather Event Communication Survey
NOAA Customer Surveys
NOAA_NWS_Significant Weather Event Communication Survey_11_12_14
Significant Weather Event Communication Survey
OMB: 0648-0342
Significant Weather Event Communication Survey
You can affect how NOAA’s National Weather Service (NWS)1 conveys significant weather events such as snowstorms, tornadoes, hurricanes, flooding, and more.
This survey will show you a few images that the NWS is considering to convey significant weather events. The survey will ask for your opinion on how well the images are providing important information about the events.
Eastern Research Group is doing this study for the NWS. This is not a commercial survey and your identity will not be disclosed.
Completing this survey is voluntary. By selecting “AGREE AND CONTINUE” below, you are indicating that you have read this and agree to participate in this survey. Otherwise, please select “Exit."
Thank you for taking the time to answer these questions.
Paperwork Reduction Act Statement: Public reporting burden for this collection of information is estimated to average 10 minutes per response, including the time for reviewing instructions, searching existing data sources, gathering and maintaining the data needed, and completing and reviewing the collection of information. Send comments regarding this burden estimate or any other suggestions for reducing this burden to Sarah Brabson, NOAA National Weather Service, SSMC 2, Room 17205, 1325 East West Highway, Silver Spring, MD. Notwithstanding any other provisions of the law, no person is required to respond to, nor shall any person be subjected to a penalty for failure to comply with, a collection of information subject to the requirements of the Paperwork Reduction Act, unless that collection of information displays a currently valid OMB Control Number. Confidentiality Statement: All data will remain confidential. There are no questions that ask for identifying information such as names or email addresses. Additionally, participants will not be taking the survey on their own equipment. Rented laptops will be used instead, which means that no IP addresses can be traced to an individual participant. The data is anonymous.
_____AGREE AND CONTINUE
_____EXIT
Section 1. Color
The following questions are about your interpretations of color. Please read the directions for each question carefully.
1. The Phoenix Metro area is in a flash flood warning. News has emerged that there is a river of water dangerously traveling toward communities east of Phoenix. Which of the following maps best conveys the danger of this flood emergency?
Map 1
Map 2
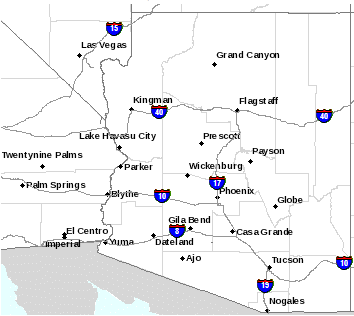


a. Map 1 (Black)
b. Map 2 (Purple)
2. Currently the Phoenix Metro area doesn’t have any severe weather. Which of these maps depicts no severe weather?
Map 1
Map 2


Map 3


a. Map 1 (Blank)
b. Map 2 (Blue)
c. Map 3 (Green)
3. Please rank (from 1-10) the danger represented by the following colors (with 1= low danger and 10 = high danger).
|
|
|
|
|
|
|
|
|
|
|
|
|
|
|
|
|
|
|
|
--Page Break for Survey—
Section 2. Language
4. Please write a word or phrase to describe severe weather that:
May Occur: _________________________
Will Occur: _________________________
5. On a scale from 1-5, if forecasters are describing a severe weather event, how serious is the threat posed by each of these words or phrases?
|
Not serious |
Somewhat serious |
Serious |
Very serious |
Extremely serious |
Danger |
1 |
2 |
3 |
4 |
5 |
Hazardous |
1 |
2 |
3 |
4 |
5 |
Potential |
1 |
2 |
3 |
4 |
5 |
Warning |
1 |
2 |
3 |
4 |
5 |
Life-Threatening |
1 |
2 |
3 |
4 |
5 |
Threat |
1 |
2 |
3 |
4 |
5 |
Caution |
1 |
2 |
3 |
4 |
5 |
Monitor |
1 |
2 |
3 |
4 |
5 |
Alert |
1 |
2 |
3 |
4 |
5 |
Emergency |
1 |
2 |
3 |
4 |
5 |
6. On a scale from 1-5, how soon do you expect to feel the severe weather impacts posed by each of these words or phrases?
|
Not at all soon |
Slightly soon |
Soon |
Very soon |
Now |
Danger |
1 |
2 |
3 |
4 |
5 |
Hazardous |
1 |
2 |
3 |
4 |
5 |
Potential |
1 |
2 |
3 |
4 |
5 |
Warning |
1 |
2 |
3 |
4 |
5 |
Life-Threatening |
1 |
2 |
3 |
4 |
5 |
Threat |
1 |
2 |
3 |
4 |
5 |
Caution |
1 |
2 |
3 |
4 |
5 |
Monitor |
1 |
2 |
3 |
4 |
5 |
Alert |
1 |
2 |
3 |
4 |
5 |
Emergency |
1 |
2 |
3 |
4 |
5 |
Section 3a. Feedback on Prototypes
In this next section, you will be asked to answer a few questions based on images for a weather warning system.
Please look at the following National map:
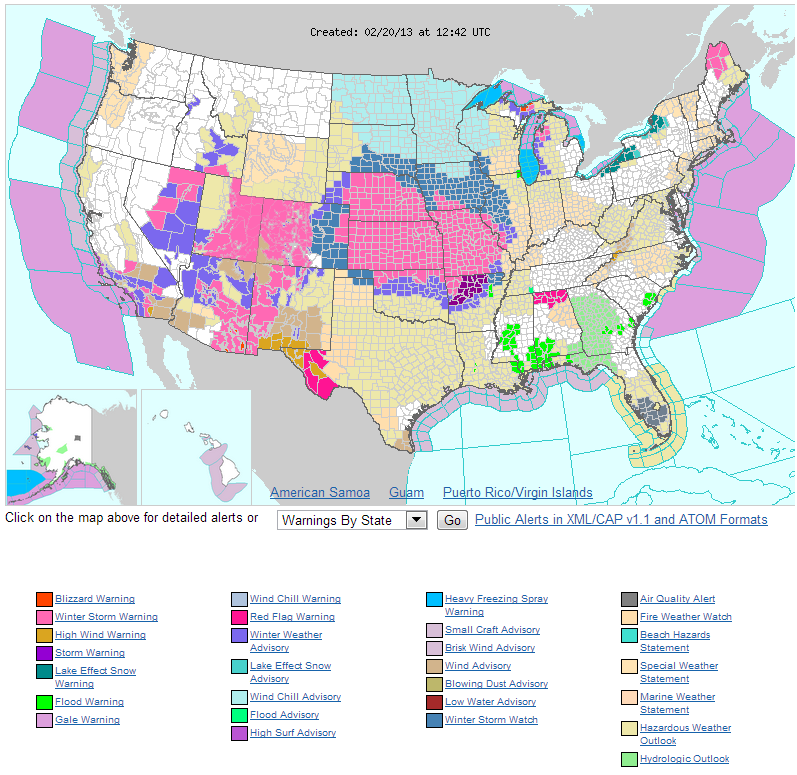
7. Based on your initial reaction to this map, what do the colors represent? [Open-ended]
8. How would you rate this map based on the following qualities?
|
Poor |
Fair |
Good |
Very Good |
Excellent |
Conveys hazard type |
|
|
|
|
|
Provides timing |
|
|
|
|
|
Shows forecast confidence |
|
|
|
|
|
Communicates impacts |
|
|
|
|
|
Suggests actions to take |
|
|
|
|
|
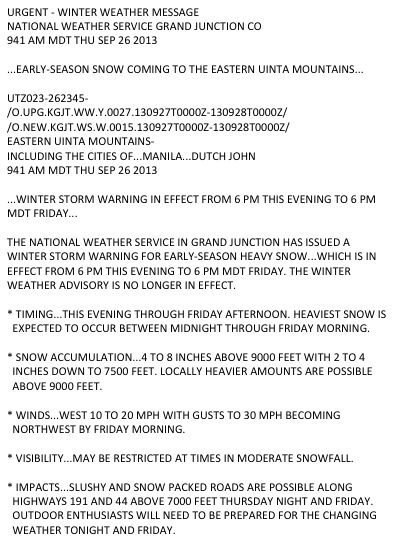
9. How would you rate this image based on the following qualities?
|
Poor |
Fair |
Good |
Very Good |
Excellent |
Conveys hazard type |
|
|
|
|
|
Provides timing |
|
|
|
|
|
Shows forecast confidence |
|
|
|
|
|
Communicates impacts |
|
|
|
|
|
Suggests actions to take |
|
|
|
|
|
Section 3b. Feedback on Prototypes
In this next section, you will be asked to answer a few questions based on images for a weather warning system.
P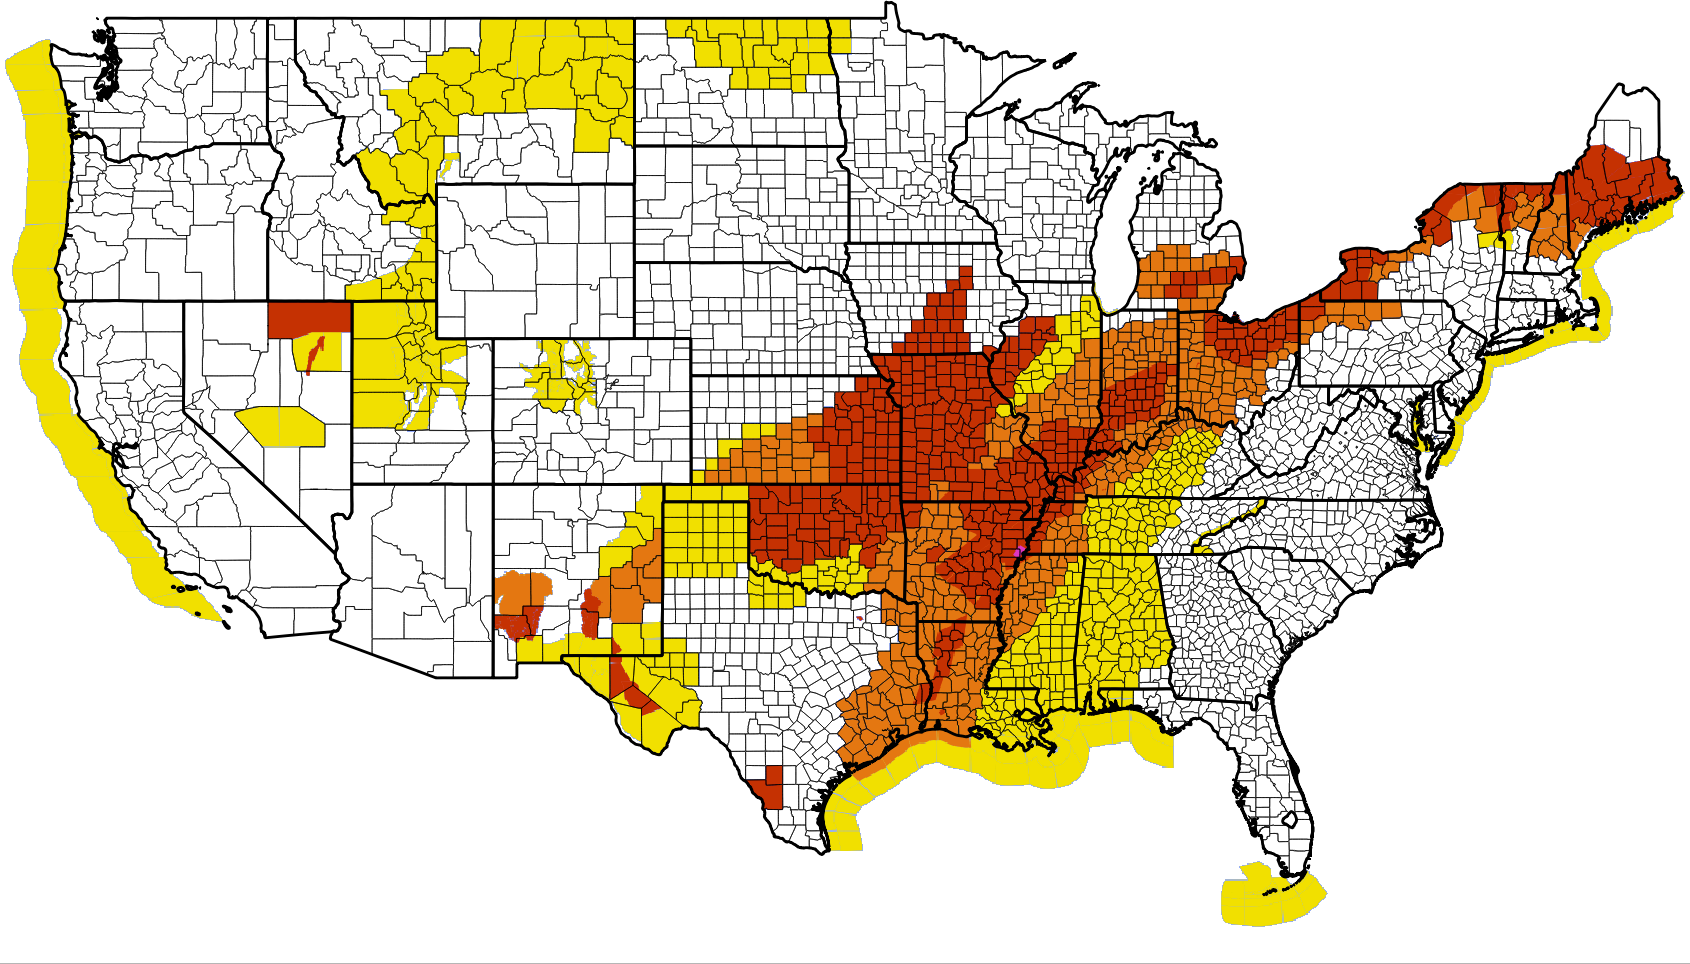
lease
look at the following national map:
Be aware: Significant hazardous weather may occur. |
Be prepared: Significant hazardous weather is imminent or occurring. |
Take action: Dangerous weather conditions are imminent or occurring. |
11. How would you rate this map based on the following qualities?
|
Poor |
Fair |
Good |
Very Good |
Excellent |
Conveys hazard type |
|
|
|
|
|
Provides timing |
|
|
|
|
|
Shows forecast confidence |
|
|
|
|
|
Communicates impacts |
|
|
|
|
|
Suggests actions to take |
|
|
|
|
|
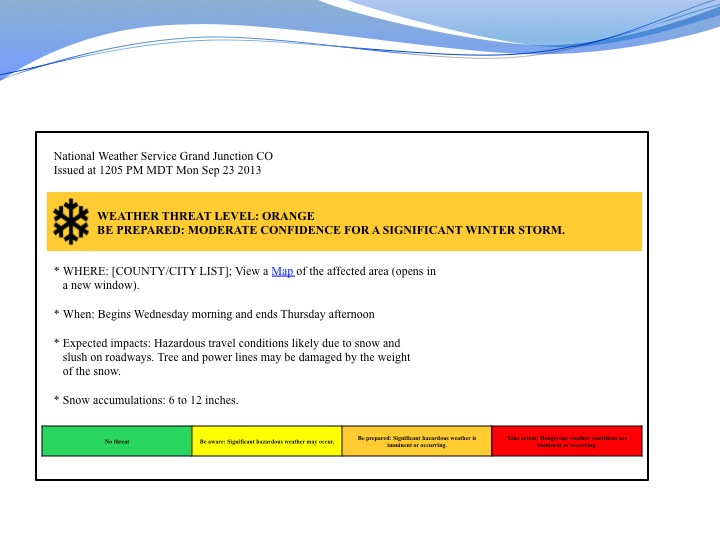
12. How would you rate this image based on the following qualities?
|
Poor |
Fair |
Good |
Very Good |
Excellent |
Conveys hazard type |
|
|
|
|
|
Provides timing |
|
|
|
|
|
Shows forecast confidence |
|
|
|
|
|
Communicates impacts |
|
|
|
|
|
Suggests actions to take |
|
|
|
|
|
Section 3c. Feedback on Prototypes
In this next section, you will be asked to answer a few questions based on images for a weather warning system.


 Coastal
flood warning
 Storm
warning
 Frost
advisory
 Winter
storm watch
 Wind
advisory
 Severe
thunderstorm watch
 Flood
advisory
Tornado watch
13. How would you rate this image based on the following qualities?
|
Poor |
Fair |
Good |
Very Good |
Excellent |
Conveys hazard type |
|
|
|
|
|
Provides timing |
|
|
|
|
|
Shows forecast confidence |
|
|
|
|
|
Communicates impacts |
|
|
|
|
|
Suggests actions to take |
|
|
|
|
|


14. Of these three maps, which one does the BEST JOB of:
|
Map #1: Multiple (>100 colors)
|
Map #2: 4 colors (green, yellow, orange, red)
|
Map #3: 22 colors (saturated/unsaturated colors) |
Conveys hazard type |
|
|
|
Provides timing |
|
|
|
Shows forecast confidence |
|
|
|
Communicates impacts |
|
|
|
Suggests actions to take |
|
|
|
Demographics
15. Are you?
Male
Female
Other/prefer not to answer
16. What is your age?
17. What is the highest level of formal education you have completed?
Less than high school
Some high school
High school graduate
Some college
 Trade/technical/vocational
training
 College
graduate
College
graduateSome postgraduate work
Post graduate degree
18. What is your level of expertise in meteorology?
No expertise
I’m a novice
General understanding
A few years of experience/practice
I’m an expert
19. What is the primary language that you speak at home?
English
Spanish
Other (please specify)
20. Are you color blind?
1 The National Weather Service is the official weather forecasting service for the United States.
| File Type | application/vnd.openxmlformats-officedocument.wordprocessingml.document |
| Author | Gina Eosco |
| File Modified | 0000-00-00 |
| File Created | 2021-01-31 |
© 2026 OMB.report | Privacy Policy


